From the free course AP Calculus AB on Lykke
6.1 Exploring Accumulations of Change
Key concepts: Accumulation of change · Area under a curve as accumulation · Interpreting rates of change in context · Positive and negative rates and signed accumulation · Net change versus total change · Geometric area using straight-line graphs · Unit analysis for rates and accumulation · Velocity–time interpretation · Using tabulated data to approximate change
How a rate of change accumulates into a total change, read as signed area with units, and how net change differs from total change.
6.1 Exploring Accumulations of Change
A rate tells you how quickly a quantity changes; accumulating that rate over time tells you how much the quantity changes altogether. A faucet flowing at $4$ liters per second for $60$ seconds does not add “$4$ liters”—it adds approximately $4(60)=240$ liters.
From rate to accumulation
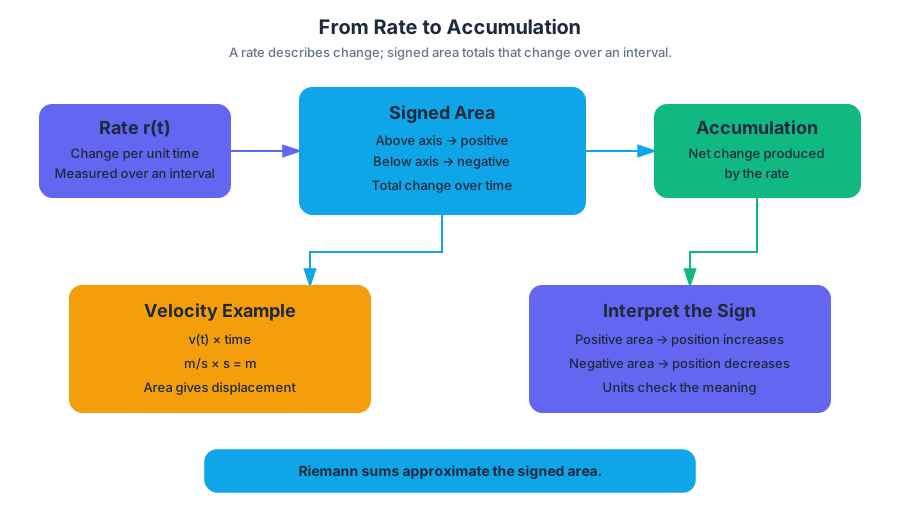
Accumulation is the total change produced by a rate over an interval. If $r(t)$ measures a rate of change and $t$ measures time, then the accumulated change is represented geometrically by the signed area between the graph of $r$ and the $t$-axis.
CHA-4.A: Interpret the meaning of an accumulation of change in a given context.
The sign matters. A rate above the axis is positive and produces positive accumulation; a rate below the axis is negative and produces negative accumulation.
For example, if $v(t)$ is velocity in meters per second and $t$ is measured in seconds, then the area under the velocity-versus-time graph has units
$$ \left(\frac{\text{meters}}{\text{second}}\right)(\text{seconds})=\text{meters}. $$
That area represents the particle’s change in position, or displacement. A positive area means the particle’s position increases; a negative area means its position decreases. The units are not an afterthought: multiplying the rate units by the independent-variable units is a powerful check on whether the interpretation is correct.
Net change versus total change
When a rate changes sign, two different quantities can be asked for:
- Net change combines positive and negative accumulation with their signs.
- Total change measures the entire amount transferred or traveled, so all pieces are counted positively.
Suppose a storage tank’s rate of change, $R(t)$, is measured in liters per second, with time in seconds. The following values describe a piecewise-constant approximation based on the rate at the left endpoint of each interval.
| Time interval (seconds) | Approximate rate (liters per second) | Signed accumulation (liters) |
|---|---|---|
| $0$ to $60$ | $4$ | $4(60)=240$ |
| $60$ to $90$ | $5$ | $5(30)=150$ |
| $90$ to $120$ | $3$ | $3(30)=90$ |
| $120$ to $135$ | $-1$ | $-1(15)=-15$ |
| $135$ to $150$ | $-2$ | $-2(15)=-30$ |
The net change is the signed sum:
$$ 240+150+90-15-30=435\text{ L}. $$
Thus, the tank gains approximately $435\text{ L}$ net over the $150$-second interval. The total amount transferred, however, counts both filling and draining:
$$ 240+150+90+15+30=525\text{ L}. $$
The tank does not gain $525\text{ L}$, because $45\text{ L}$ of that amount leaves the tank. The value $525\text{ L}$ describes total activity, while $435\text{ L}$ describes the final change in the tank’s contents.
Misconception check — “Area is always positive.”
Geometric area is often introduced as positive, but accumulation from a signed rate is not always positive. Regions below the axis contribute negative net change.
Skill focus and retrieval check
Topic 6.1 emphasizes Skill 4.B: Use appropriate units of measure. Topic 6.2 emphasizes Skill 1.F: Explain how an approximated value relates to the actual value. Together, these skills require more than a numerical calculation: identify what the area represents, attach correct units, preserve signs, and explain whether the approximation likely overestimates or underestimates the actual accumulation.
Retrieval check: A velocity graph has positive signed area $18\text{ m}$ from $t=0$ to $t=4$ and negative signed area $-7\text{ m}$ from $t=4$ to $t=6$. What are the particle’s net change in position and total distance traveled over the full interval?
Answer: The net change is
$$ 18-7=11\text{ m}, $$
while the total distance traveled is
$$ 18+7=25\text{ m}. $$
Source Materials
- Learn More (.pdf)
- AP Calculus AB and BC Course and Exam Description
- AP Calculus AB Course Overview
- AP Calculus Course at a Glance
- AP Calculus AB and BC Course at a Glance Poster
- Adopt AP Calculus AB
- AP Calculus AB
- AP Calculus AB
- AP Calculus AB-AP Students
- AP/College Calculus AB
- What's the Difference Between AP Calculus AB vs. BC-Princeton Review
- Free AP Calculus Lesson Plans-Math Medic