From the free course AP Calculus AB on Lykke
1.3 Estimating Limit Values from Graphs
Key concepts: Estimating limit values from graphs · Limit notation · The behavior of a function f as x approaches a particular x-value · Connecting graphical, numerical, analytical, and verbal representations · Identifying mathematical information from representations · Reading function values such as f(6) and f(-6) from a graph · Precise mathematical communication and notational fluency
How to read a limit off a graph by tracing the curve toward the target input from both sides, and why the filled dot at that input does not decide the limit.
1.3 Estimating Limit Values from Graphs
A limit can be estimated without knowing the exact value of a function at the target input: it describes the height that $f(x)$ approaches as $x$ gets close to that input. Graphs show this approach visually; tables show it numerically.
Reading a limit from a graph
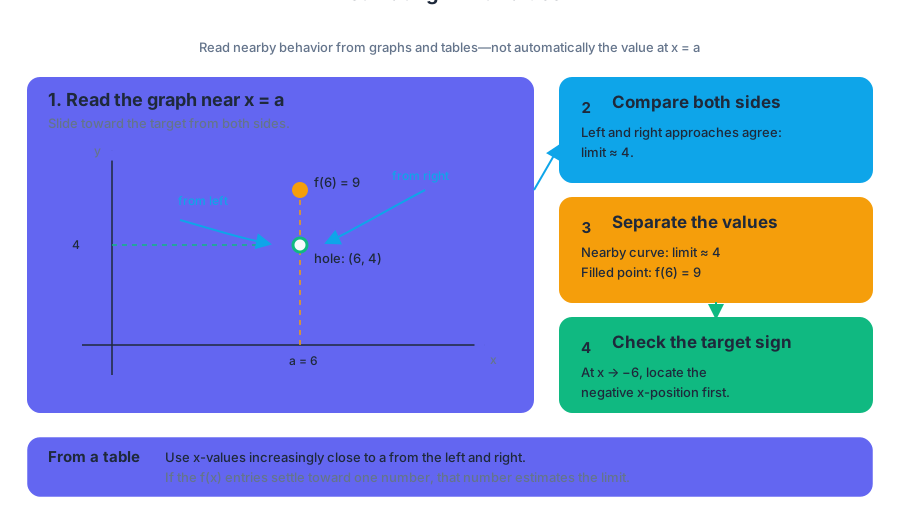
To estimate $\displaystyle \lim_{x\to a}f(x)$, focus on the behavior of the curve near $x=a$, not automatically on the point plotted at $x=a$. Imagine sliding along the curve from the left and from the right. If both sides approach the same $y$-value, that common value is the estimated limit.
For example, suppose a graph has a hole in the curve at $(6,4)$, while a filled point appears at $(6,9)$. The nearby curve approaches $4$ from both sides. Therefore,
$$ \lim_{x\to 6}f(x)\approx 4, $$
even though
$$ f(6)=9. $$
The limit records nearby behavior; the function value records the actual defined output at the target input.
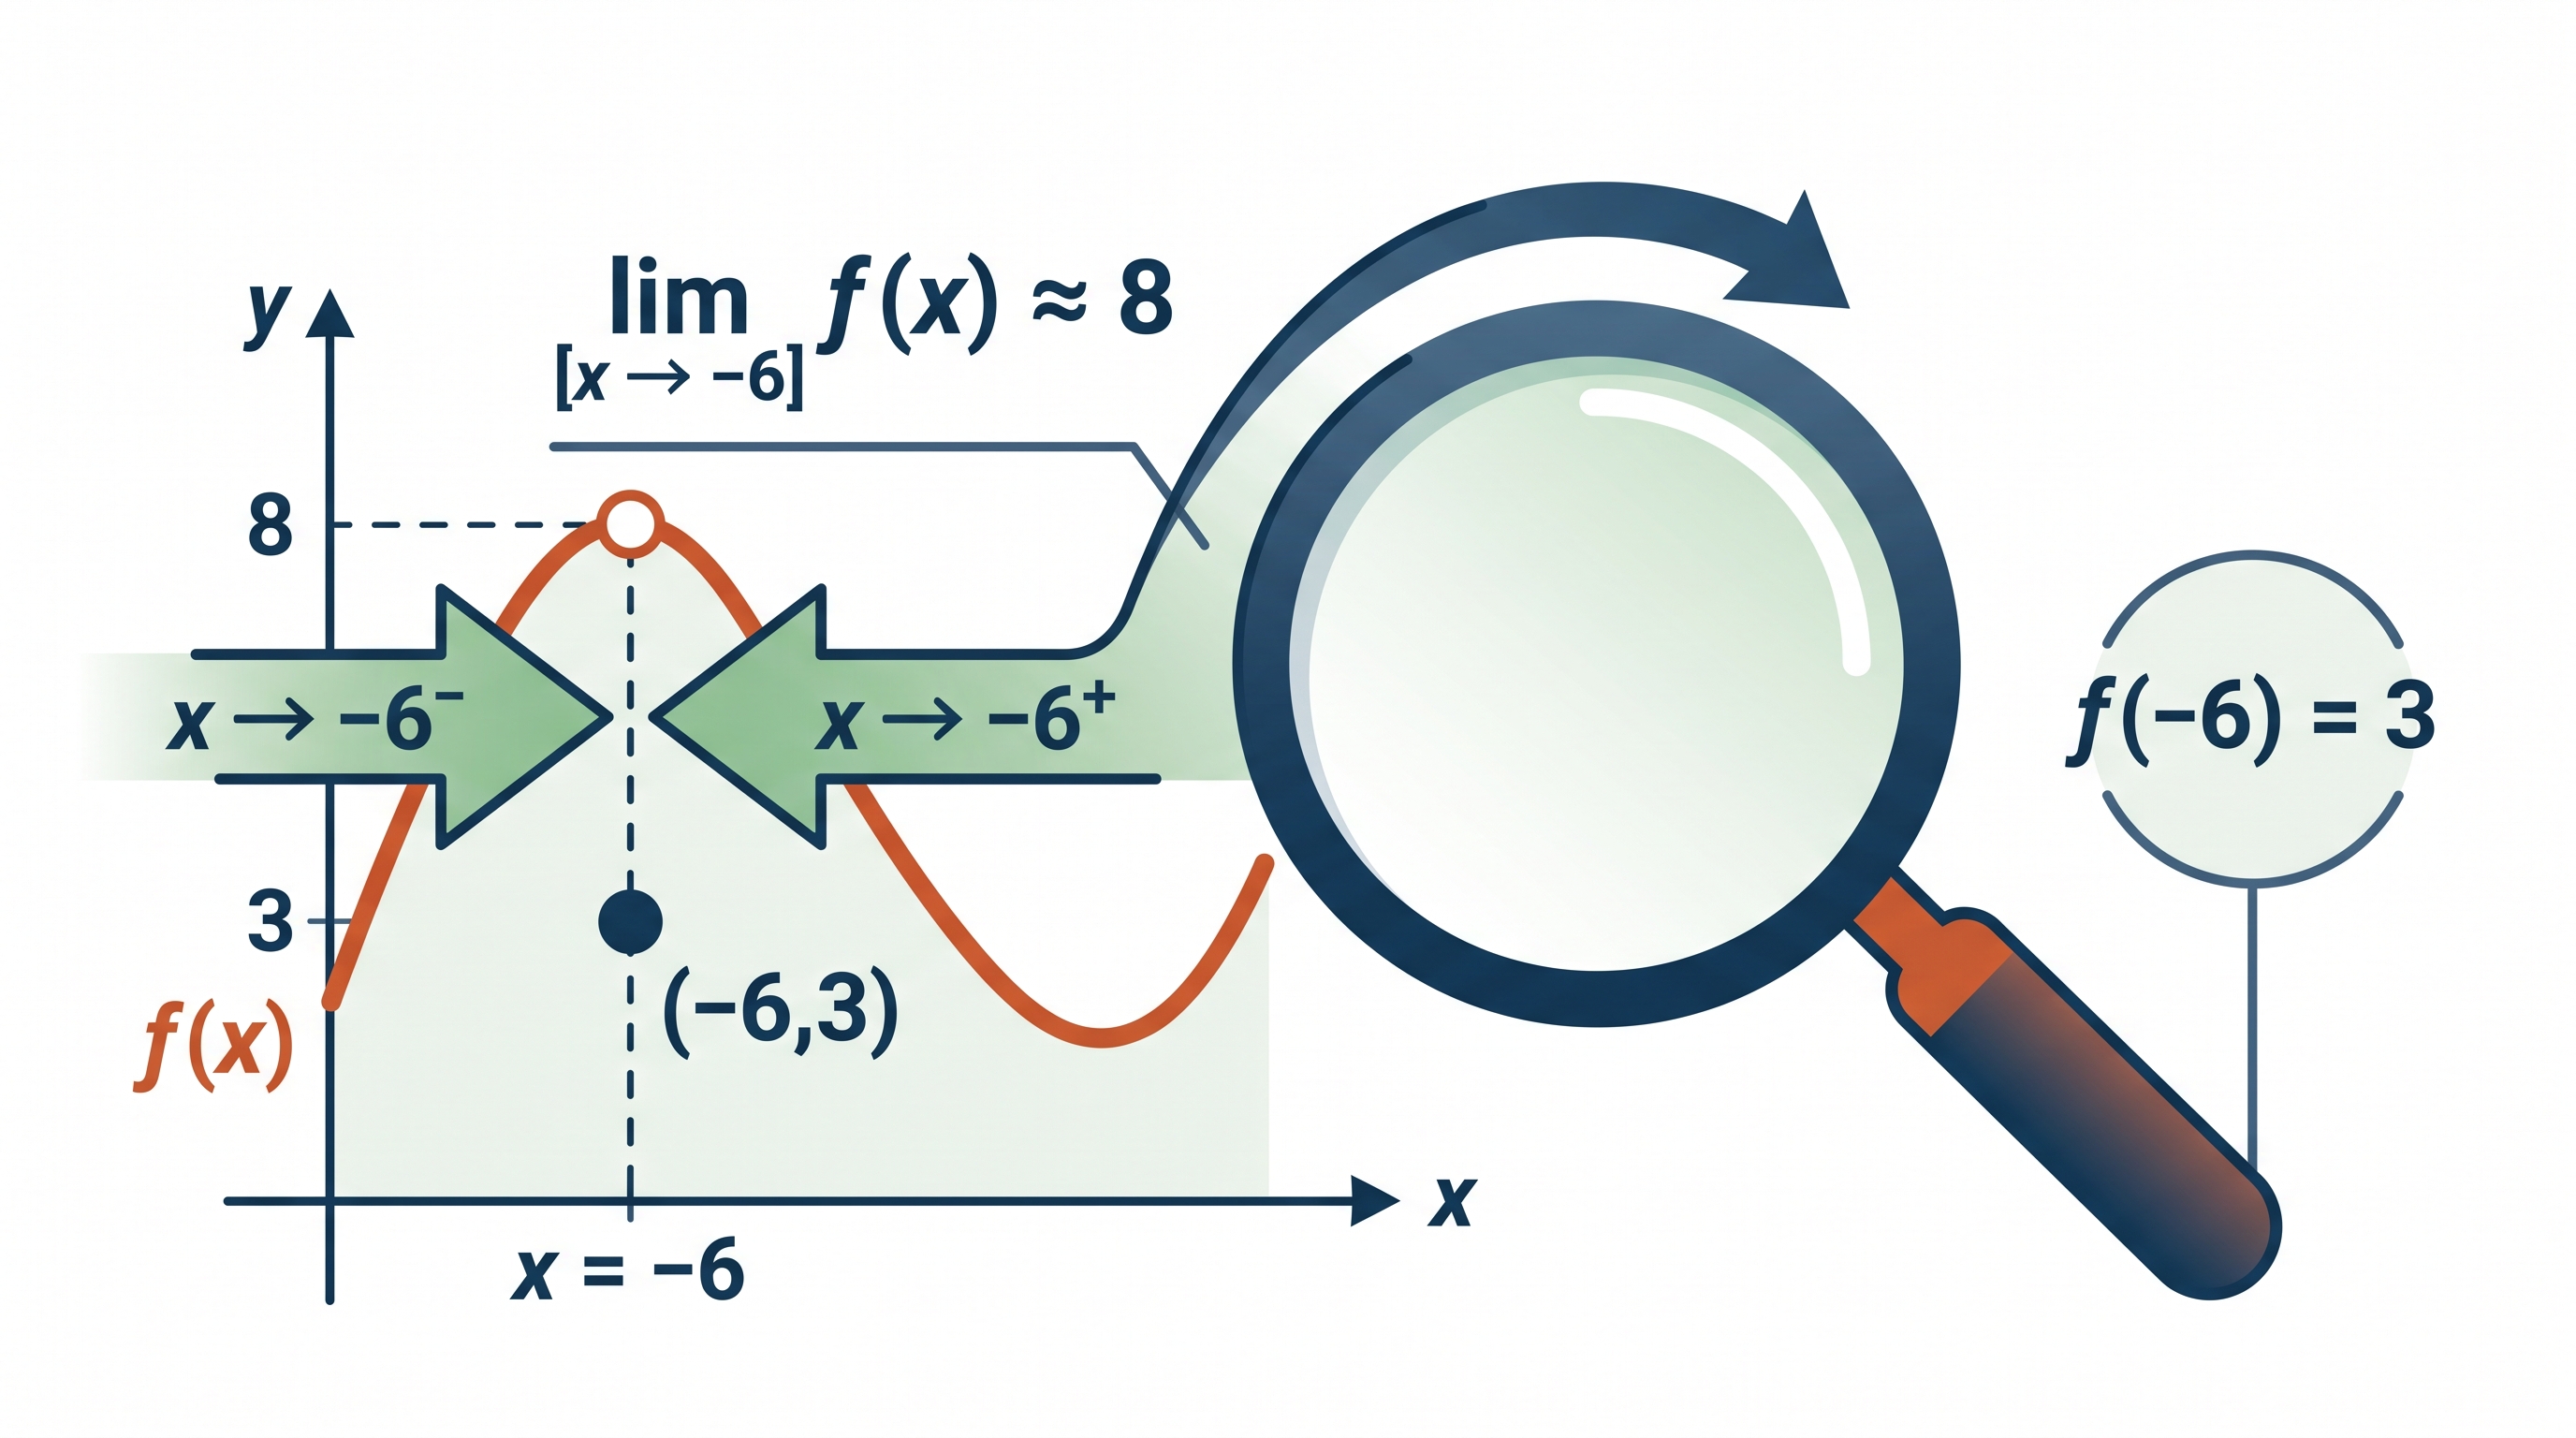
A negative target input must be read just as carefully. Suppose the graph contains a filled point at $(-6,3)$, but the curve on either side of $x=-6$ approaches $7$. Then
$$ f(-6)=3 $$
but
$$ \lim_{x\to -6}f(x)\approx 7. $$
The minus sign in $x\to -6$ identifies the horizontal location being approached. It is not part of the resulting $y$-value.
Graph-reading procedure
- Locate the target input $x=a$, including its sign.
- Trace the curve toward $x=a$ from the left.
- Trace the curve toward $x=a$ from the right.
- Compare the two nearby heights.
- Report the common height, if one exists, using $\displaystyle \lim_{x\to a}f(x)$ notation.
When a graph gives no two-sided limit
The two-sided limit does not exist when the left-hand and right-hand approaches do not agree. A graph may also fail to produce a finite limit if the function grows without bound near the target or oscillates indefinitely.
Named misconception — “The limit is the filled dot.” A filled dot tells you $f(a)$, but it may have no connection to the limit if the surrounding curve approaches a different height. Conversely, an open circle does not mean the limit is nonexistent; the curve may approach the hole from both sides perfectly consistently.
Connecting representations
The same limit may be represented graphically, numerically, analytically, or verbally:
| Representation | Information |
|---|---|
| Graphical | Both branches approach the height $4$ near $x=2$. |
| Numerical | Table values approach $4$ from the left and right. |
| Analytical | $\displaystyle \lim_{x\to 2}f(x)\approx4$. |
| Verbal | “As $x$ gets close to $2$, $f(x)$ gets close to $4$.” |
This cross-checking is Connecting Representations, Skill 2.B: Identify mathematical information from graphical, numerical, analytical, and/or verbal representations. A calculator can zoom, generate tables, or evaluate nearby inputs, but the reasoning remains the same: identify the target input, inspect both directions, and determine whether the outputs approach one common value.
Limit or function value?
Retrieval check: A graph has a filled point at $(-6,3)$, while the curve approaches $8$ from both sides of $x=-6$. State both quantities.
The answer is
$$ f(-6)=3 \qquad\text{and}\qquad \lim_{x\to -6}f(x)\approx8. $$
Source Materials
- Learn More (.pdf)
- AP Calculus AB and BC Course and Exam Description
- AP Calculus AB Course Overview
- AP Calculus Course at a Glance
- AP Calculus AB and BC Course at a Glance Poster
- Adopt AP Calculus AB
- AP Calculus AB
- AP Calculus AB
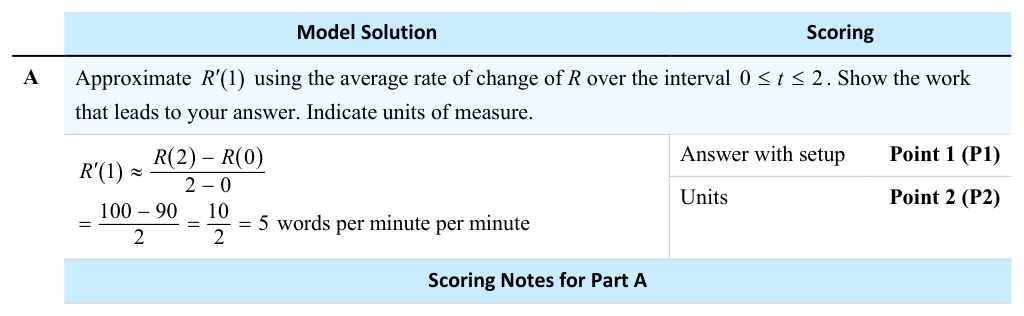
- • To earn P1, a response must present the answer along with the supporting work of a difference and a quotient using values from the table.
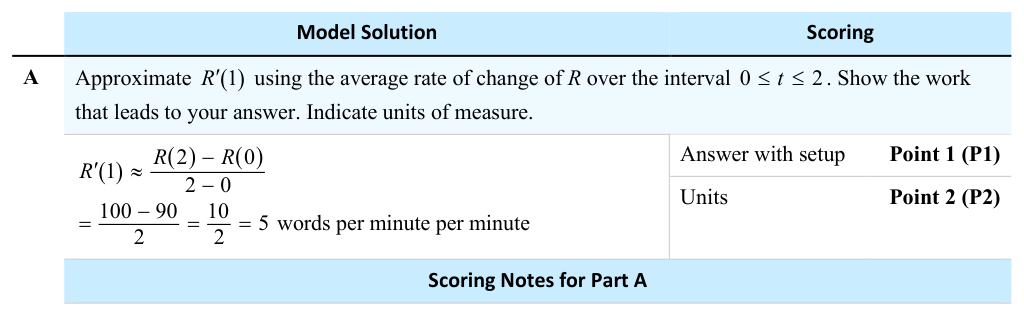
- • To earn P1, a response must present the answer along with the supporting work of a difference and a quotient using values from the table.