From the free course AP Calculus AB on Lykke
5.4 Using the First Derivative Test to Determine Relative (Local) Extrema
Key concepts: Critical points and their role in locating relative (local) extrema · The First Derivative Test for relative (local) maxima and minima · Determining extrema from a graph or sign chart of the derivative · Justifying conclusions about increasing/decreasing behavior and extrema · Interpreting the graph of f′ to determine the behavior of f · The relationship between continuity, critical points, and relative extrema · Using appropriate mathematical representations and explanations
How the First Derivative Test uses a sign change in the first derivative at a critical number to identify relative maxima and minima.
5.4 Using the First Derivative Test to Determine Relative (Local) Extrema
Topic 5.3 used the sign of $f'$ to find where a function rises and where it falls. A relative extremum is a place where that direction reverses, so the same sign chart can also locate local maxima and minima. This page turns that observation into the First Derivative Test.
The First Derivative Test
A relative, or local, extremum occurs when the function changes direction near a point. The First Derivative Test detects that direction change by comparing the signs of $f'$ on the two sides of a critical number.
First Derivative Test
- If $f'$ changes from positive to negative at $x=c$, then $f$ changes from increasing to decreasing and has a relative maximum at $x=c$.
- If $f'$ changes from negative to positive at $x=c$, then $f$ changes from decreasing to increasing and has a relative minimum at $x=c$.
- If $f'$ does not change sign at $x=c$, the test does not identify a relative extremum there.
For example, suppose a derivative sign chart is
$$ \begin{array}{c|ccc} x & (-\infty,2) & 2 & (2,\infty)\ \hline f'(x) & + & 0 & - \end{array} $$
The function increases before $x=2$ and decreases afterward. Thus $f$ has a relative maximum at $x=2$.
By contrast,
$$ \begin{array}{c|ccc} x & (-\infty,6) & 6 & (6,\infty)\ \hline f'(x) & + & 0 & + \end{array} $$
shows that $f$ increases on both sides of $x=6$. The derivative is zero at $x=6$, but there is no relative extremum because the function never changes direction.
Worked contextual example
Suppose $P(t)$ represents the population of a microorganism colony, and its derivative satisfies
$$P'(t)=(t-2)(t-5), \qquad 0\le t\le 7.$$
The critical numbers in the domain are $t=2$ and $t=5$. Test one value in each resulting interval:
| Time interval | Test value | Sign of $P'(t)$ | Population behavior |
|---|---|---|---|
| $(0,2)$ | $t=1$ | $(1-2)(1-5)>0$ | Increasing |
| $(2,5)$ | $t=3$ | $(3-2)(3-5)<0$ | Decreasing |
| $(5,7)$ | $t=6$ | $(6-2)(6-5)>0$ | Increasing |
Therefore, $P$ increases on $(0,2)$, decreases on $(2,5)$, and increases on $(5,7)$. At $t=2$, the sign changes from positive to negative, so the colony has a relative maximum. At $t=5$, the sign changes from negative to positive, so the colony has a relative minimum.
Misconception check: $f'(c)=0$ is not enough
A common error is to state, “$f'(c)=0$, so $f$ has a maximum or minimum at $c$.” Zero derivative only identifies a point that requires investigation. The decisive evidence is the sign change: positive-to-negative gives a local maximum, negative-to-positive gives a local minimum, and no sign change gives neither by the First Derivative Test.
These conclusions demonstrate FUN-4.A: Justify conclusions about the behavior of a function based on the behavior of its derivatives, using FUN-4.A.2: The first derivative of a function can determine the location of relative (local) extrema of the function. They also rely on FUN 2: Connecting Representations, when a formula, graph, or sign chart for $f'$ is translated into behavior of $f$, and FUN 3: Justification, when the sign information is stated as a reason rather than merely an answer.
Retrieval check: If $f'(x)<0$ on $(1,4)$ and $f'(x)>0$ on $(4,7)$, what occurs at $x=4$? Explain using both the behavior of $f$ and the sign change in $f'$.
Source Materials
- Learn More (.pdf)
- AP Calculus AB and BC Course and Exam Description
- AP Calculus AB Course Overview
- AP Calculus Course at a Glance
- AP Calculus AB and BC Course at a Glance Poster
- Adopt AP Calculus AB
- AP Calculus AB
- AP Calculus AB
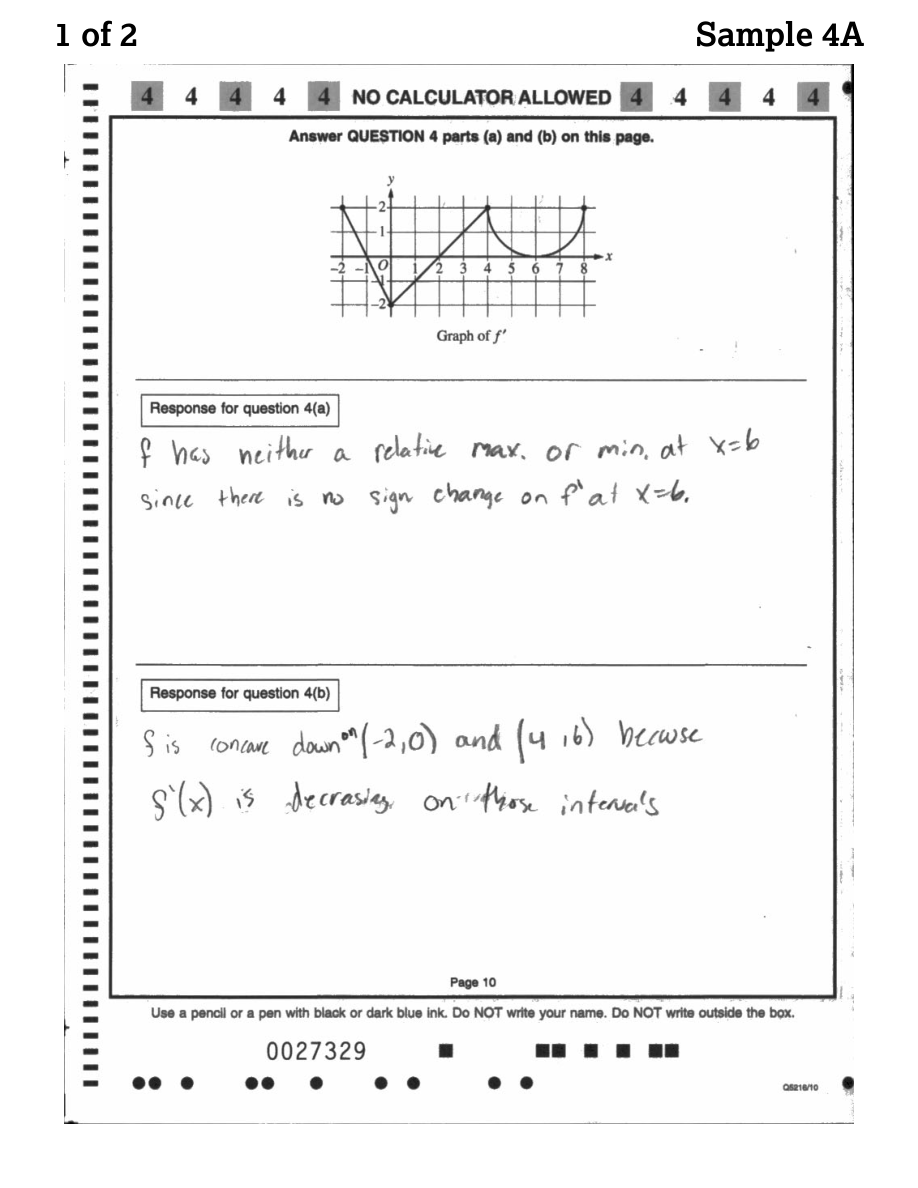
- Figure — Sample Responses Q4 (p. 5)
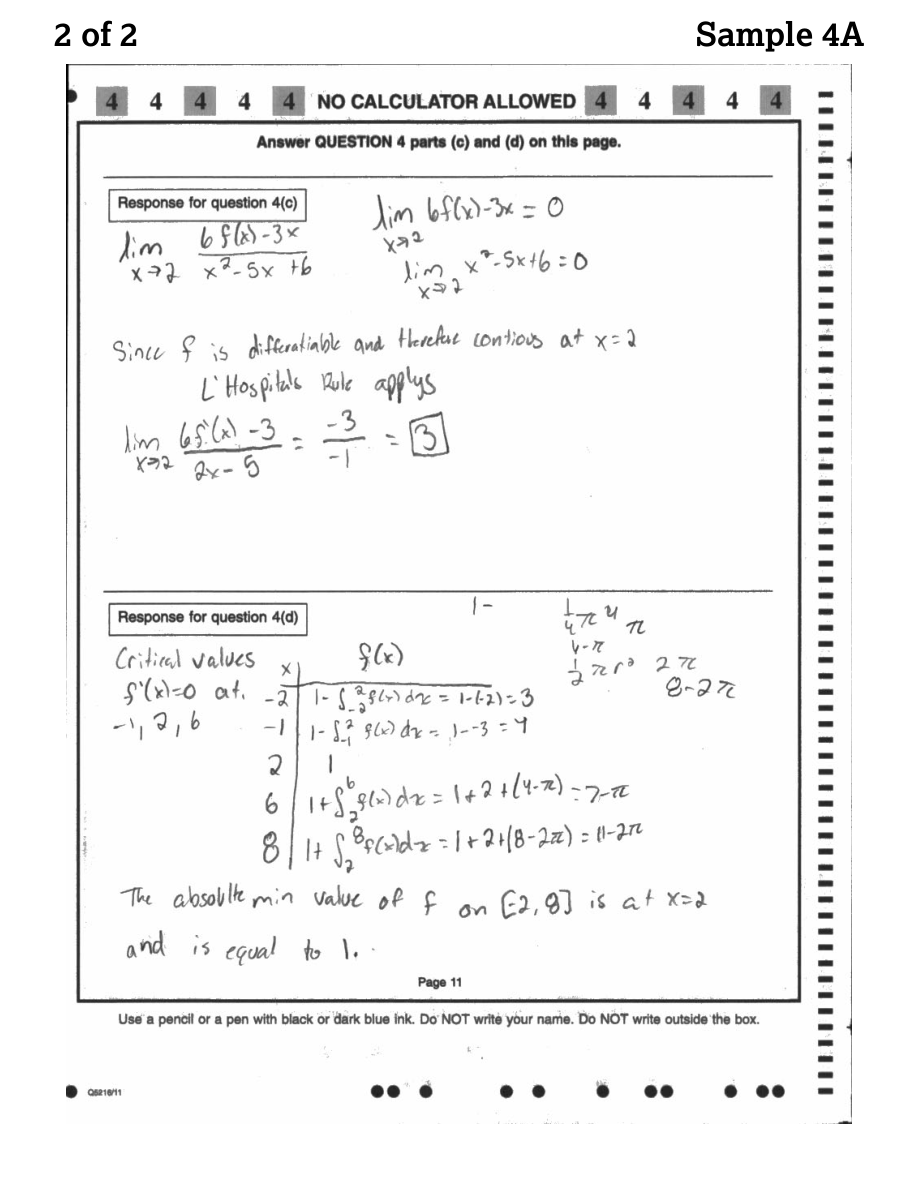
- Figure — Sample Responses Q4 (p. 6)
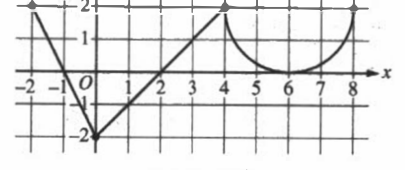
- Gra.ph of j'
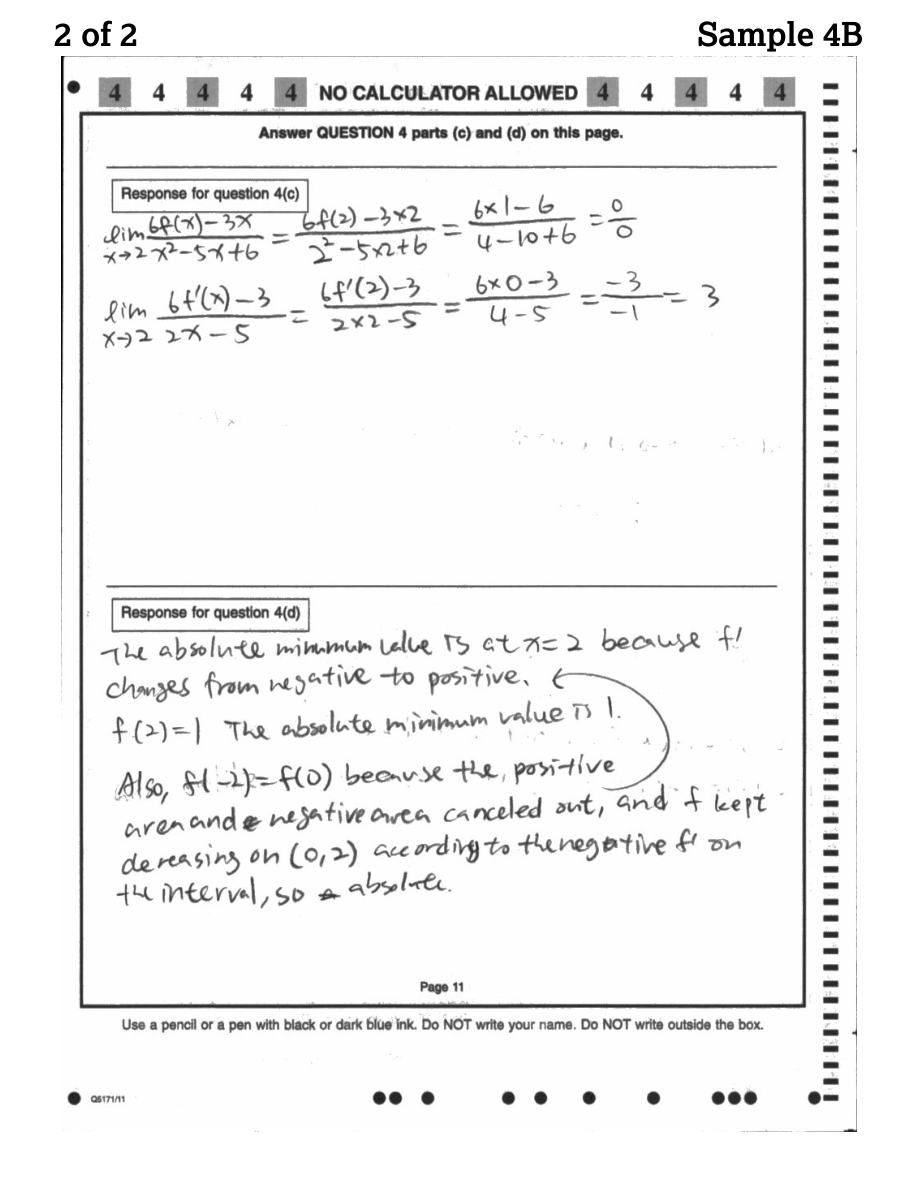
- Figure — Sample Responses Q4 (p. 8)