AP Human Geography
Institution: MIT
111 study materials · 72 sections
AP Human Geography students working the current College Board Course and Exam Description, including first-time students with no prior background, plus teachers reviewing the page for CED alignment.; Teach every official CED unit and every numbered topic at topic granularity.; Develop every AP skill / science-practice code explicitly and by name.; Replace description with teaching: worked contextual examples, named misconceptions, and in-flow retrieval checks.; Build an exam-practice unit covering every task type on the current exam.
Course Sections
Course Framework, Skills and Reasoning Processes
Key concepts: AP Human Geography course framework · Industrial and Economic Development Patterns and Processes · Spatial relationships · Spatial processes and societal change · Scale analysis · Source analysis · Impacts and interactions · Progress Checks · AP Question Bank · Instructional model
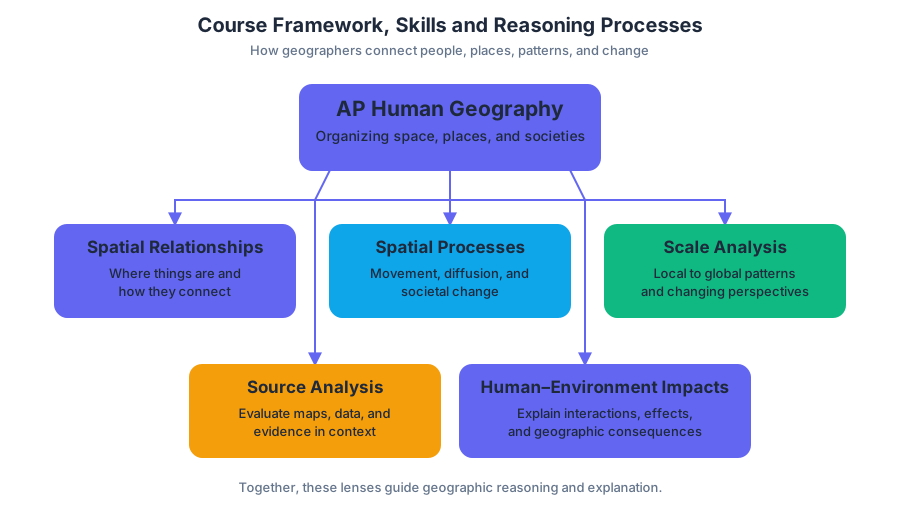
AP Human Geography studies how people organize space, change places, and produce geographic patterns through spatial relationships, spatial processes and societal change, scale analysis, source analysis, and the effects of human-environment impacts and interactions.
Course Framework, Skills and Reasoning Processes
AP Human Geography studies how people organize space, change places, and produce geographic patterns through spatial relationships, spatial processes and societal change, scale analysis, source analysis, and the effects of human-environment impacts and interactions.
The architecture: content, skills, and Big Ideas
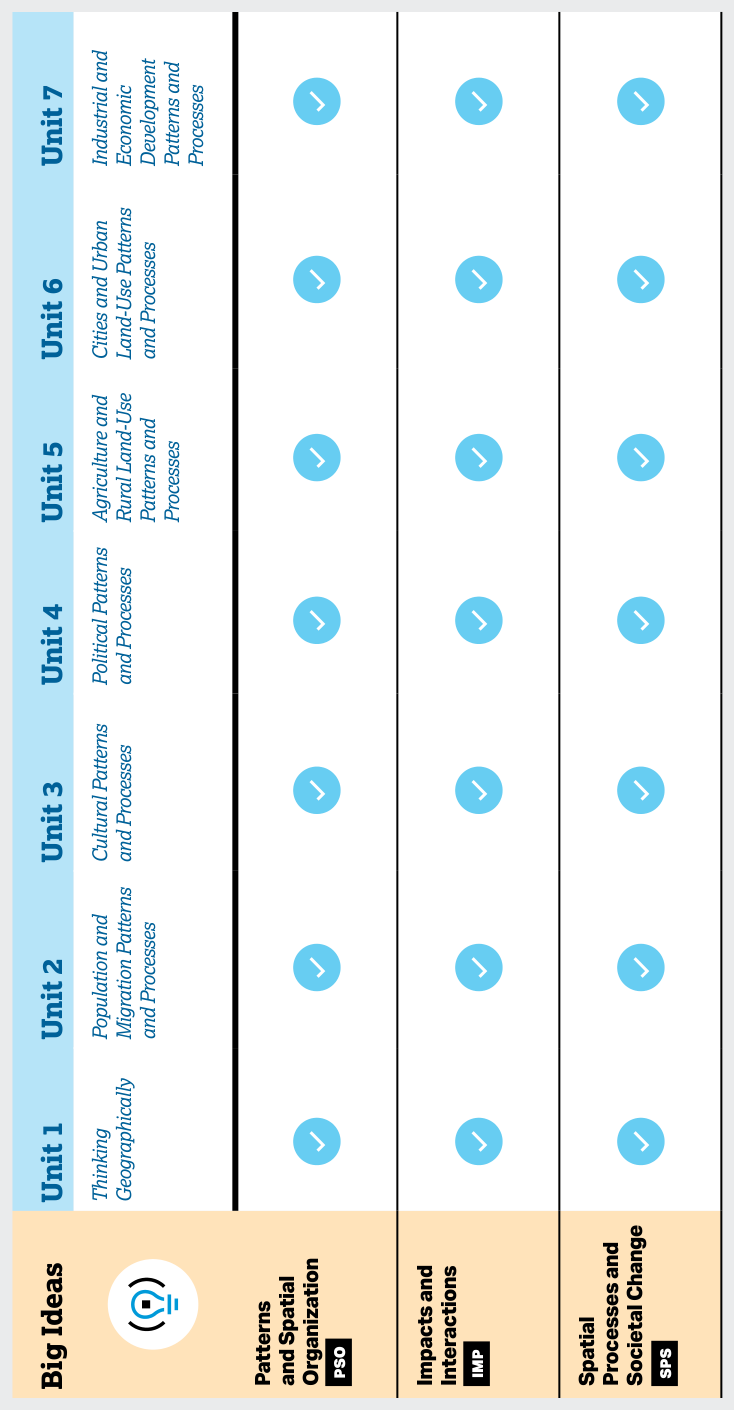
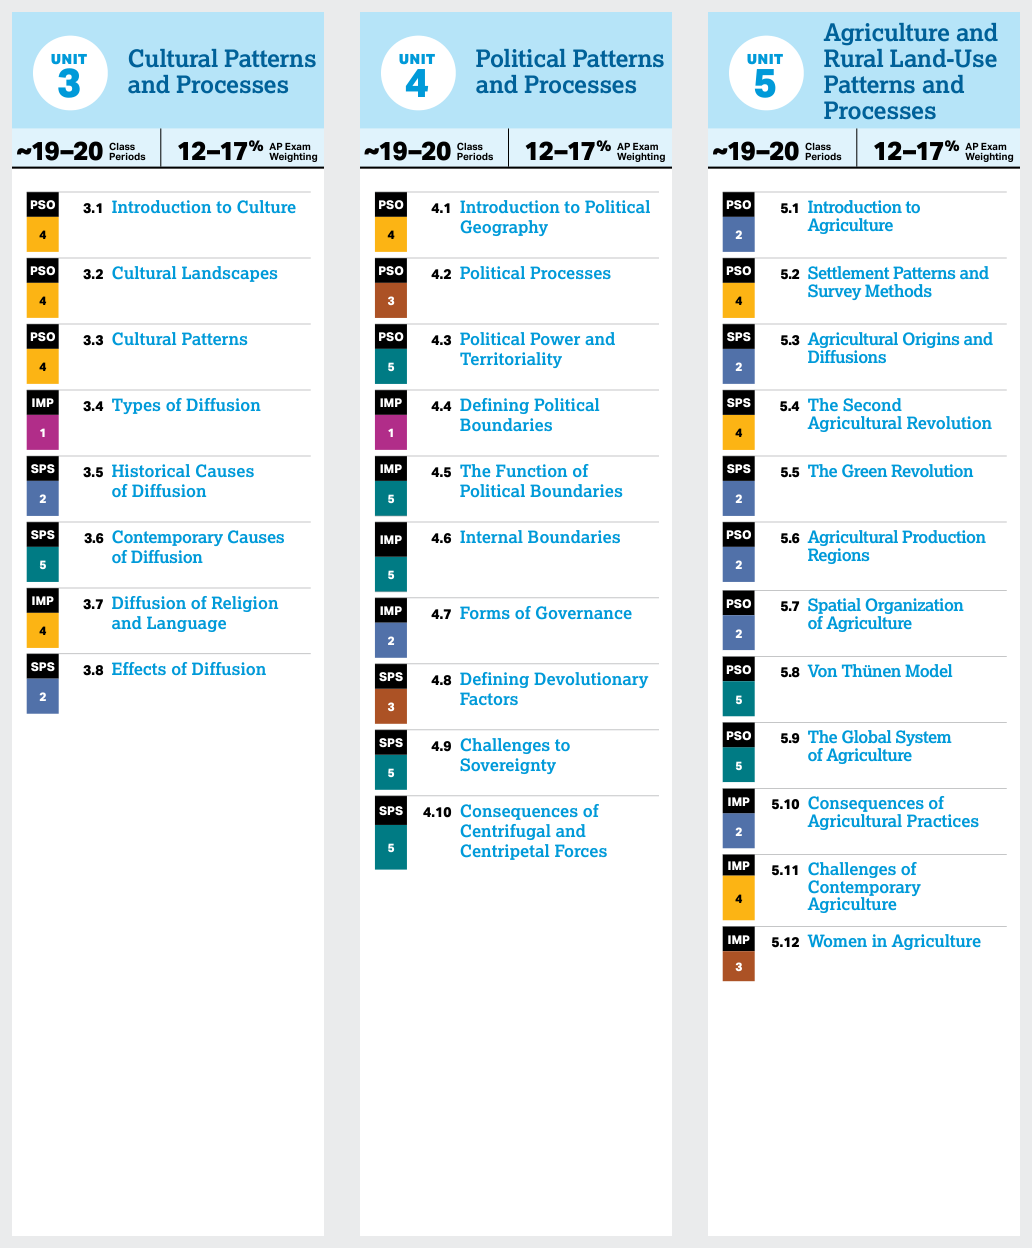
The Course Framework is the organizing structure for AP Human Geography. It divides the course into seven units, but the units are not isolated containers of vocabulary. Each topic combines geographic content with recurring skills and three Big Ideas:
| Big Idea | Meaning | Guiding question |
|---|---|---|
| Patterns and Spatial Organization [PSO] | Where things are located, how they are arranged, and why that arrangement matters | Why does economic and social development happen at different times and rates in different places? |
| Impacts and Interactions [IMP] | How people, places, environments, and economies affect one another | How might environmental problems stemming from industrialization be remedied through sustainable development strategies? |
| Spatial Processes and Societal Change [SPS] | How movement, technology, institutions, and human decisions transform places over time | How do processes operating across space produce societal change? |
A useful way to read any topic is to ask three questions in sequence: What pattern do I see? What process produced it? At what scale does the explanation change? For example, unequal development may appear as a global pattern, result from trade and industrialization processes, and look different when examined at the national, regional, or local scale.
Five geographic skill categories
The framework treats geography as an evidence-based discipline rather than a list of locations to memorize. Its five skill categories spiral through all seven units:
- Concepts and Processes: Use geographic concepts, models, and processes to explain why patterns occur. Topic materials connect this category to identifiers such as 1.D, 1.E, and 1.F.
- Spatial Relationships: Describe and explain how locations, distances, networks, and distributions relate to one another. 2.B is an example of this category.
- Data Analysis: Interpret quantitative information, identify trends, and recognize limitations in data. The framework explicitly connects this work to 3.F, which addresses limitations or problems in data.
- Source Analysis: Extract geographic information from maps, images, charts, graphs, and written sources, then compare patterns or trends. Examples include 4.A, 4.D, and 4.F.
- Scale Analysis: Explain how changing the geographic scale can reveal different relationships or conclusions. Examples include 5.B and 5.D.
A single task can require several categories at once. Suppose a map shows industrial employment concentrated near a major port. Source Analysis identifies the pattern, Spatial Relationships connects the port to transportation access, Concepts and Processes explains industrial location, and Scale Analysis asks whether the pattern remains true for the city, region, or country.
Key distinction: A geographic pattern is the observable arrangement of something in space; a geographic process is the mechanism that creates, maintains, or changes that arrangement.
Unit 7 as an integrated example
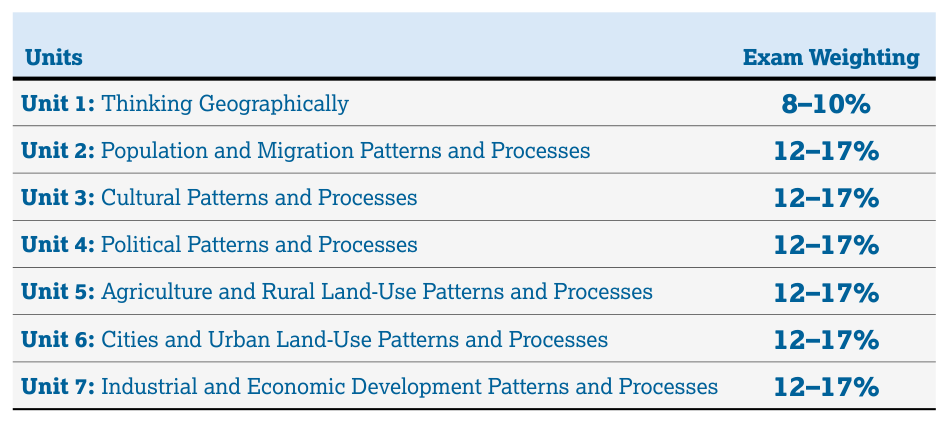
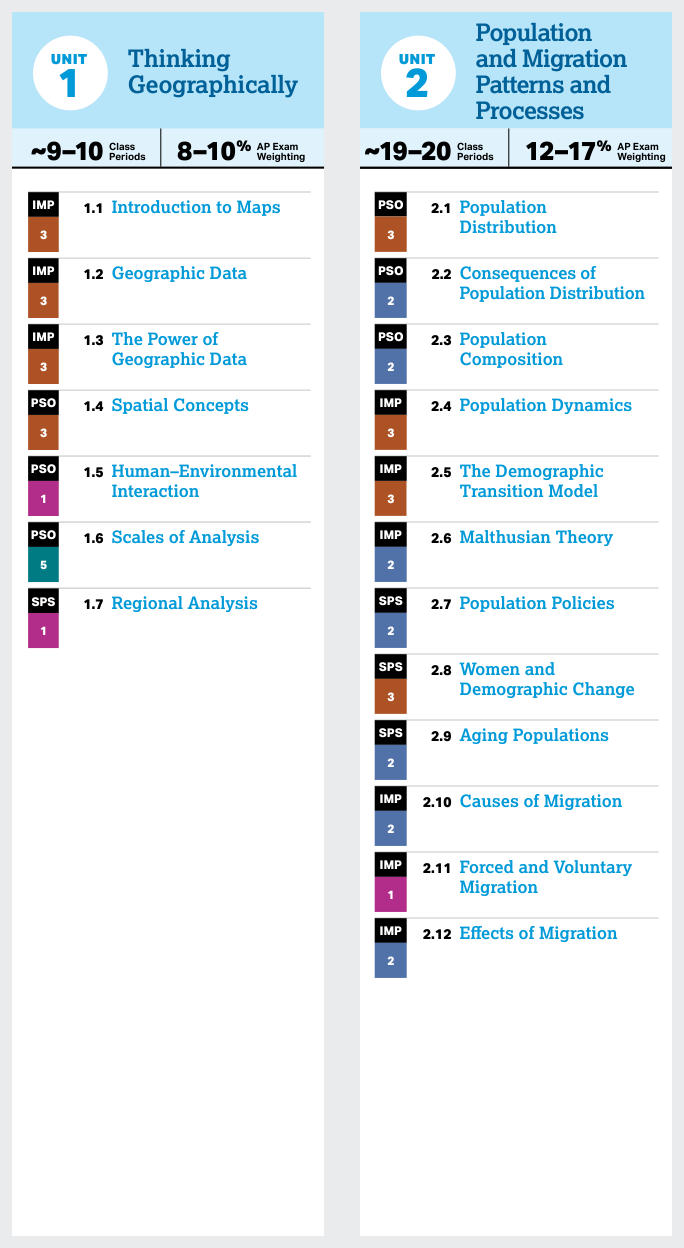
Unit 7: Industrial and Economic Development Patterns and Processes illustrates how the framework works. It carries a published AP Exam weighting of 12–17% and suggests approximately 19–20 class periods. Its sequence moves from the Industrial Revolution through economic sectors, industrialization, women and economic development, development theories, trade, changes produced by the world economy, and sustainable development.
The eight topics are connected by the Big Ideas rather than taught as unrelated entries. SPS-7 emphasizes changes produced by industrialization and economic systems; PSO-7 emphasizes the spatial organization of development and production; and IMP-7 emphasizes consequences, including environmental problems and possible sustainable responses. A visual source about factory locations, for instance, may assess Source Analysis through 4.D and 4.F, while also requiring Spatial Relationships through 2.B and Scale Analysis through 5.B.
Progress Checks: the framework’s feedback loop
Progress Checks are AP Classroom assessments assigned as part of the instructional sequence after a unit. They use AP-style multiple-choice and free-response work, often involving maps, charts, graphs, or written sources, to check both unit content and the geographic skills used to apply it.
Their purpose is diagnostic, not merely numerical. A teacher can examine results to determine whether students misunderstood a development theory, misread a spatial pattern, failed to support an explanation with evidence, or applied the wrong scale. Students can then revisit the specific concept or skill instead of simply repeating the entire unit.
Example feedback loop: Progress Check result → identify the missed content or skill → reteach with a map, dataset, or case study → attempt a new application → verify improvement.
Instructional sequence and professional responsibility
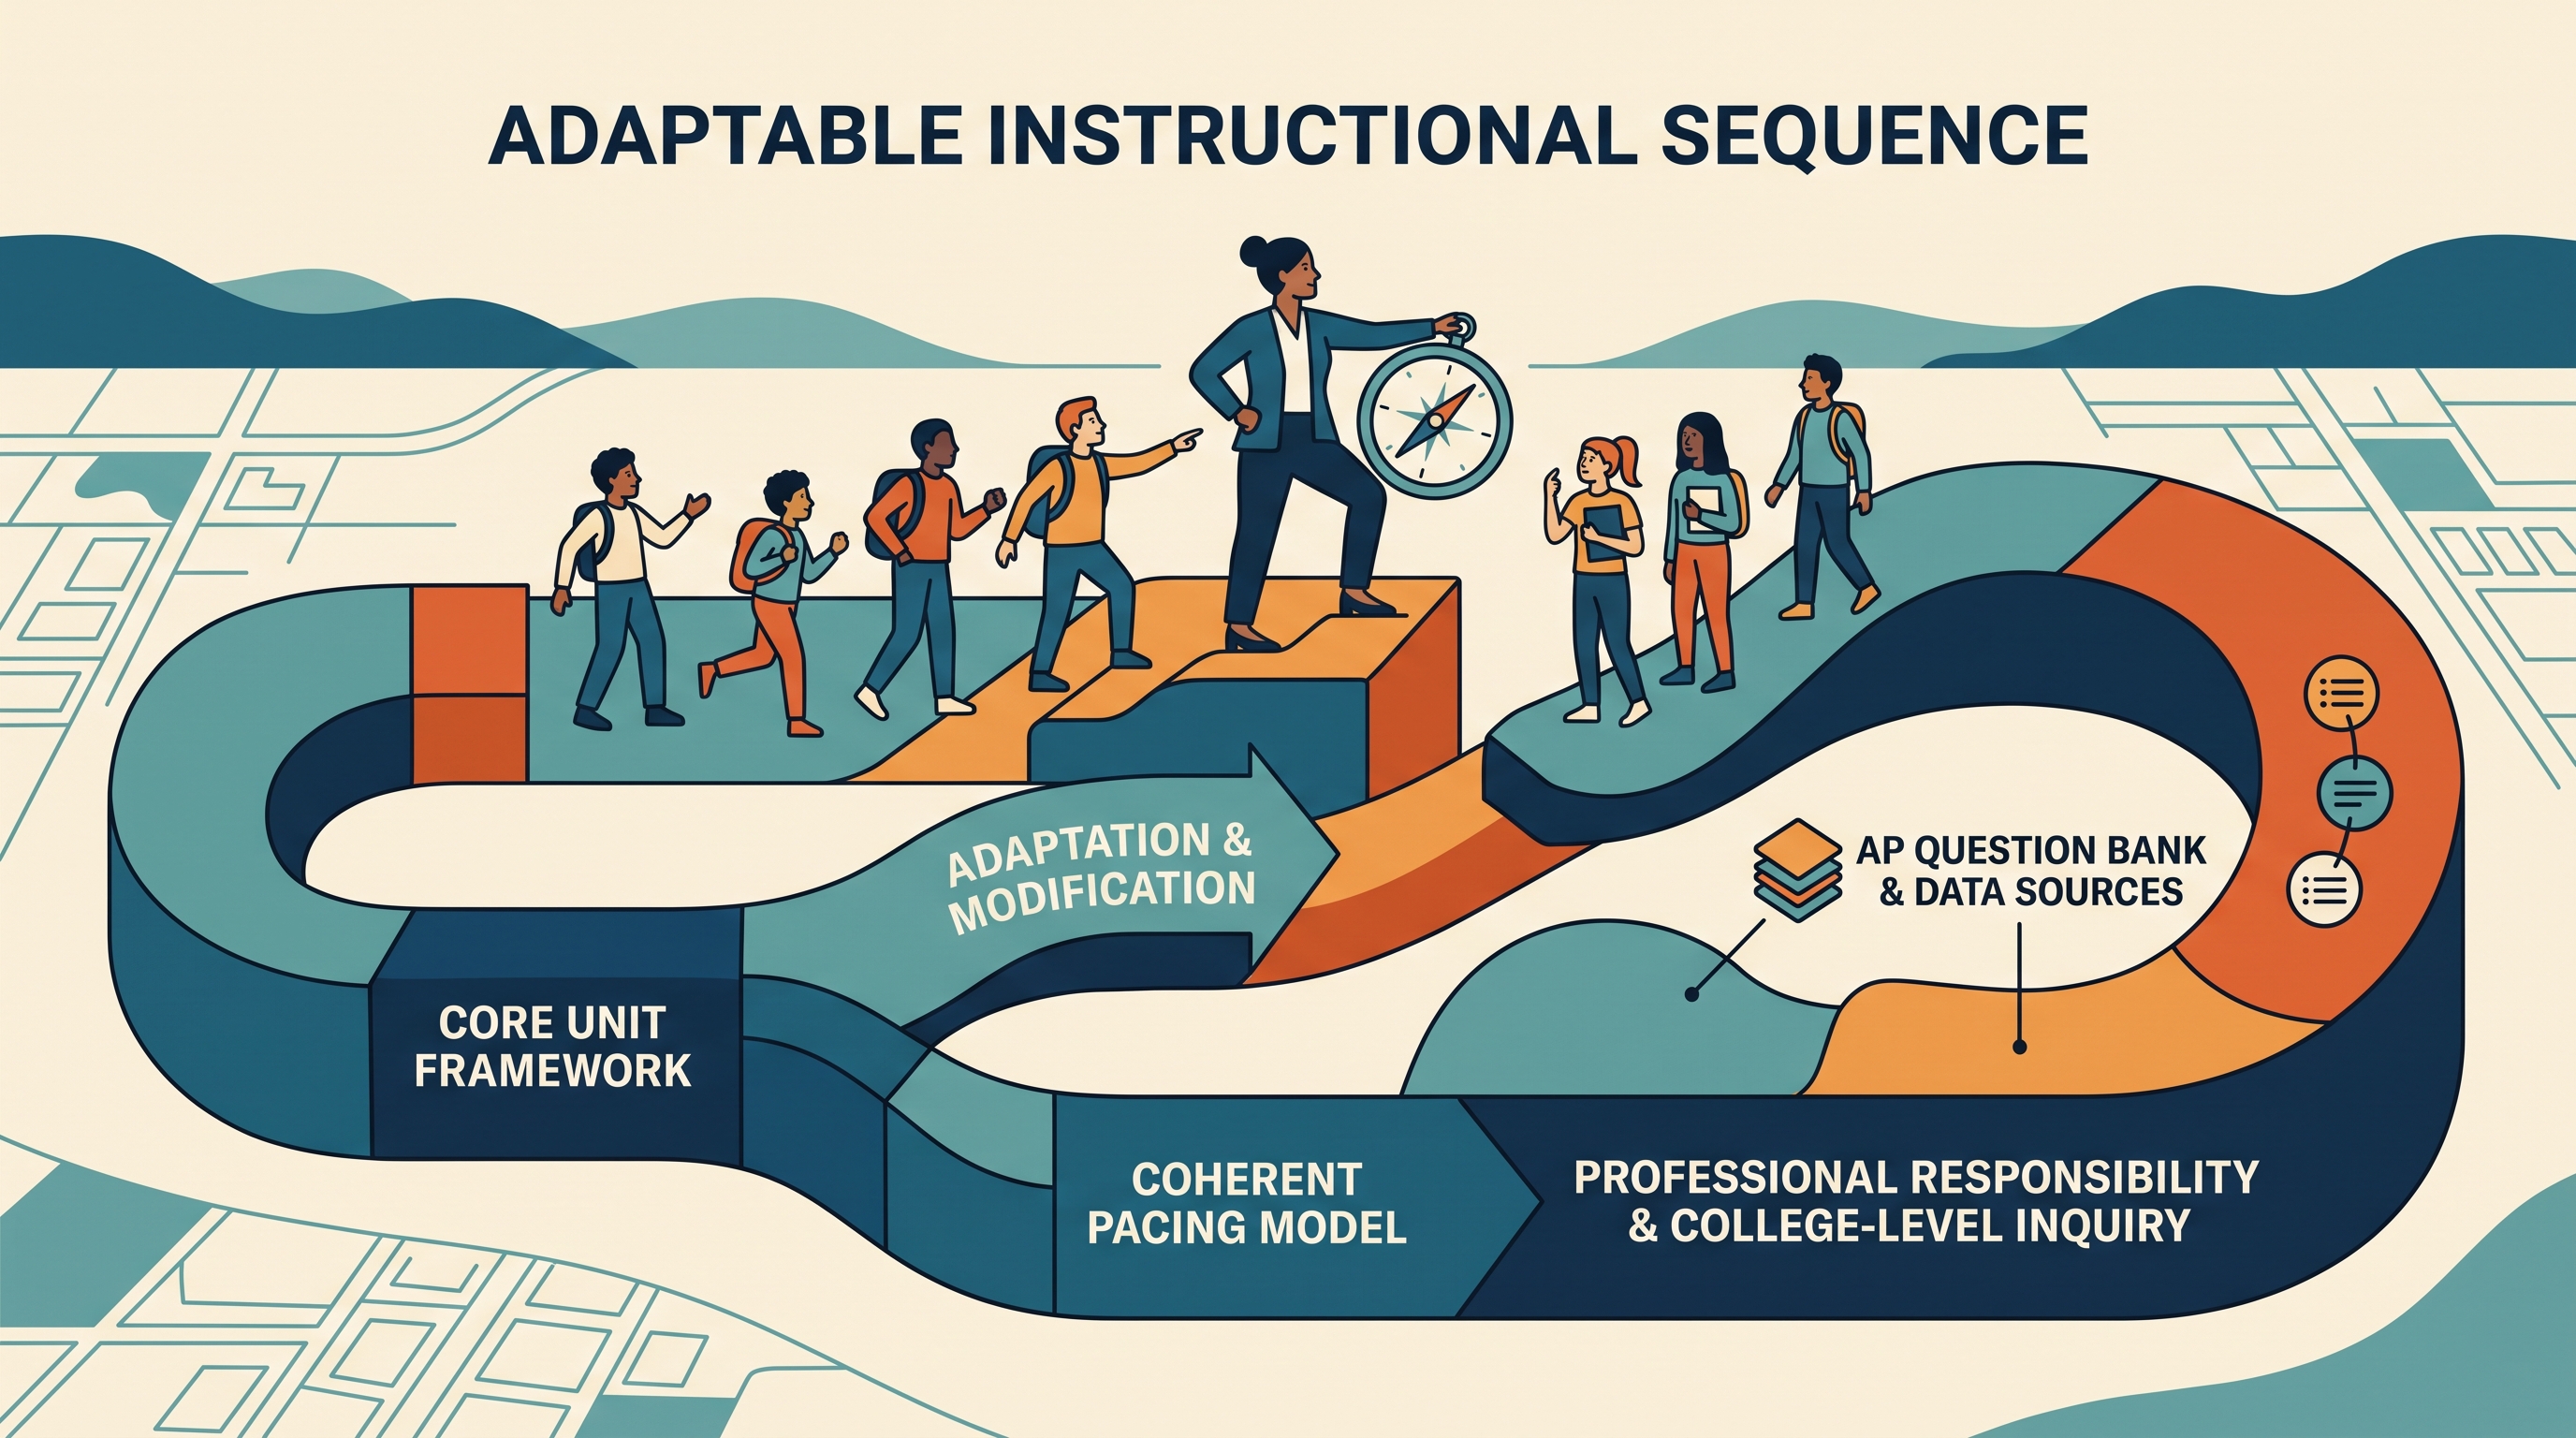
The unit structure was developed with extensive input from the AP Human Geography community. It gives new teachers a coherent sequence and pacing model they can adopt, while allowing experienced teachers to modify the order when their students, local context, or available resources make another sequence more effective.
That flexibility does not mean the framework’s expectations disappear. AP teachers should have confidence and clarity that families enrolling a student in an AP course have agreed to a classroom experience embodying stated AP principles: college-level inquiry, evidence-based reasoning, engagement with diverse cultures and perspectives, intellectual openness, and respectful discussion.
The AP Question Bank supports that work by providing real AP Exam questions indexed by course topics and skills for classroom use. Used alongside Progress Checks, maps, atlases, data sources, case studies, current events, and online mapping tools, it helps align daily instruction with the framework’s central demand: explain geographic patterns and processes with evidence, precision, and attention to scale.
1.1 Introduction to Maps
Key concepts: maps · spatial patterns · cow’s milk production · Africa · clustered or concentrated distributions · language as a cultural trait · comparing maps
A map turns “where?” into evidence. A list may tell you how much cow’s milk Africa produces, but only a map can reveal whether production is spread evenly, concentrated in a few regions, or clustered in neighboring countries.
1.1 Introduction to Maps
A map turns “where?” into evidence. A list may tell you how much cow’s milk Africa produces, but only a map can reveal whether production is spread evenly, concentrated in a few regions, or clustered in neighboring countries. In human geography, that spatial arrangement often matters as much as the total amount.
Learning Objective 1.A — Explain the geographical concepts of maps and spatial patterns.
Essential Knowledge 1.A.1 — Maps are representations of spatial information. A map is a visual representation of Earth’s surface, or part of it, designed to show the location, distribution, or relationship of geographic phenomena. The mapped phenomenon may be physical, such as elevation, or human, such as language, religion, population, or agricultural production.
A map does not merely show places; it shows a spatial relationship that can be interpreted.
Reading a spatial pattern
A spatial pattern is the way a geographic phenomenon is arranged across space. Three useful descriptions are:
- Clustered or concentrated: observations gather in particular areas rather than appearing randomly or evenly.
- Dispersed: observations are separated across space, with relatively large gaps between them.
- Uniform: observations are distributed at relatively regular intervals.
These descriptions are not interchangeable with production levels. A strong answer must identify where the values occur and, when relevant, what levels are found there. Saying that production is “clustered in certain areas” is incomplete because it does not identify the areas or explain whether those areas have low, medium, or high production.
Worked map comparison: cow’s milk and pork in Asia
Imagine two maps of Asia. Map 1 displays cow’s milk production; Map 2 displays pork production. To compare them, use the same geographic frame for both maps: identify where each product has high, medium, or low production, then state a clear similarity or difference.
A precise comparison would be: cow’s milk is produced at medium or high volumes across most Asian countries, whereas pork production is concentrated at high or medium volumes in East Asia and parts of Southeast Asia. Pork production is relatively low in South Asia and Southwest Asia. China is especially useful as a comparison point because it appears on both maps, allowing the two patterns to be evaluated in the same location.
The key reasoning is comparative rather than descriptive:
$$ \text{Map 1: broad distribution across Asia} \quad \neq \quad \text{Map 2: stronger East and Southeast Asian concentration} $$
A response that discusses only cow’s milk has not completed a comparison. A response that names both products but does not describe their locations has also missed the central geographic task.
Worked pattern description: cow’s milk in Africa
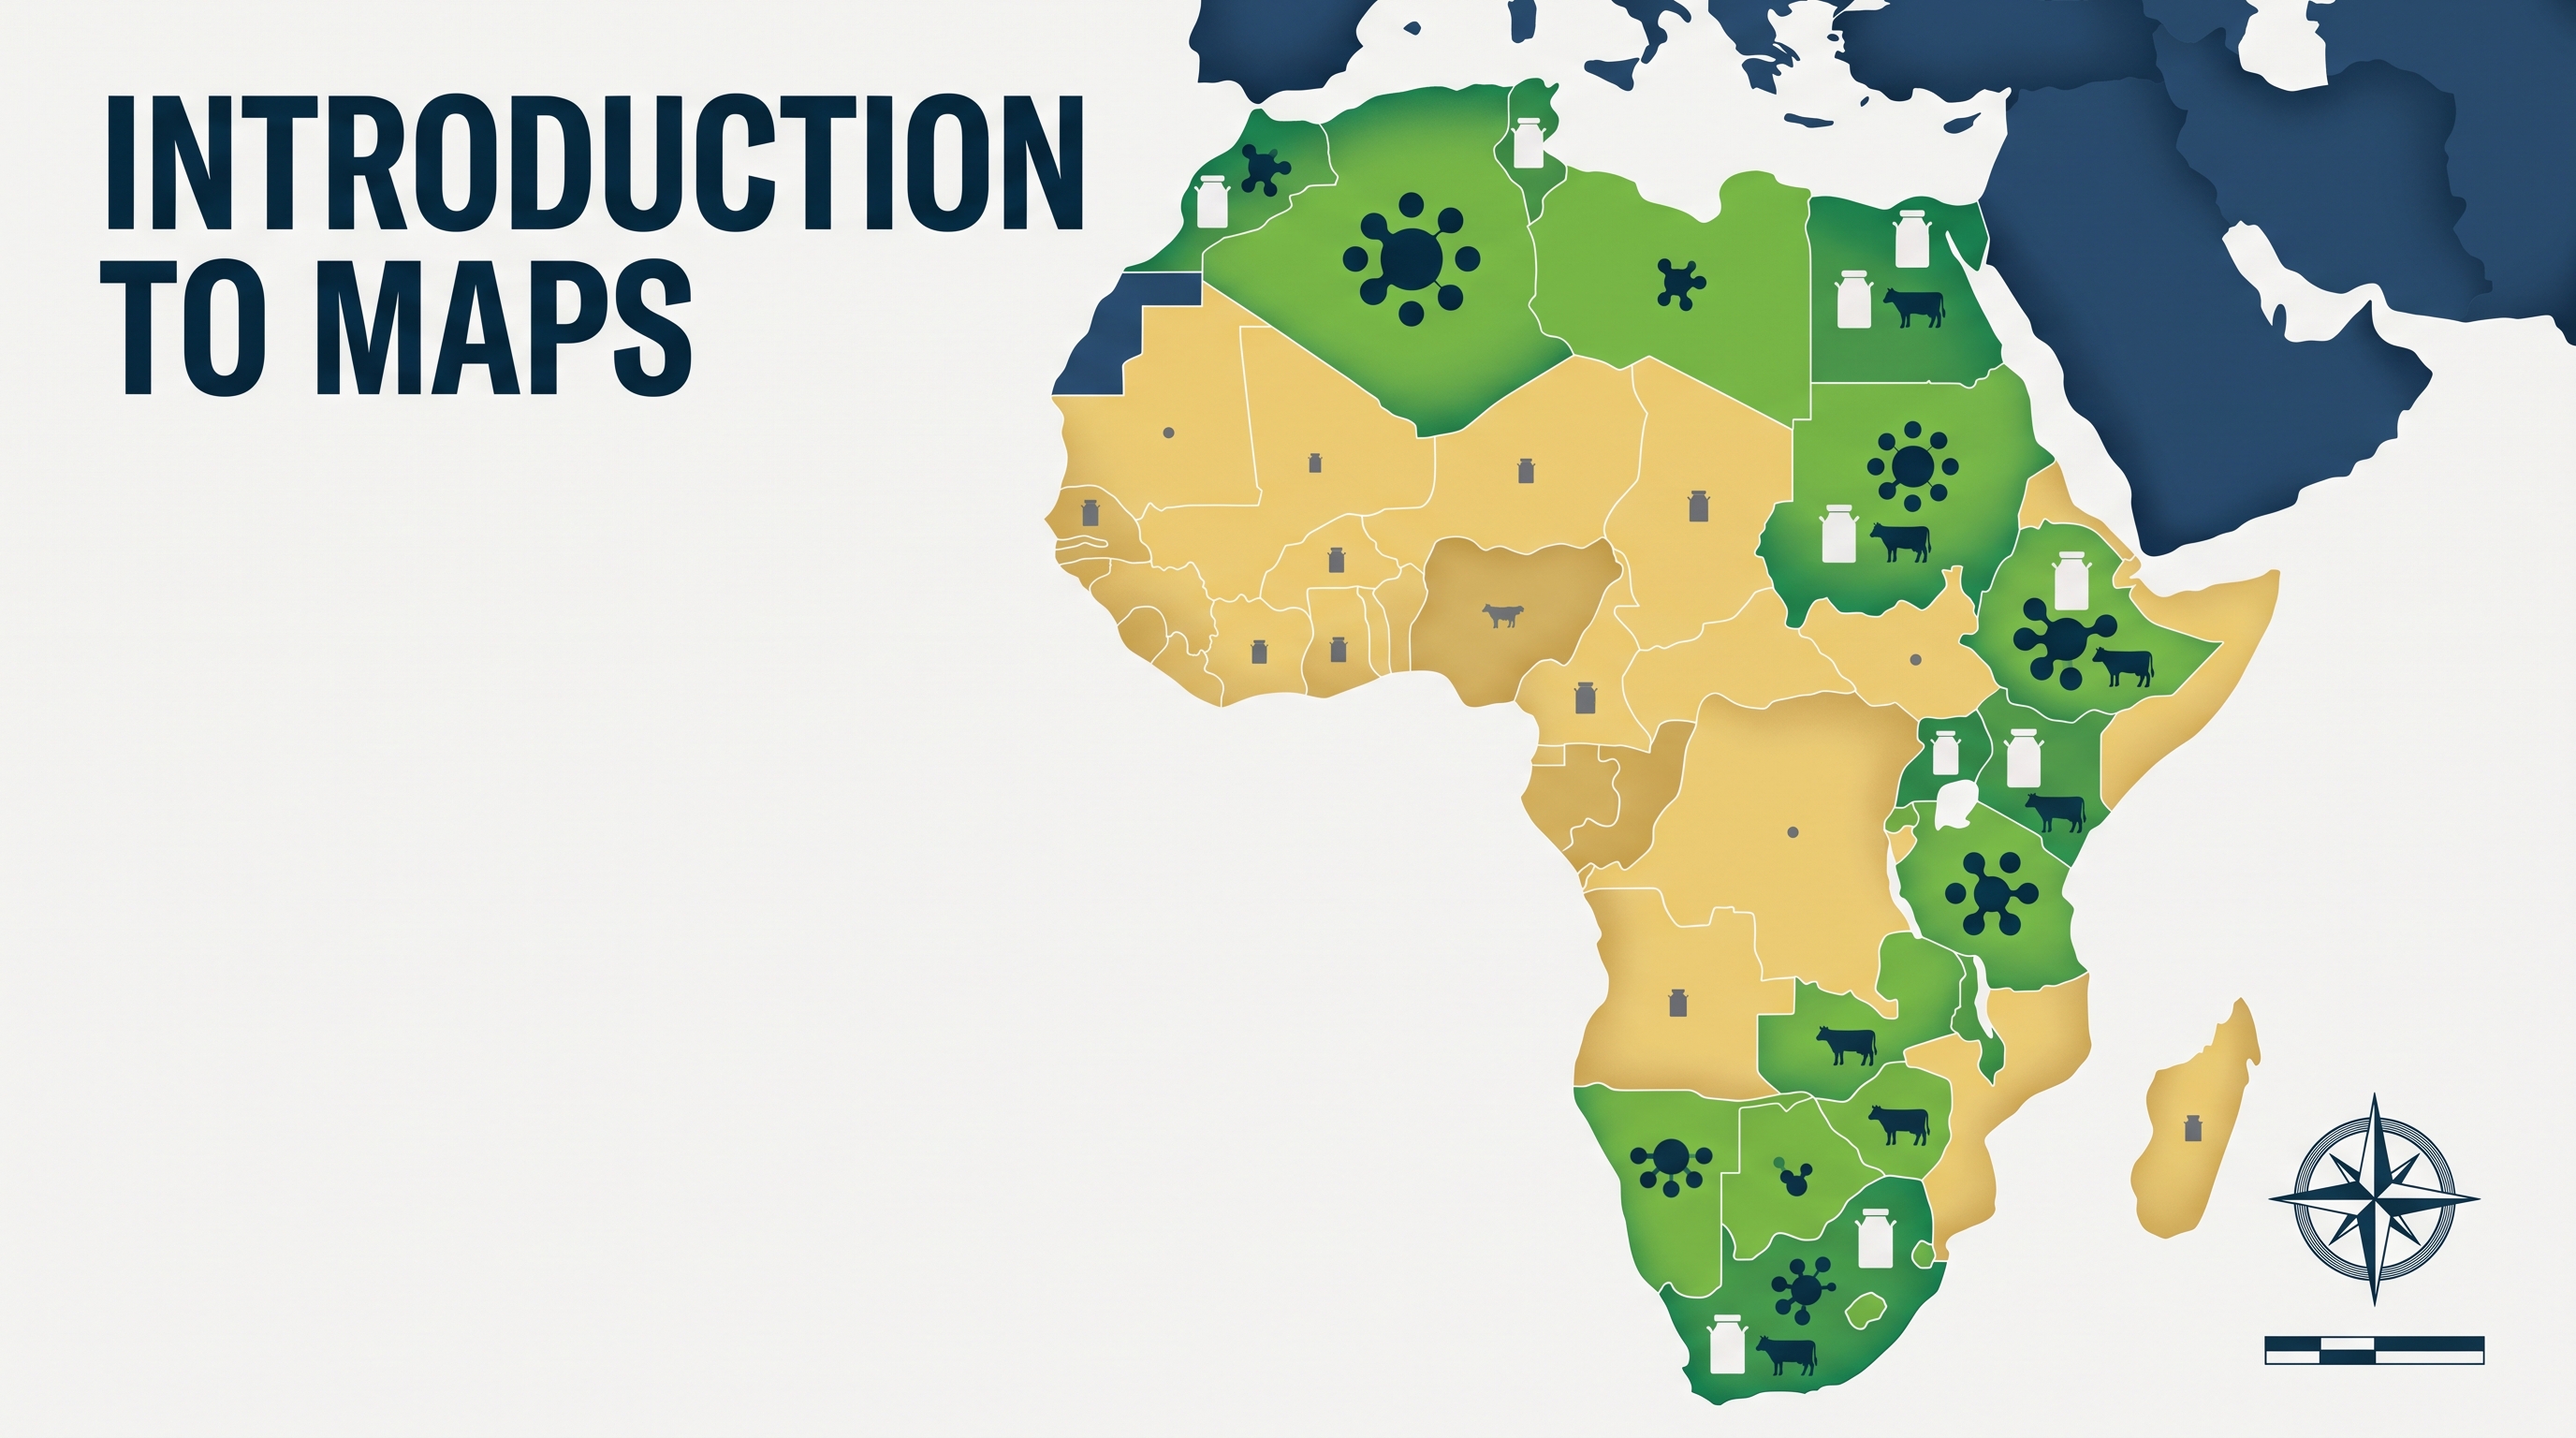
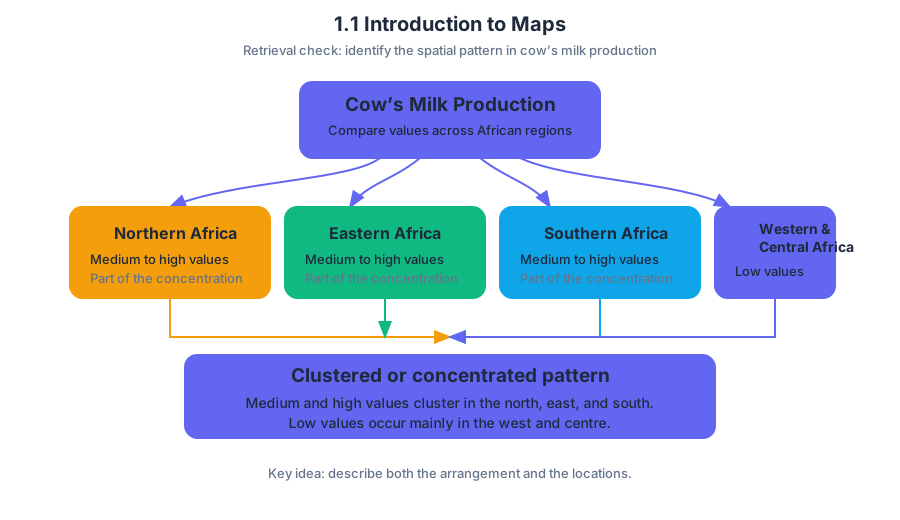
For Africa, the relevant pattern is a contrast between production levels and regions. Medium and/or high amounts of cow’s milk production are concentrated in northern, eastern, and/or southern Africa. Lower amounts are concentrated in western, central, and/or southwestern Africa.
A full description might read: “Cow’s milk production in Africa is clustered, with medium and high production concentrated in the north, east, and south, while low production is concentrated in the west, center, and southwest.” Notice the four required moves: identify the pattern, name the locations, identify the production levels, and distinguish the higher-production areas from the lower-production areas.
Maps show culture as well as commodities
Maps can represent culture traits, or identifiable elements of a group’s culture. Language is a culture trait, just as religion, food preferences, clothing, architecture, music, and land use can be. A language map may reveal a clustered distribution, a regional boundary, or a pattern shaped by migration and historical interaction.
This connection matters because human geography asks not only where things are, but why their locations and patterns differ. Cow’s milk, pork, and language are different kinds of phenomena, yet all can be analyzed through spatial distribution.
AP skills in action
This topic most directly develops the official AP skills Skill 1.A — Identify geographic concepts, processes, models, and theories, Skill 2.A — Describe spatial patterns, Skill 3.A — Identify the characteristics of spatial patterns shown on maps, and Skill 5.A — Describe spatial relationships across different scales. On a map-based prompt, these skills require careful observation before explanation: read the legend, locate the regions, compare categories, and use geographic language precisely.
Named misconception — “Clustered” means “high.” A clustered pattern can contain low, medium, or high values. “Clustered” describes arrangement; “high” describes magnitude. Another misconception is that a map comparison means describing two maps separately. Comparison requires a relationship—such as “whereas,” “in contrast,” or “both”—that connects the maps.
Retrieval check
A map shows medium and high cow’s milk production in northern, eastern, and southern Africa, with low production in western and central Africa. What is the best description of the pattern?
Answer: Production is clustered or concentrated: medium and high values occur mainly in northern, eastern, and southern Africa, while low values occur mainly in western and central Africa. The answer earns precision by stating both the spatial arrangement and the locations of the different production levels.
1.2 Geographic Data
Key concepts: Geographic data · Maps · Quantitative data · Geospatial data · Map-based identification · Spatial analysis · Language patterns · Cultural traits · Food preferences as cultural traits · Ethnic neighborhood clustering
Geographic data are information organized around locations, allowing geographers to ask not only what is happening, but also where, how much, and in what spatial pattern.
1.2 Geographic Data
Geographic data are information organized around locations, allowing geographers to ask not only what is happening, but also where, how much, and in what spatial pattern. A county map showing household language, a table reporting percentages, and a GIS layer locating neighborhoods are different presentations of geographic data.
Three forms of geographic data
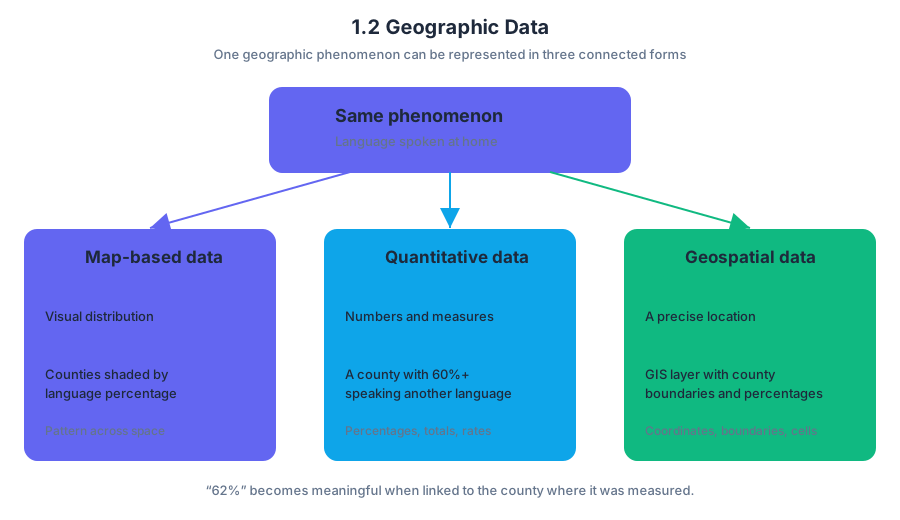
The same geographic phenomenon can appear in three closely connected forms:
| Form | What it shows | Example |
|---|---|---|
| Map-based data | A visual distribution across space | Counties shaded by the percentage of residents who speak a language other than English at home |
| Quantitative data | Numerical measurements or counts | A county in which $60%$ or more of residents speak another language at home |
| Geospatial data | Information linked to precise geographic coordinates or spatial features | A GIS layer containing county boundaries and language-use percentages |
Quantitative data use numbers: percentages, totals, rates, averages, or rankings. Geospatial data add a location component, such as coordinates, boundaries, routes, or raster cells. A number becomes more geographically useful when it can be connected to a place—for example, “$62%$” becomes meaningful when the geospatial record identifies the county where that percentage was measured.
Reading a map as data—not decoration
Map interpretation often begins with map-based identification, the act of locating a particular point, county, region, or category shown in a map. Before making an inference, read the title, legend, geographic scale, and classification ranges. On a choropleth map, darker shading usually indicates a larger value, but the legend—not the shade alone—determines the exact meaning.
The language map classifies counties according to the percentage of people age five and older who spoke a language other than English at home. Its darkest category represents $60.0%$ or more, while progressively lighter categories represent $35.0$–$59.9%$, $17.9$–$34.9%$, $4.6$–$17.8%$, and $4.5%$ or less.
Worked example: identifying a cultural pattern
Question 11 asks which languages are most likely spoken in counties where at least $60%$ of residents speak a language other than English at home. The options include French and French Creole; Spanish and American Indian; German and Dutch; Russian and Hindi; and Chinese and Arabic.
Step 1: Identify the relevant map category. Select the black counties, because the legend defines black as $60.0%$ or more.
Step 2: Locate the strongest clusters. Major concentrations appear along the southern border and in parts of the Southwest, including the Four Corners region.
Step 3: Connect location to geographic knowledge. Counties along the southern border are strongly associated with Spanish-speaking populations because of proximity to Mexico and longstanding cultural ties. Concentrated areas in the Four Corners region include major Indigenous communities, such as the Navajo Nation, where American Indian languages are spoken.
Step 4: Select the best-supported conclusion. The answer is (B) Spanish and American Indian languages.
From identification to spatial analysis
Spatial analysis examines how geographic phenomena are arranged. Instead of merely naming a location, it describes patterns such as clustering—features concentrated near one another—or orientation—a distribution organized along a particular direction, border, coast, river, or transportation corridor.
For example, “the darkest counties are in the Southwest” is a location statement. “The darkest counties form clusters along the southern border and around the Four Corners region” is spatial analysis because it identifies concentration, relative location, and regional orientation.
Geographic data can reveal culture
A culture trait is a characteristic associated with a cultural group. PSO-3.A.2: Culture traits include such things as food preferences. Foods may have distinctive ingredients or methods of preparation, and beliefs may identify certain foods as permitted or forbidden. Consequently, food preferences can be mapped as evidence of cultural patterns, just as language, religion, architecture, or clothing can.
For instance, a regional food pattern may reflect local ingredients, historical migration, a specific cultural tradition, or religious rules about preparation and consumption. The geographic distribution of the food is therefore not random: it may show cultural diffusion, persistence, or connection to a particular region.
Skills and misconceptions
This topic develops Skill 1.B: Explain geographic concepts, processes, models, and theories when connecting a mapped pattern to concepts such as culture traits. It also develops Skill 3.C: Explain patterns and trends in maps and in quantitative and geospatial data to draw conclusions, especially when moving from a map’s visual evidence to a defensible geographic inference.
Misconception check: The darkest county is not automatically the county with the largest population of non-English speakers. Choropleth shading shows a percentage category, not necessarily a total number of people. A sparsely populated county could have a high percentage while containing fewer speakers overall than a densely populated county with a lower percentage.
Retrieval check
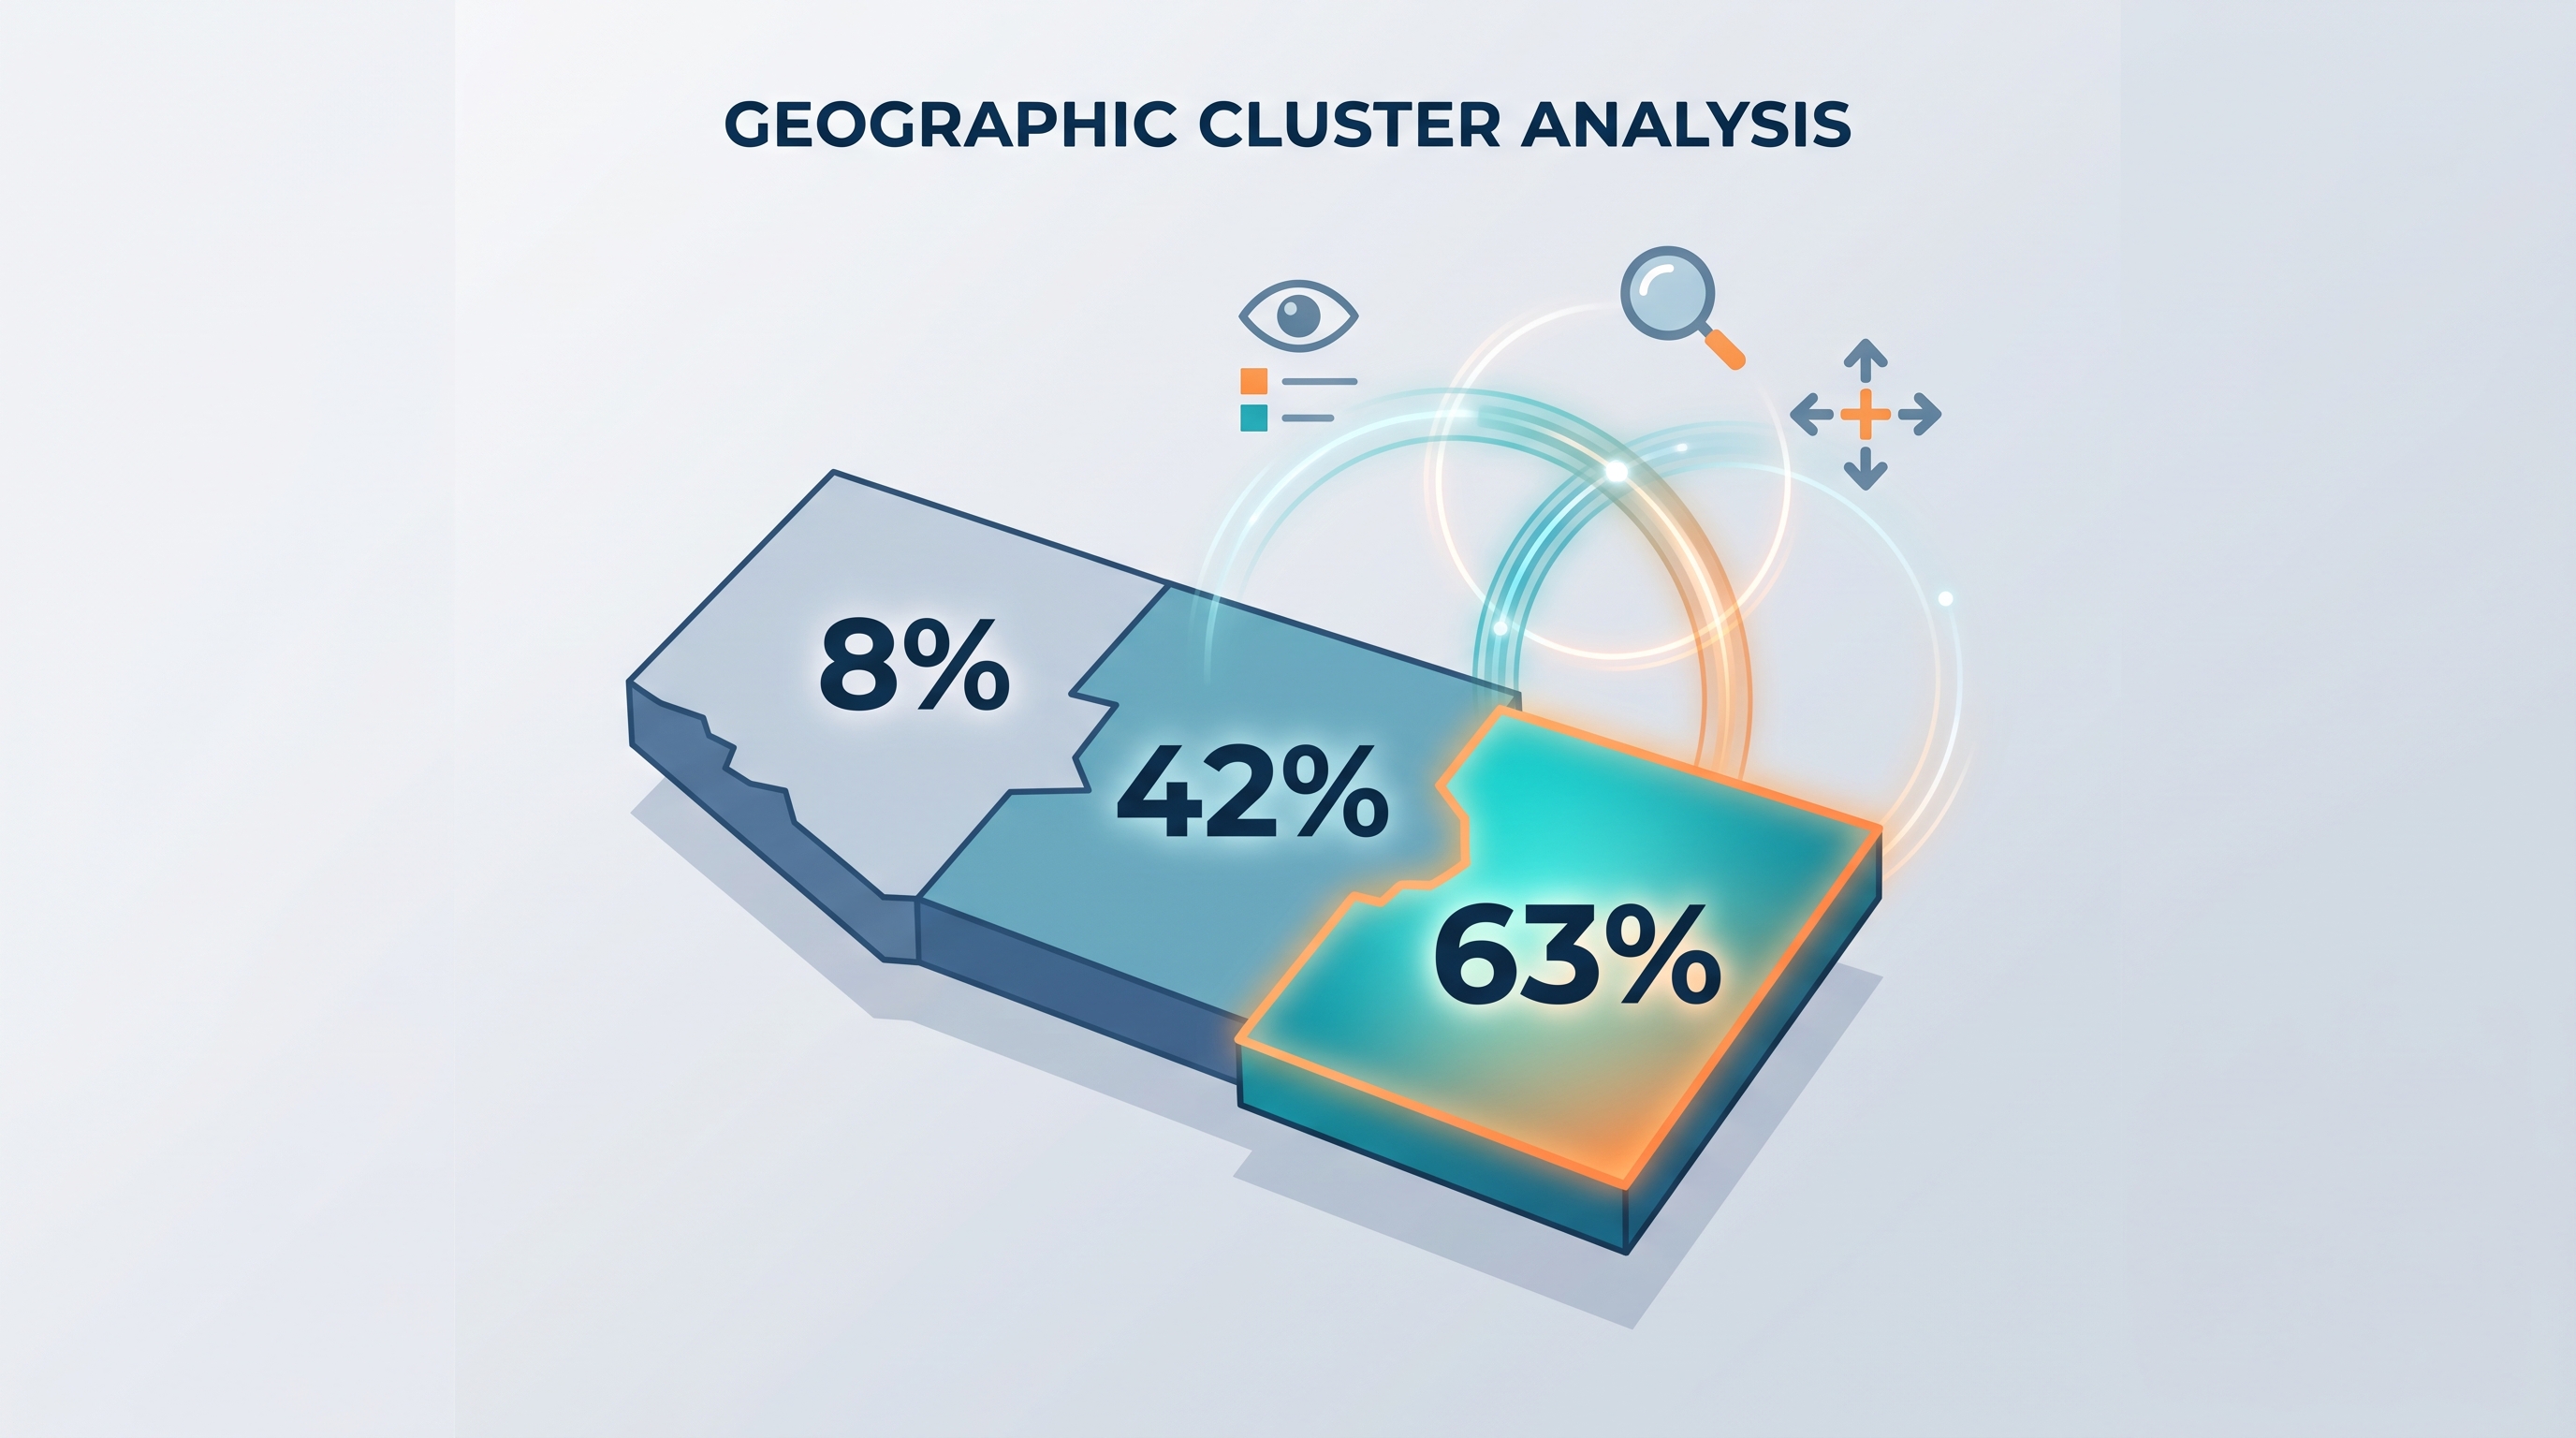
A map shows three neighboring counties with values of $8%$, $42%$, and $63%$. Which county belongs to the highest category on the language map, and what additional evidence would you use before claiming that the counties form a meaningful spatial cluster? The correct reasoning identifies the $63%$ county, then checks adjacency, scale, the legend, and whether the pattern persists across surrounding counties.
1.3 The Power of Geographic Data
Key concepts: Geographic data · Geospatial data · Quantitative data · Spatial relationships · Scale of analysis · Patterns and processes · Relationships among places · Geographic perspectives · Time-space compression · Distance decay
A map becomes geographically powerful when it does more than show where something is: it helps explain why that pattern occurs, how places are connected, and what changes across scale.
1.3 The Power of Geographic Data
A map becomes geographically powerful when it does more than show where something is: it helps explain why that pattern occurs, how places are connected, and what changes across scale. A set of numbers can show that one neighborhood has more restaurants than another; combining those numbers with location, transportation, income, and land-use information can suggest why the restaurants cluster there.
Geographic data become analytically powerful when quantitative evidence is connected to spatial relationships, geographic context, and processes operating across places.
From data to geographic explanation
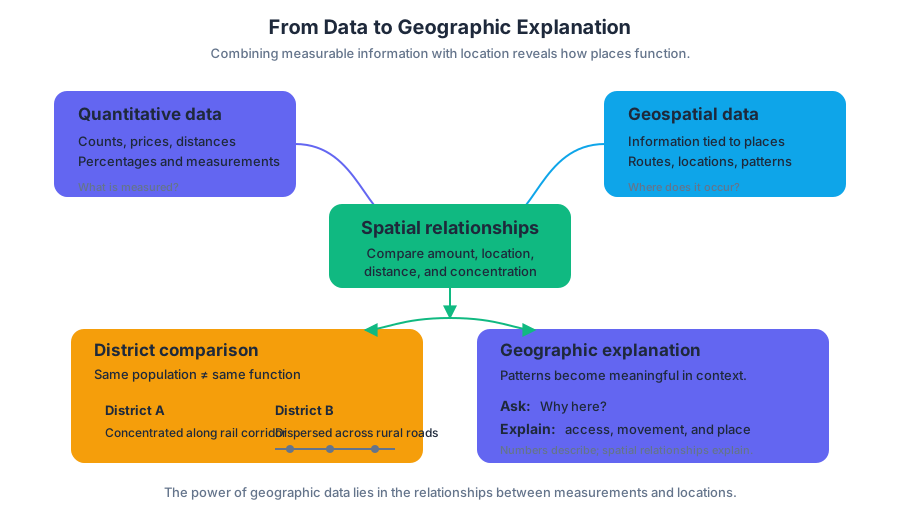
The previous topic established that geographic information can come from field observations, surveys, censuses, GPS, remote sensing, GIS, and other sources. Organizations and individuals may also gather information directly in the field. Here, the key step is not collecting another type of data; it is combining quantitative data—measurable information such as population counts, prices, distances, or percentages—with geospatial data, information linked to specific locations on Earth.
Geographers use quantitative and spatial relationships to analyze complex issues. A table might report that two districts have similar populations, while a map reveals that one district is concentrated along a rail corridor and the other is dispersed across rural roads. The numerical similarity does not mean the places function in the same way.
Worked example: explaining a restaurant pattern
Suppose a city records the locations of $120$ new restaurants, average household income, pedestrian counts, and distances to rail stations.
- Quantitative evidence: The highest pedestrian counts occur near rail stations, and restaurant openings are more common in higher-income districts.
- Geospatial evidence: The restaurants form visible clusters along transit lines rather than spreading evenly across the city.
- Spatial relationship: The cluster connects restaurants with accessibility and concentrated foot traffic.
- Geographic explanation: Restaurant growth is likely shaped by the interaction of consumer purchasing power, transportation access, and the movement of people through particular places.
The conclusion is stronger than “restaurants are more numerous in District A.” It identifies a relationship among economic, cultural, and spatial factors. It also remains appropriately cautious: the data show association, but they do not automatically prove that income alone caused the pattern.
Geographic perspectives
A geographic perspective is a way of interpreting an issue by asking how location, scale, connections among places, and human–environment relationships shape it. The same restaurant pattern can produce different explanations depending on the perspective used.
| Geographic perspective | Guiding question in the restaurant example |
|---|---|
| Spatial | Where are restaurants clustered, and what relationships connect them to transit, roads, or customers? |
| Regional | Does the pattern distinguish one part of the city from another, creating a recognizable region? |
| Human–environment | How do terrain, available land, environmental conditions, or infrastructure affect where restaurants can operate? |
These perspectives work together rather than compete. A spatial analysis may identify a cluster; a regional analysis may show that the cluster belongs to a rapidly redeveloping corridor; a human–environment analysis may reveal that a river, steep slope, or floodplain limits expansion.
Scale changes the pattern
Scale of analysis is the geographic level at which data are examined. It may be global, regional, national, or local. The pattern visible at one scale may weaken, disappear, or reverse at another.
Consider air pollution. At the global scale, emissions may appear concentrated in major industrial economies. At the national scale, the pattern may vary by energy policy and industrial geography. At the local scale, pollution may be highest beside a highway or factory, even within a generally low-pollution region.
This principle is captured by PSO-1.C.1, which identifies global, regional, national, and local scales of analysis, and PSO-1.D.1, which emphasizes that patterns and processes at different scales can produce variations in, and different interpretations of, data. Maps and data must therefore be interpreted in relation to the context and scale in which they are presented.
Patterns, processes, and changing connections
A spatial pattern is the arrangement of features across space; a process is an action or change that produces, maintains, or transforms that arrangement. Geographers analyze relationships among and between places to reveal important patterns and processes, including environmental, economic, cultural, and political relationships.
Modern transportation and communication can make distant places interact more quickly and frequently. This broad condition is associated with time-space compression and time-space convergence: technological change reduces the practical effects of distance by accelerating connections. The important analytical question is not simply whether places are connected, but which places gain access, at what scale, and with what consequences.
Examiner’s misconception check — “The map proves the cause.”
A visible cluster shows a pattern, not automatically its cause. A strong geographic explanation identifies evidence, names a spatial relationship or process, and connects that relationship to the geographic context and scale.
Skill focus: Data Analysis 3.B — Describe spatial patterns presented in maps and in quantitative and geospatial data
For Data Analysis 3.B, move from observation to interpretation: describe the pattern accurately, identify relevant relationships, and explain what the pattern may reveal. Also apply Scale Analysis 5.A — Identify the scales of analysis presented by maps, quantitative and geospatial data, images, and landscapes when deciding whether a conclusion applies locally, regionally, nationally, or globally.
Retrieval check: A map shows similar unemployment rates for two countries, but one country’s unemployment is concentrated in a few industrial regions while the other’s is widespread. What did the national scale conceal, and what additional scale or geospatial evidence would help explain the difference? Include the pattern, the scale, and one possible process.
1.4 Spatial Concepts
Key concepts: Spatial patterns · Spatial distribution · Spatial relationships · Diffusion · Domestication · Agglomeration · Clustering · Relative location · Geographic scale · Source analysis
A spatial pattern is never random decoration on a map: it records where phenomena are located, how they are arranged, and what relationships connect them.
1.4 Spatial Concepts
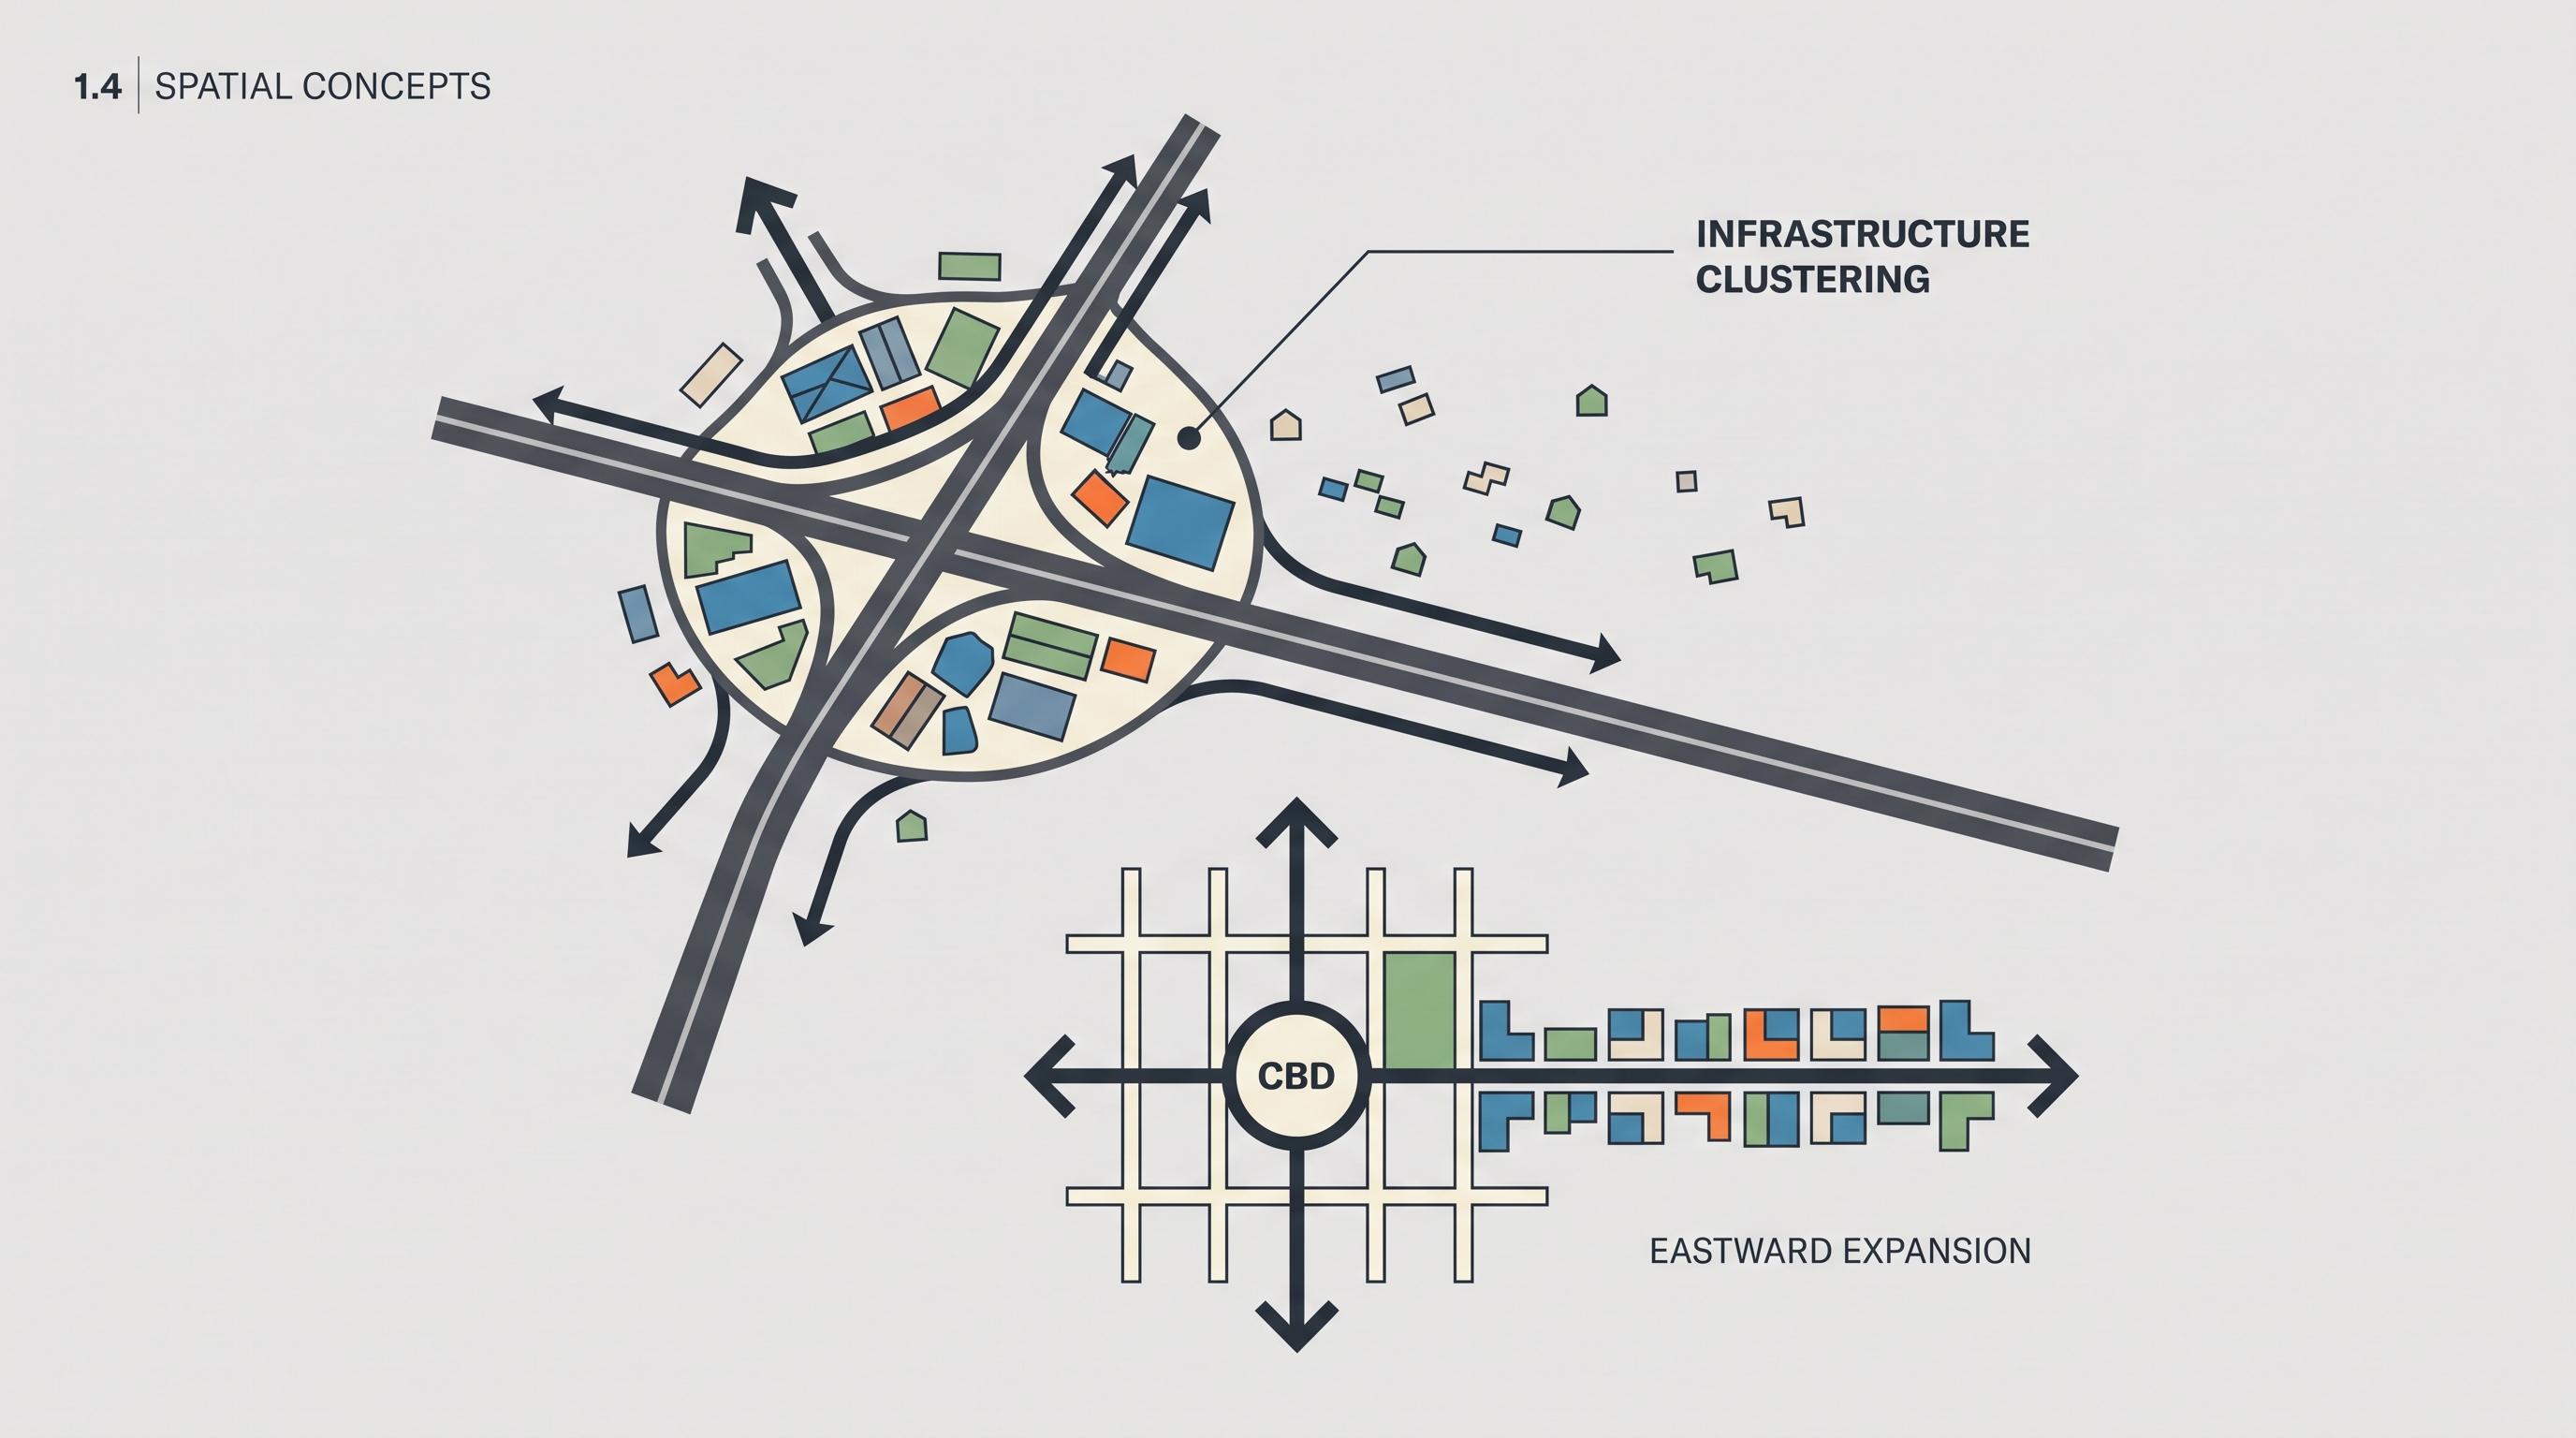
A spatial pattern is never random decoration on a map: it records where phenomena are located, how they are arranged, and what relationships connect them. A row of neighborhoods east of a central business district, farms clustered along a highway, or domesticated animals spreading from several early hearths can all be analyzed as spatial patterns.
From location to spatial relationship
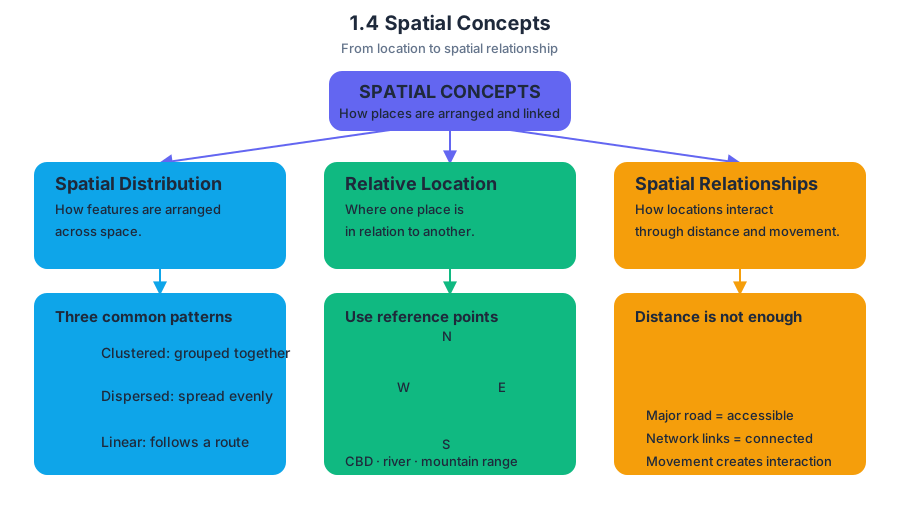
Spatial distribution describes how something is arranged across space. Geographers commonly describe a distribution as clustered, dispersed, or linear. Clustering occurs when features are concentrated near one another; dispersion occurs when they are spread relatively evenly; and a linear pattern follows a route or axis such as a river, road, coastline, or railway.
Relative location identifies where one place is in relation to another. Use cardinal directions—north, south, east, and west—along with recognizable reference points such as a central business district, river, or mountain range. “Neighborhoods east of the CBD and aligned along an east-west axis” is a stronger geographic description than “the neighborhoods are on the right side of the map.”
Spatial relationships explain how locations interact through distance, direction, accessibility, connectivity, and movement. Accessibility is the relative ease of reaching a place; connectivity is the degree to which places are linked by transportation or communication networks. A location beside a major road may be more accessible than an equally distant location connected only by a narrow local street.
Infrastructure, clustering, and agglomeration
Infrastructure does not merely occupy space—it reorganizes it. When a new road connects a rural settlement to a regional market, businesses, warehouses, housing, and services may gather near intersections or highway exits. This concentration is agglomeration: the clustering of related activities because proximity creates advantages such as shared labor, customers, suppliers, information, and transportation.
The same process can appear at several scales. Locally, shops may cluster along one road. Regionally, factories may concentrate around a connected metropolitan corridor. Globally, firms may agglomerate in cities with ports, airports, universities, and skilled labor. A common error is to treat clustering as proof that every feature has the same cause; a map shows the pattern, but explanation requires considering accessibility, historical development, land costs, and infrastructure.
Key distinction: Clustering describes where features are arranged. Agglomeration explains why related activities benefit from locating together.
Domestication as a spatial process
Domestication is the long-term process through which humans selectively breed and manage plants or animals for desired traits. Major early hearths of domestication arose in the Fertile Crescent, the Indus River Valley, Southeast Asia, and Central America. These hearths were not a single point of origin for all agriculture; different societies domesticated different species in different places.
The required learning objective SPS-5.A, “Identify major centers of domestication of plants and animals,” depends on SPS-5.A.1, which identifies the Fertile Crescent, Indus River Valley, Southeast Asia, and Central America as major hearth regions. The geographic question is therefore both what was domesticated and where that process began.
Domesticated species later diffused through migration, trade, conquest, and colonization. The Columbian Exchange moved plants, animals, people, and diseases between the Americas and Afro-Eurasia after 1492, while agricultural revolutions expanded the geographic reach and productivity of farming. This fulfills SPS-5.B, “Explain how plants and animals diffused globally,” supported by SPS-5.B.1, which identifies the Columbian Exchange and agricultural revolutions as major diffusion processes.
Pigs illustrate how diffusion creates a visible geographic pattern. Wild boar were domesticated in multiple parts of Eurasia, and domesticated pigs later moved with human populations and trade networks. On a production map, high pork production may form clusters where pigs are culturally accepted, economically valuable, and supported by feed, markets, and transportation; low production may appear where religious practices, environmental conditions, or food traditions discourage pig raising. The pattern is not explained by climate alone.
Reading patterns and explaining tensions
A map showing irrigated farms expanding along a river may reveal a linear agricultural pattern and increasing connectivity to markets. At the same time, the expansion can reduce the continuous land available for nomadic travel, producing spatially expressed tension between a settled farming distribution and a mobile pastoral distribution. The key analysis is the relationship between land uses, routes, and scale—not simply a claim that one group “caused” conflict.
Industrialization likewise produces uneven spatial distributions when roads, utilities, factories, and skilled labor concentrate in selected places. At the neighborhood scale, infrastructure can create corridors and clusters; at the regional scale, it can produce growth poles and connected urban networks. Scale analysis asks whether the same pattern persists, changes, or becomes more complicated when viewed locally, regionally, or globally.
AP skills in action
This topic most directly exercises Skill Category 1: Concepts and Processes—1.A Identify and define geographic concepts and processes, 1.B Describe geographic concepts, processes, models, and theories, and 1.C Explain geographic concepts, processes, models, and theories—when distinguishing diffusion, clustering, agglomeration, and domestication.
It also develops Skill Category 2: Spatial Relationships—2.A Describe spatial patterns, 2.B Explain spatial relationships, and 2.C Explain a spatial pattern using geographic concepts, processes, models, or theories—when interpreting directions, axes, roads, production clusters, and diffusion routes. Skill Category 4: Source Analysis, especially 4.A Identify information from geographic representations and 4.B Describe spatial patterns in geographic representations, applies when extracting evidence from maps. Finally, 5.B Scale Analysis: Explain spatial relationships across various geographic scales using geographic concepts, processes, models, or theories requires explaining how infrastructure or diffusion operates differently at neighborhood, regional, and global scales.
Misconception check
Misconception: “A cluster means the phenomenon is evenly distributed within that area.”
A cluster means concentration relative to surrounding space; it may still contain gaps and internal variation. Similarly, a linear pattern does not necessarily mean every feature lies in a perfect line—it means the arrangement follows a recognizable route or directional axis.
Retrieval check
A map shows markets and warehouses concentrated around highway intersections, while nearby homes are dispersed across the countryside. Identify one spatial pattern, explain how infrastructure produced it, and name the process that describes businesses benefiting from locating together. Then describe a second map showing neighborhoods east of a CBD along an east-west axis using both a cardinal direction and relative location.
1.5 Human–Environmental Interaction
Key concepts: Human–environment interaction · Environmental determinism · Possibilism · Geographic concepts · Natural environment · Environmental sustainability · Relationships among geographic factors · Environmental injustice · Housing discrimination · Pull factors
A flooded neighborhood, a heat-exposed apartment, or a farm beside a shrinking reservoir reveals the same geographic question: how do natural environments influence human societies, and how do human decisions reshape those environments?
1.5 Human–Environmental Interaction
A flooded neighborhood, a heat-exposed apartment, or a farm beside a shrinking reservoir reveals the same geographic question: how do natural environments influence human societies, and how do human decisions reshape those environments? Human–environment interaction is not a one-way relationship. Physical conditions create opportunities and hazards, while technology, wealth, culture, and political choices determine who faces risk and who can avoid it.
PSO-1 — Geographers analyze relationships among and between places to reveal important spatial patterns.
PSO-1.B — Explain how major geographic concepts illustrate spatial relationships.
PSO-1.B.2 — Theories regarding the interaction of the natural environment with human societies have evolved from environmental determinism to possibilism.
Two theories of human–environment interaction
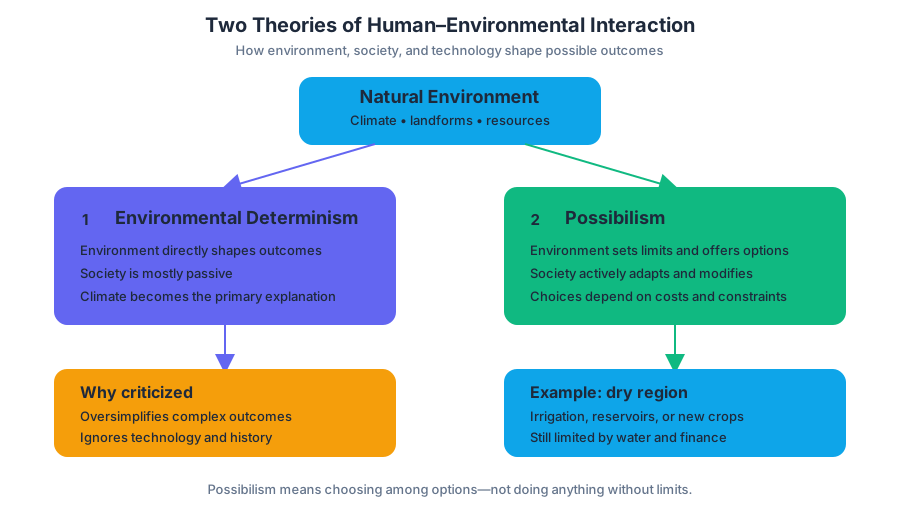
Environmental determinism is the belief that the natural environment strongly determines human behavior, culture, economic activity, or social development. In this view, climate, landforms, or available resources act almost like invisible forces: hot climates supposedly produce certain social behaviors, while temperate climates supposedly encourage particular forms of development.
Environmental determinism is historically important but widely criticized because it treats human societies as passive and oversimplifies complex outcomes. Two places with similar climates may develop very different economies because their residents possess different technologies, institutions, historical experiences, and access to capital.
Possibilism argues that the natural environment sets limits and offers opportunities, but people choose among many possible responses using culture, technology, and social organization. A dry environment does not make farming impossible; irrigation, drought-resistant crops, water pricing, and conservation may make agriculture possible—but each solution has costs and limits.
| Perspective | Role of the natural environment | Role of human society | Example |
|---|---|---|---|
| Environmental determinism | Directly shapes or determines human outcomes | Mostly passive | Climate is treated as the primary explanation for cultural or economic differences |
| Possibilism | Provides constraints and opportunities | Actively adapts and modifies | A dry region uses irrigation, reservoirs, or different crops, subject to water and financial limits |
Named misconception — “Possibilism means humans can do anything.” Possibilism does not erase environmental limits. A society may engineer around drought, cold, or steep terrain, but it cannot assume unlimited water, money, energy, or ecological resilience. The stronger geographic explanation connects environmental conditions with human choices rather than assigning all outcomes to only one side.
Sustainability and environmental injustice
Environmental sustainability means using resources and managing environments in ways that meet present needs without preventing future generations from meeting theirs. Sustainable decisions consider three connected questions: Can the environment continue to support the activity? Can the economy maintain it? Are its benefits and burdens distributed fairly?
Consider a photograph showing cracked soil, dead vegetation, and a nearly empty reservoir. A possible sustainability solution is to replace water-intensive crops with drought-resistant varieties while combining drip irrigation, groundwater monitoring, and limits on total water withdrawals. This solution addresses the visible environmental problem, but a complete geographic analysis also asks who can afford the new equipment and whether small farmers receive equal access to assistance.
Environmental injustice occurs when some populations experience greater environmental hazards or receive fewer environmental benefits because of income, race, political power, or other social conditions. For example, lower-income residents may be more likely to live near highways, industrial facilities, flood-prone land, or poorly maintained housing, while wealthier residents can relocate or pay for protection.
Housing, services, and human environments
Housing patterns are shaped not only by land and climate but also by political and financial decisions. Redlining was the discriminatory practice of denying loans, insurance, or investment to residents of particular neighborhoods, often based on racial composition. Blockbusting involved real-estate agents encouraging white residents to sell by spreading fears that racial or ethnic change would reduce property values, then profiting by reselling homes to new residents.
These practices changed the human environment over time: they influenced where people could buy homes, how neighborhoods accumulated wealth, where infrastructure was built, and which communities remained exposed to hazards. The pattern is not environmental determinism; it is a socially produced relationship between political decisions, housing markets, and physical risk.
Affordability and access to services also shape human environments. When housing costs rise near reliable transportation, schools, clinics, grocery stores, or employment, households with lower incomes may be pushed toward areas with longer commutes, fewer services, or greater exposure to pollution and hazards. A map showing unequal access is therefore evidence of both spatial pattern and unequal opportunity.
Pull factors and environmental choices
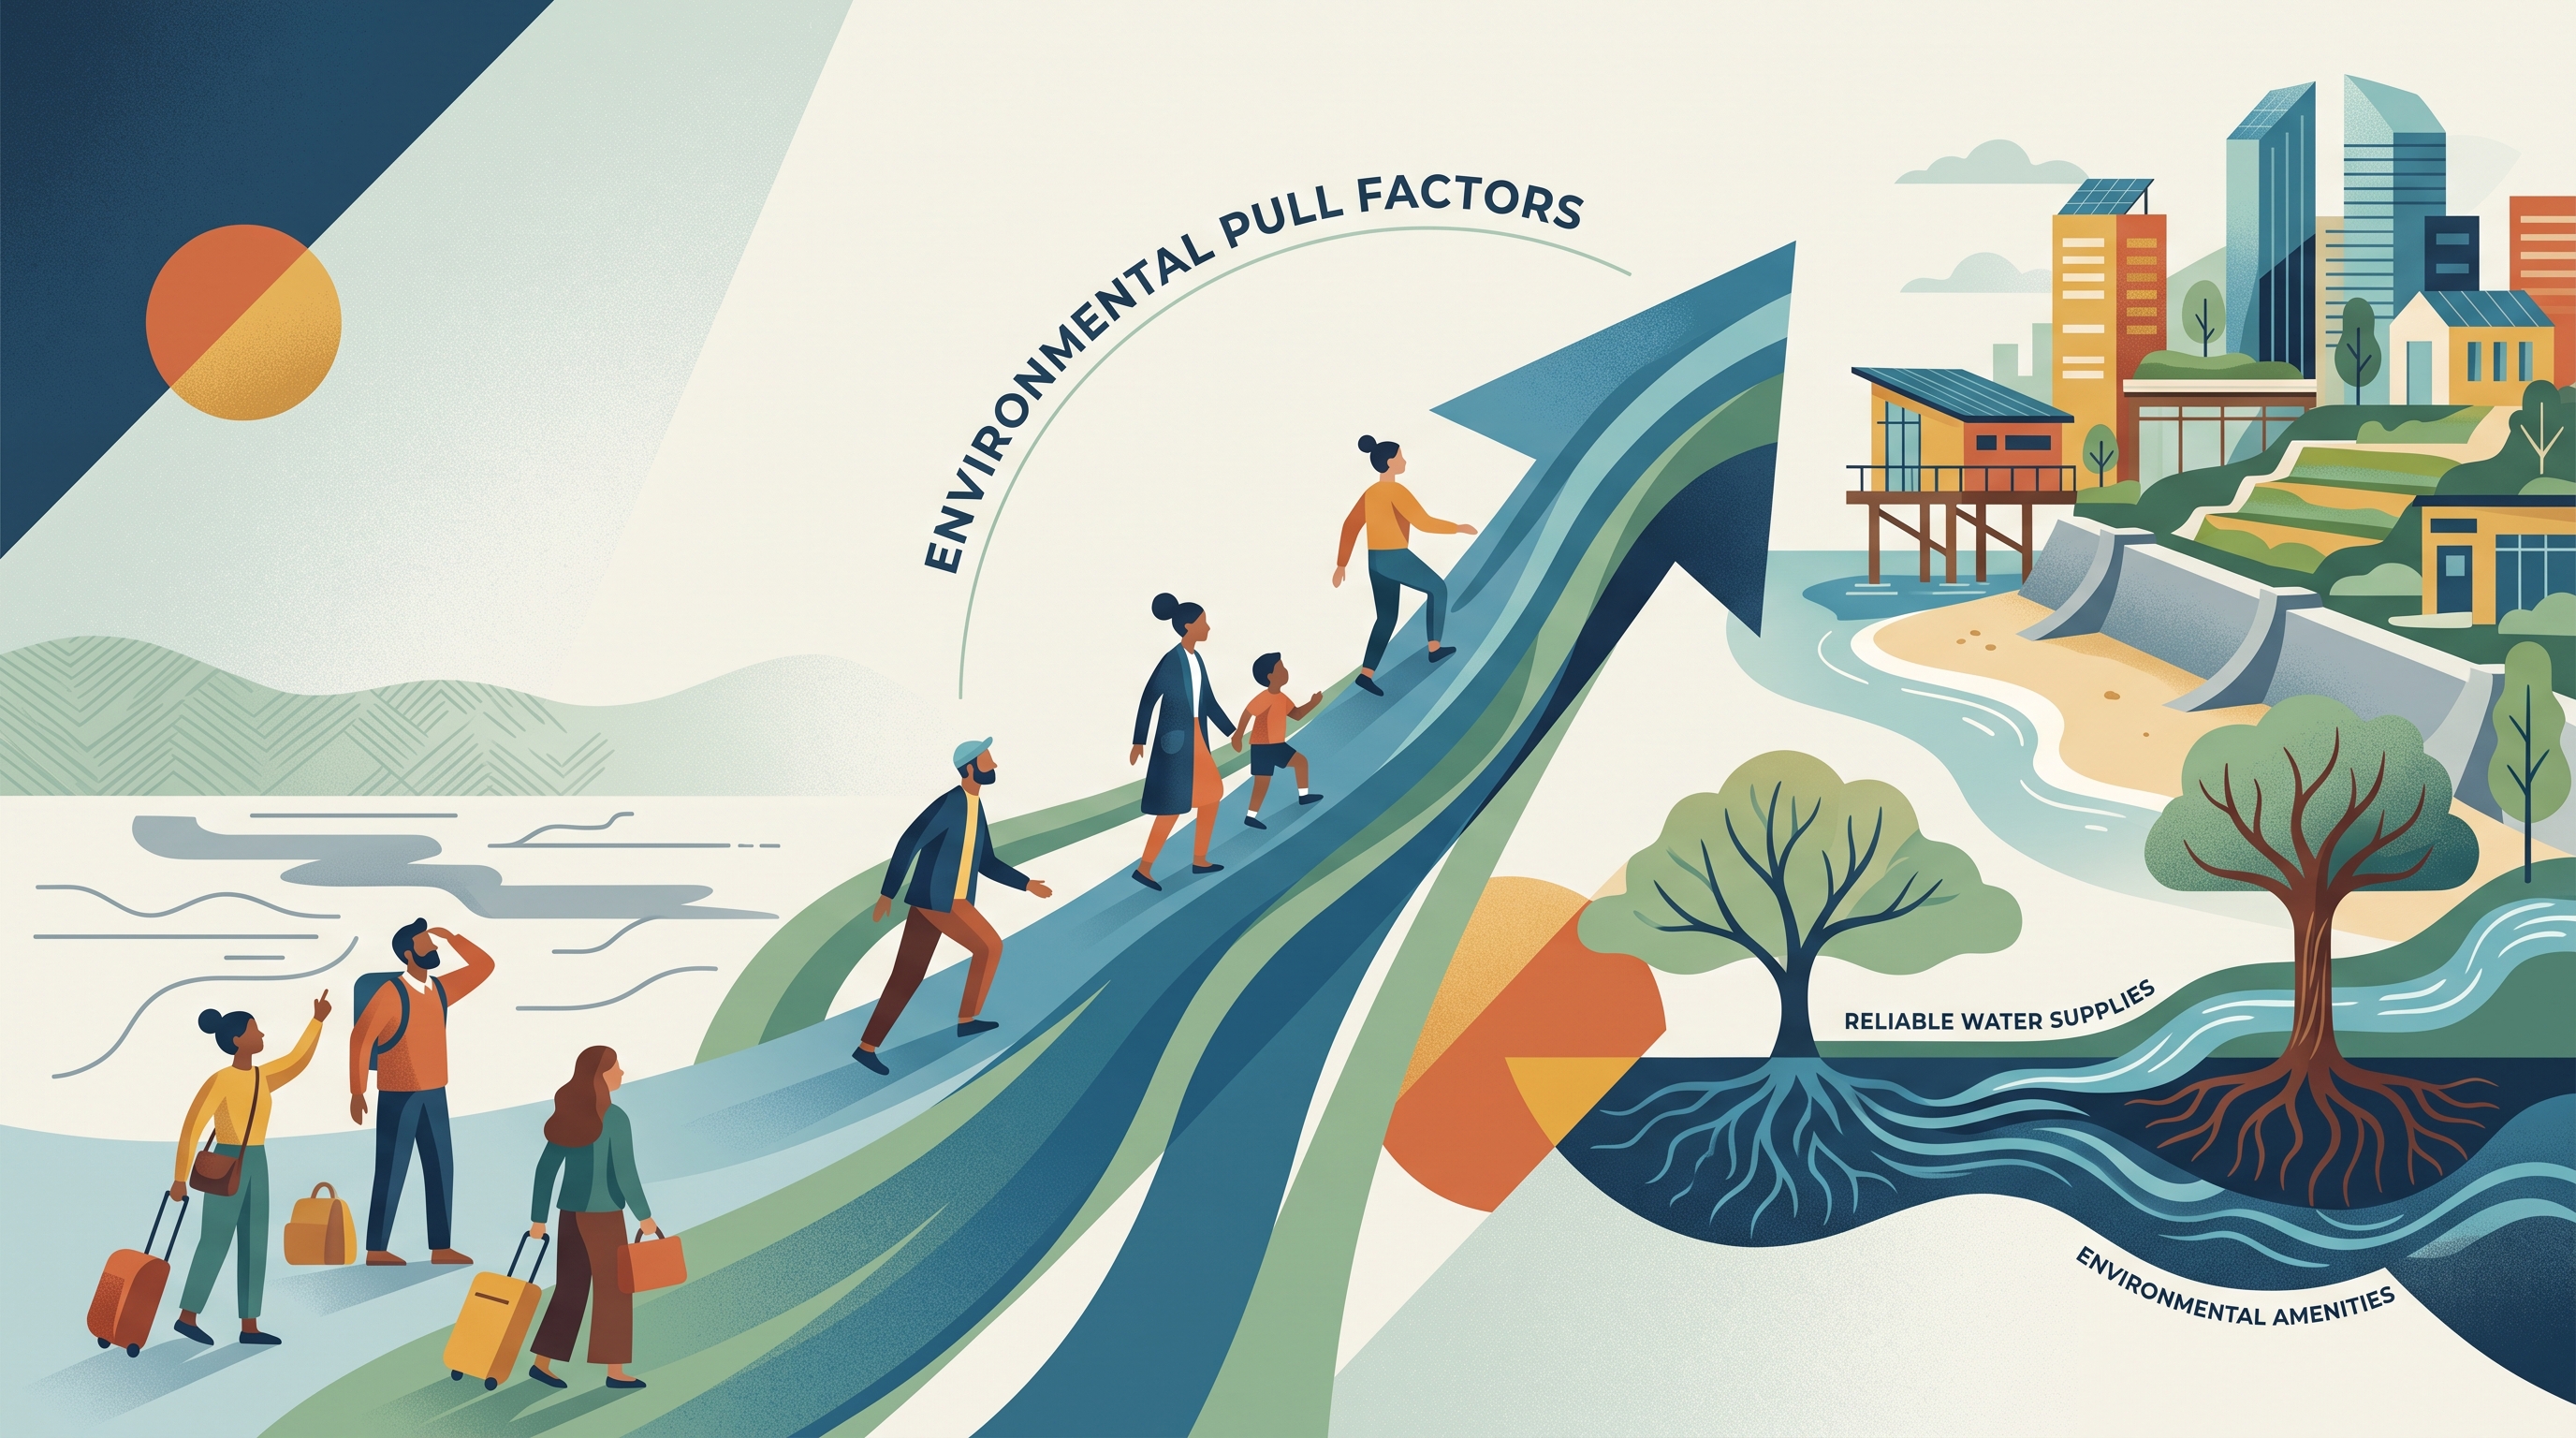
A pull factor is a condition that attracts people toward a destination. Higher wages, safer housing, available services, environmental amenities, or reliable water supplies can draw migrants, even when the destination has high costs. Environmental conditions can therefore influence population movement through both hazards that push people away and opportunities that pull them toward another place.
Retrieval check: A coastal city builds flood barriers, preserves wetlands, and offers grants so low-income households can elevate homes. Which idea best explains the response: environmental determinism or possibilism? What sustainability and environmental-justice question should be asked next?
Answer: Possibilism, because people are adapting to environmental constraints through organized choices and technology. The next question is whether protection and financial support reach all residents fairly.
1.6 Scales of Analysis
Key concepts: scales of analysis · spatial patterns · relationships among places · supranational organizations · shared decision-making · state sovereignty · regional scale · national scale · agglomerations · specific infrastructure and locations
A map can show an entire country while hiding the places, infrastructures, and relationships that make the country function. Scale of analysis is the geographic level—global, regional, national, or local—at which a pattern or process is examined.
1.6 Scales of Analysis
A map can show an entire country while hiding the places, infrastructures, and relationships that make the country function. Scale of analysis is the geographic level—global, regional, national, or local—at which a pattern or process is examined.
PSO-1: Geographers analyze relationships among and between places to reveal important spatial patterns.
The central question is not simply “What does the map show?” but “What becomes visible or invisible when the geographic viewpoint changes?” A pattern that appears clear at one scale may weaken, disappear, or receive an entirely different interpretation at another.
The four scales of analysis
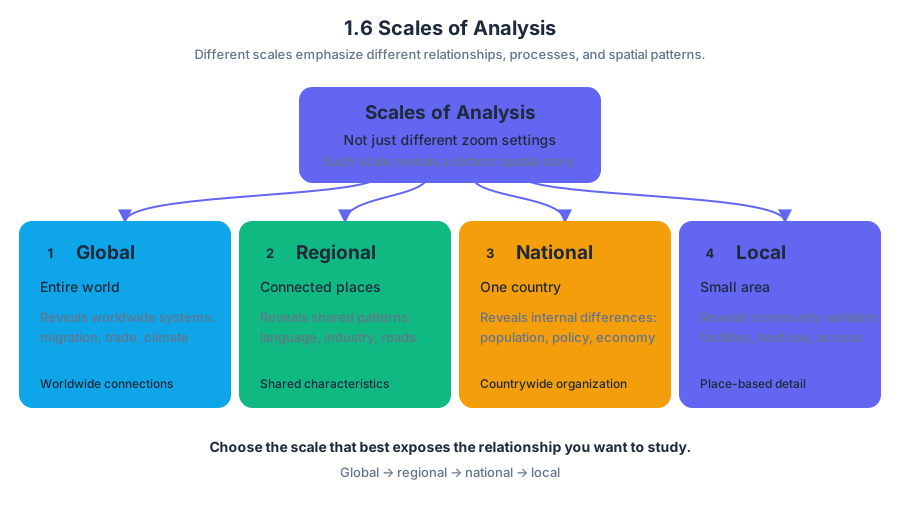
EK PSO-1.C.1: Scales of analysis include global, regional, national, and local. These scales are not merely different zoom settings; each emphasizes different relationships, processes, and spatial patterns.
| Scale | Geographic focus | Patterns it can reveal |
|---|---|---|
| Global | The entire world or worldwide systems | Global migration flows, international trade, climate patterns |
| Regional | A group of places sharing a connection or characteristic | Industrial specialization, language patterns, or regional infrastructure |
| National | A single country and its internal organization | National population distribution, state policies, or countrywide economic differences |
| Local | A city, neighborhood, campus, or small area | Specific facilities, land uses, accessibility, and community-level variation |
The word regional does not automatically mean “small,” and national does not automatically mean “more accurate.” The appropriate scale depends on the question. A global map is useful for comparing continents, but it cannot explain why one neighborhood has better access to public transportation than another.
What changing scale reveals—and conceals
LO PSO-1.C: Define scales of analysis used by geographers.
LO PSO-1.D: Explain what scales of analysis reveal.
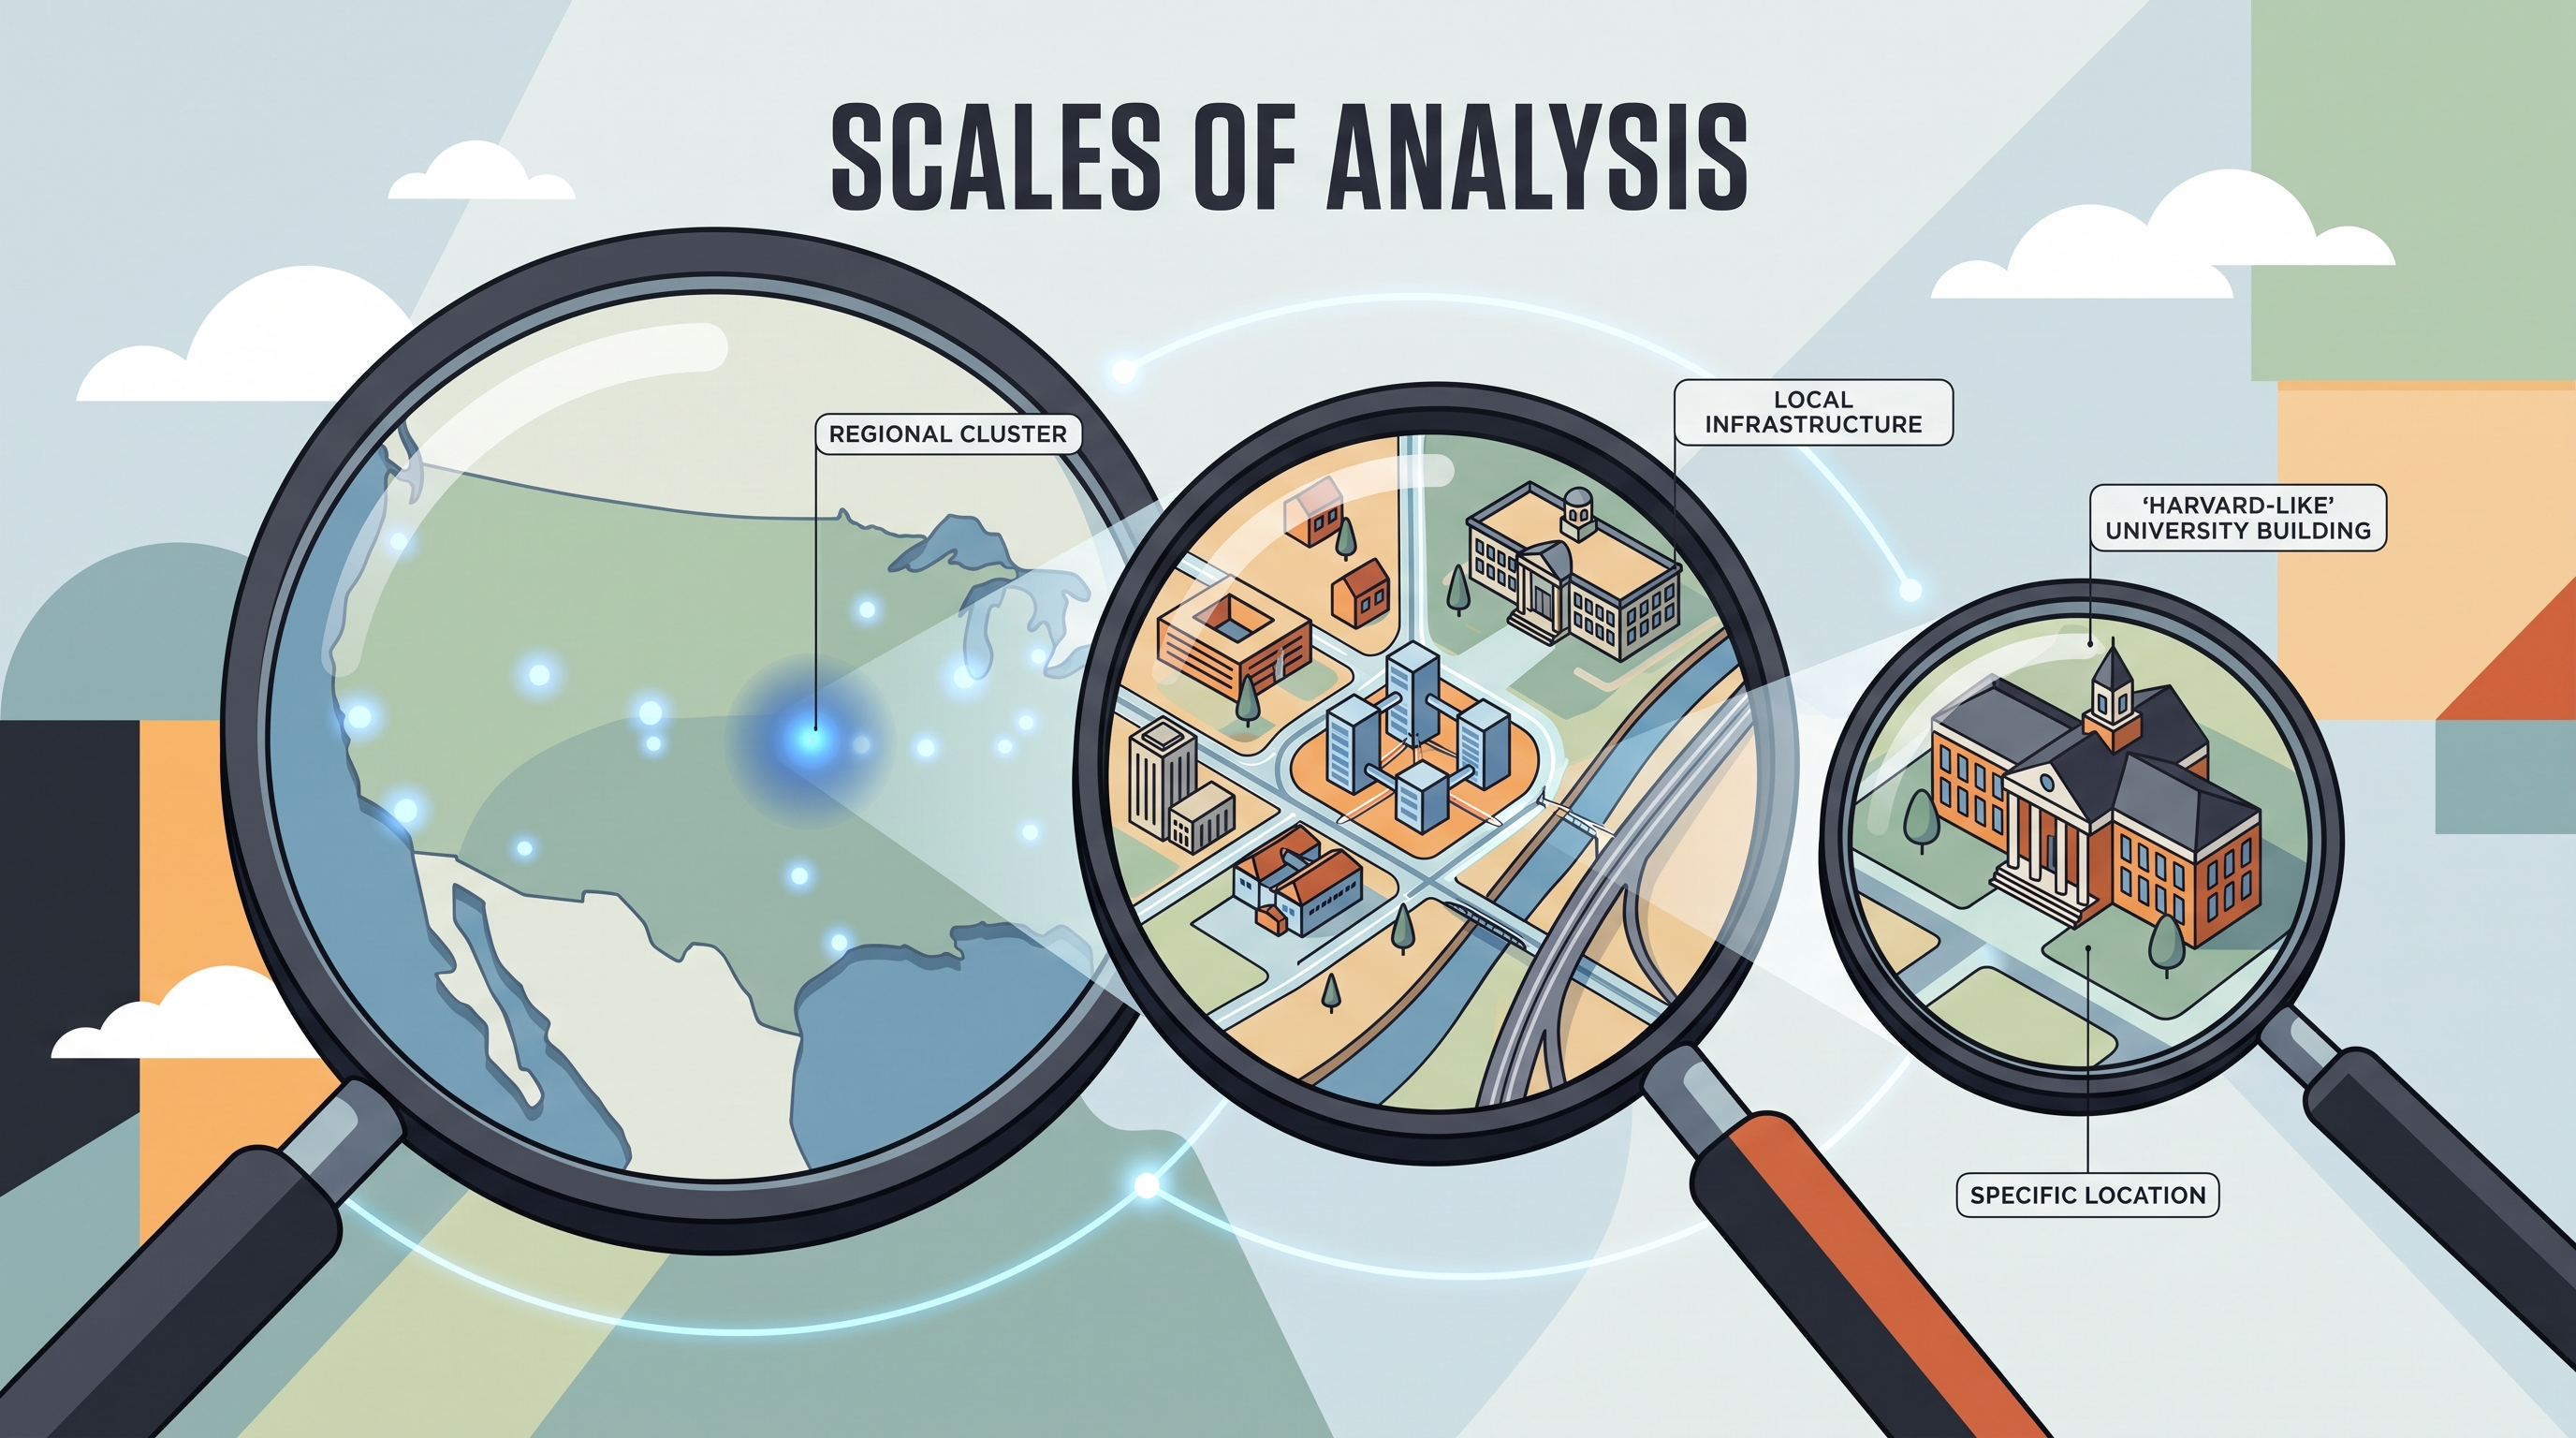
EK PSO-1.D.1: Patterns and processes at different scales reveal variations in, and different interpretations of, data. At a broad national scale, a map may show the location of an entire city, but it may conceal the agglomerations and specific infrastructure within that city. An agglomeration is a concentration of related activities or facilities in one place.
Consider the Boston area:
- A national-scale map of the United States might identify Boston as a major city.
- A regional-scale map of eastern Massachusetts could show Cambridge, university districts, transportation routes, and clusters of research institutions.
- A local-scale map could identify the precise location of Harvard University, individual streets, or nearby land uses.
The information has not necessarily become “better” as the scale changes; it has become more appropriate for a different question. A national map supports a claim about Boston’s position within the United States. It cannot, by itself, support a claim about the location of Harvard University or the distribution of research infrastructure inside the Boston region.
Scale and spatial relationships
Geographers use scale to analyze relationships among and between places. For example, a local concentration of technology firms may be connected to regional universities, national investment policies, and global networks of finance and information. Each scale contributes evidence, but no single scale explains the complete pattern.
This is why geographic conclusions must match the scale of the evidence. A regional map may show that one region specializes in a particular type of production, but it cannot automatically justify a conclusion about every region in the country. Other regions may have different economic sectors, infrastructure, or environmental conditions.
Scale-transfer warning: Using evidence from one scale to make a claim about another scale can produce an inaccurate conclusion or an ecological fallacy—the error of assuming that a pattern for a group applies equally to every smaller place within it.
Supranational organizations and sovereignty
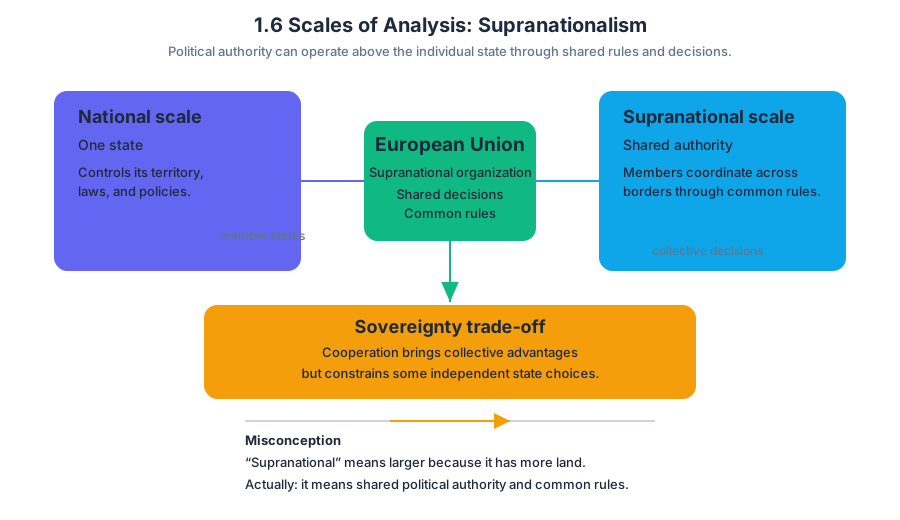
Scale also applies to political decision-making. A supranational organization is an organization in which member states cooperate through shared decision-making and common rules. This creates a level of governance above the individual state.
The European Union illustrates this relationship. Member states remain states, but membership can constrain their independent choices in areas such as trade and governance. Common rules may coordinate markets, regulate economic activity, or establish shared policies. In exchange for cooperation and collective advantages, each member gives up some degree of individual state sovereignty, meaning the state’s authority to control its internal affairs and external relations independently.
Supranationalism therefore creates a tension between two geographic scales:
- National scale: A state seeks authority over its own territory, laws, and policies.
- Supranational scale: Member states share authority to address challenges and coordinate rules across borders.
Named misconception — “Supranational” means larger because it has more land.
The term refers to shared political authority, not physical size. A supranational organization constrains member states because decisions are made collectively and common rules apply across participating countries.
Worked interpretation
Suppose a map at the regional scale shows high concentrations of technology employment around Boston and Cambridge. A strong interpretation would describe the visible regional pattern and connect it to local universities, transportation, and research infrastructure. A weak interpretation would claim that all of the United States has the same concentration simply because the regional map shows one important technology cluster.
Retrieval check: A national-scale map shows Boston but not Harvard University. Which scale would better reveal Harvard’s precise location and its relationship to nearby infrastructure? Why would it be risky to use that regional or local evidence to describe every city in the United States?
1.7 Regional Analysis
Key concepts: Regional analysis · Types of boundaries · Site characteristics · Spatial distribution of political power · Ethnic residential patterns · Regional scale and map limitations · Territoriality and devolution · Climate-based crop specialization and regional interdependence · Spatial concentration of economic activities · Linear and regional concentration
A region is an area grouped together because its places share a characteristic, function, or perceived identity. Regional analysis turns a complicated map into a meaningful pattern: instead of asking only where is something?, geographers ask which places belong together, why, and at what scale does that grouping…
1.7 Regional Analysis
A region is an area grouped together because its places share a characteristic, function, or perceived identity. Regional analysis turns a complicated map into a meaningful pattern: instead of asking only where is something?, geographers ask which places belong together, why, and at what scale does that grouping make sense?
CED alignment: Topic 1.7 Regional Analysis; Learning Objective 1.7; Essential Knowledge 1.7.A, 1.7.A.1, 1.7.A.2, and 1.7.A.3. The topic develops Skill Category 1: Concepts and Processes (1.A Identify geographic concepts, 1.B Explain geographic concepts), Skill Category 2: Spatial Relationships (2.A Describe spatial patterns, 2.B Explain spatial relationships), and Skill Category 5: Scale Analysis (5.A Identify the scales of analysis, 5.B Explain how scale of analysis affects geographic information).
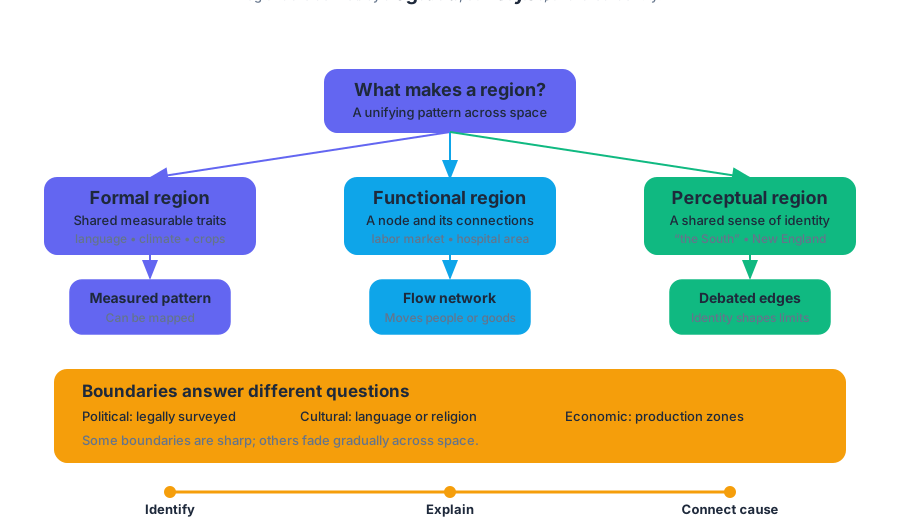
What makes a region?
A formal region has one or more measurable characteristics shared across its territory, such as a language, climate, crop, political system, or level of economic development. A functional region is organized around a central node and the connections flowing to or from it, such as a metropolitan labor market, a hospital service area, or a transportation network. A perceptual region exists because people believe an area has a shared identity, even when its boundaries are debated—for example, “the South” or “New England.”
Boundaries help show where a region begins and ends, but different boundaries answer different questions. A political boundary may be legally surveyed; a cultural boundary may mark a transition between languages or religions; an economic boundary may separate production zones. Some boundaries are sharp, while others fade gradually across space.
Skill move — identify, then explain: First identify the regional pattern visible on a map. Then explain the unifying characteristic or relationship that creates it. “The points cluster near the coast” describes a pattern; “the coast attracts port industries because of transportation access” explains the spatial relationship.
Site characteristics and political power
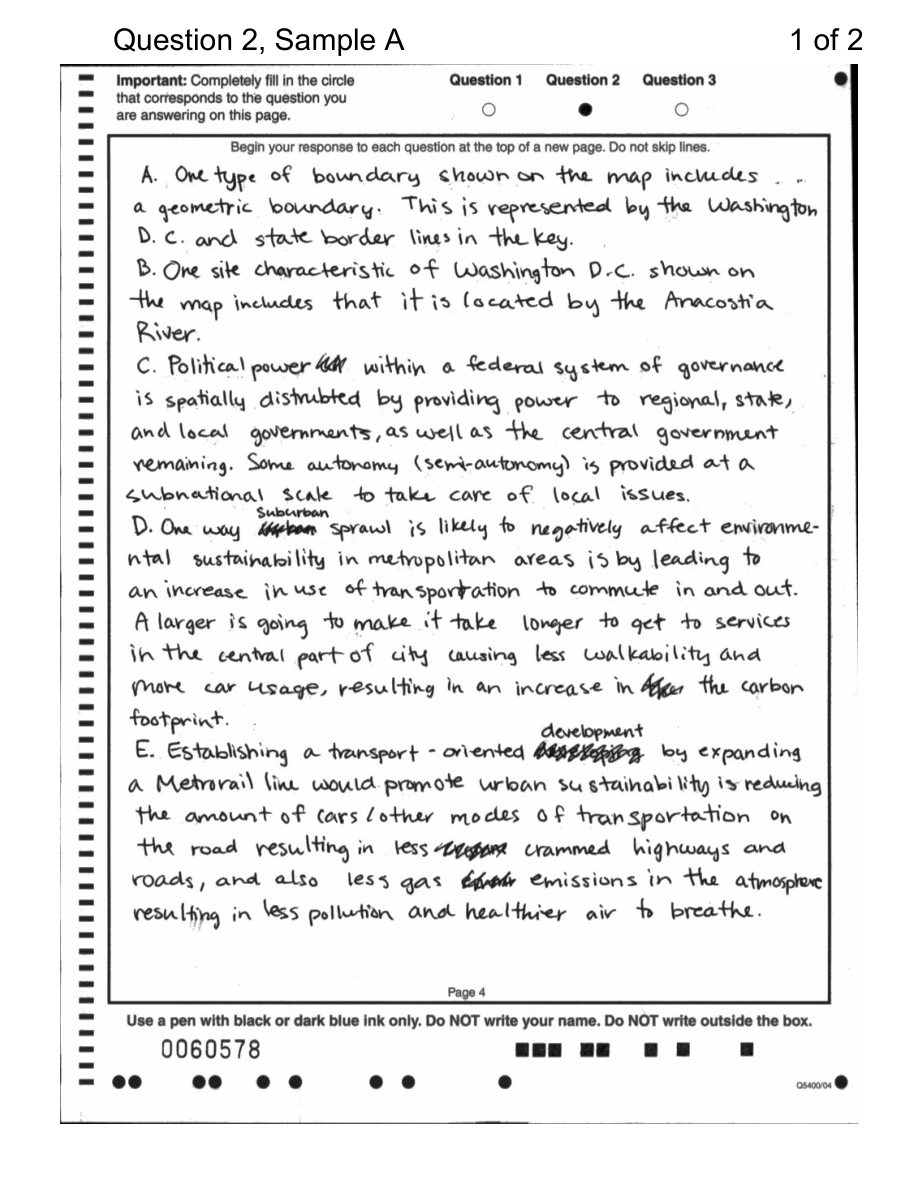
A place’s site characteristics are its physical and built features at a specific location: terrain, waterways, climate, transportation access, infrastructure, and existing structures. Washington, D.C., illustrates how site can support political importance. It occupies a planned federal district along the Potomac River, positioned between historically powerful regions and designed to serve as the national capital rather than as part of a state.
Washington, D.C., also reveals the spatial distribution of political power. In the U.S. federal system, authority is divided between the national government and state governments, but the capital concentrates national institutions—the White House, Congress, Supreme Court, and executive agencies—in one place. Political decisions made there affect the entire country, so a relatively small area exercises influence at a national scale.
Key insight: The size of a region does not determine its political importance. A small capital district can function as the command center of a much larger political territory.
Ethnic residential patterns
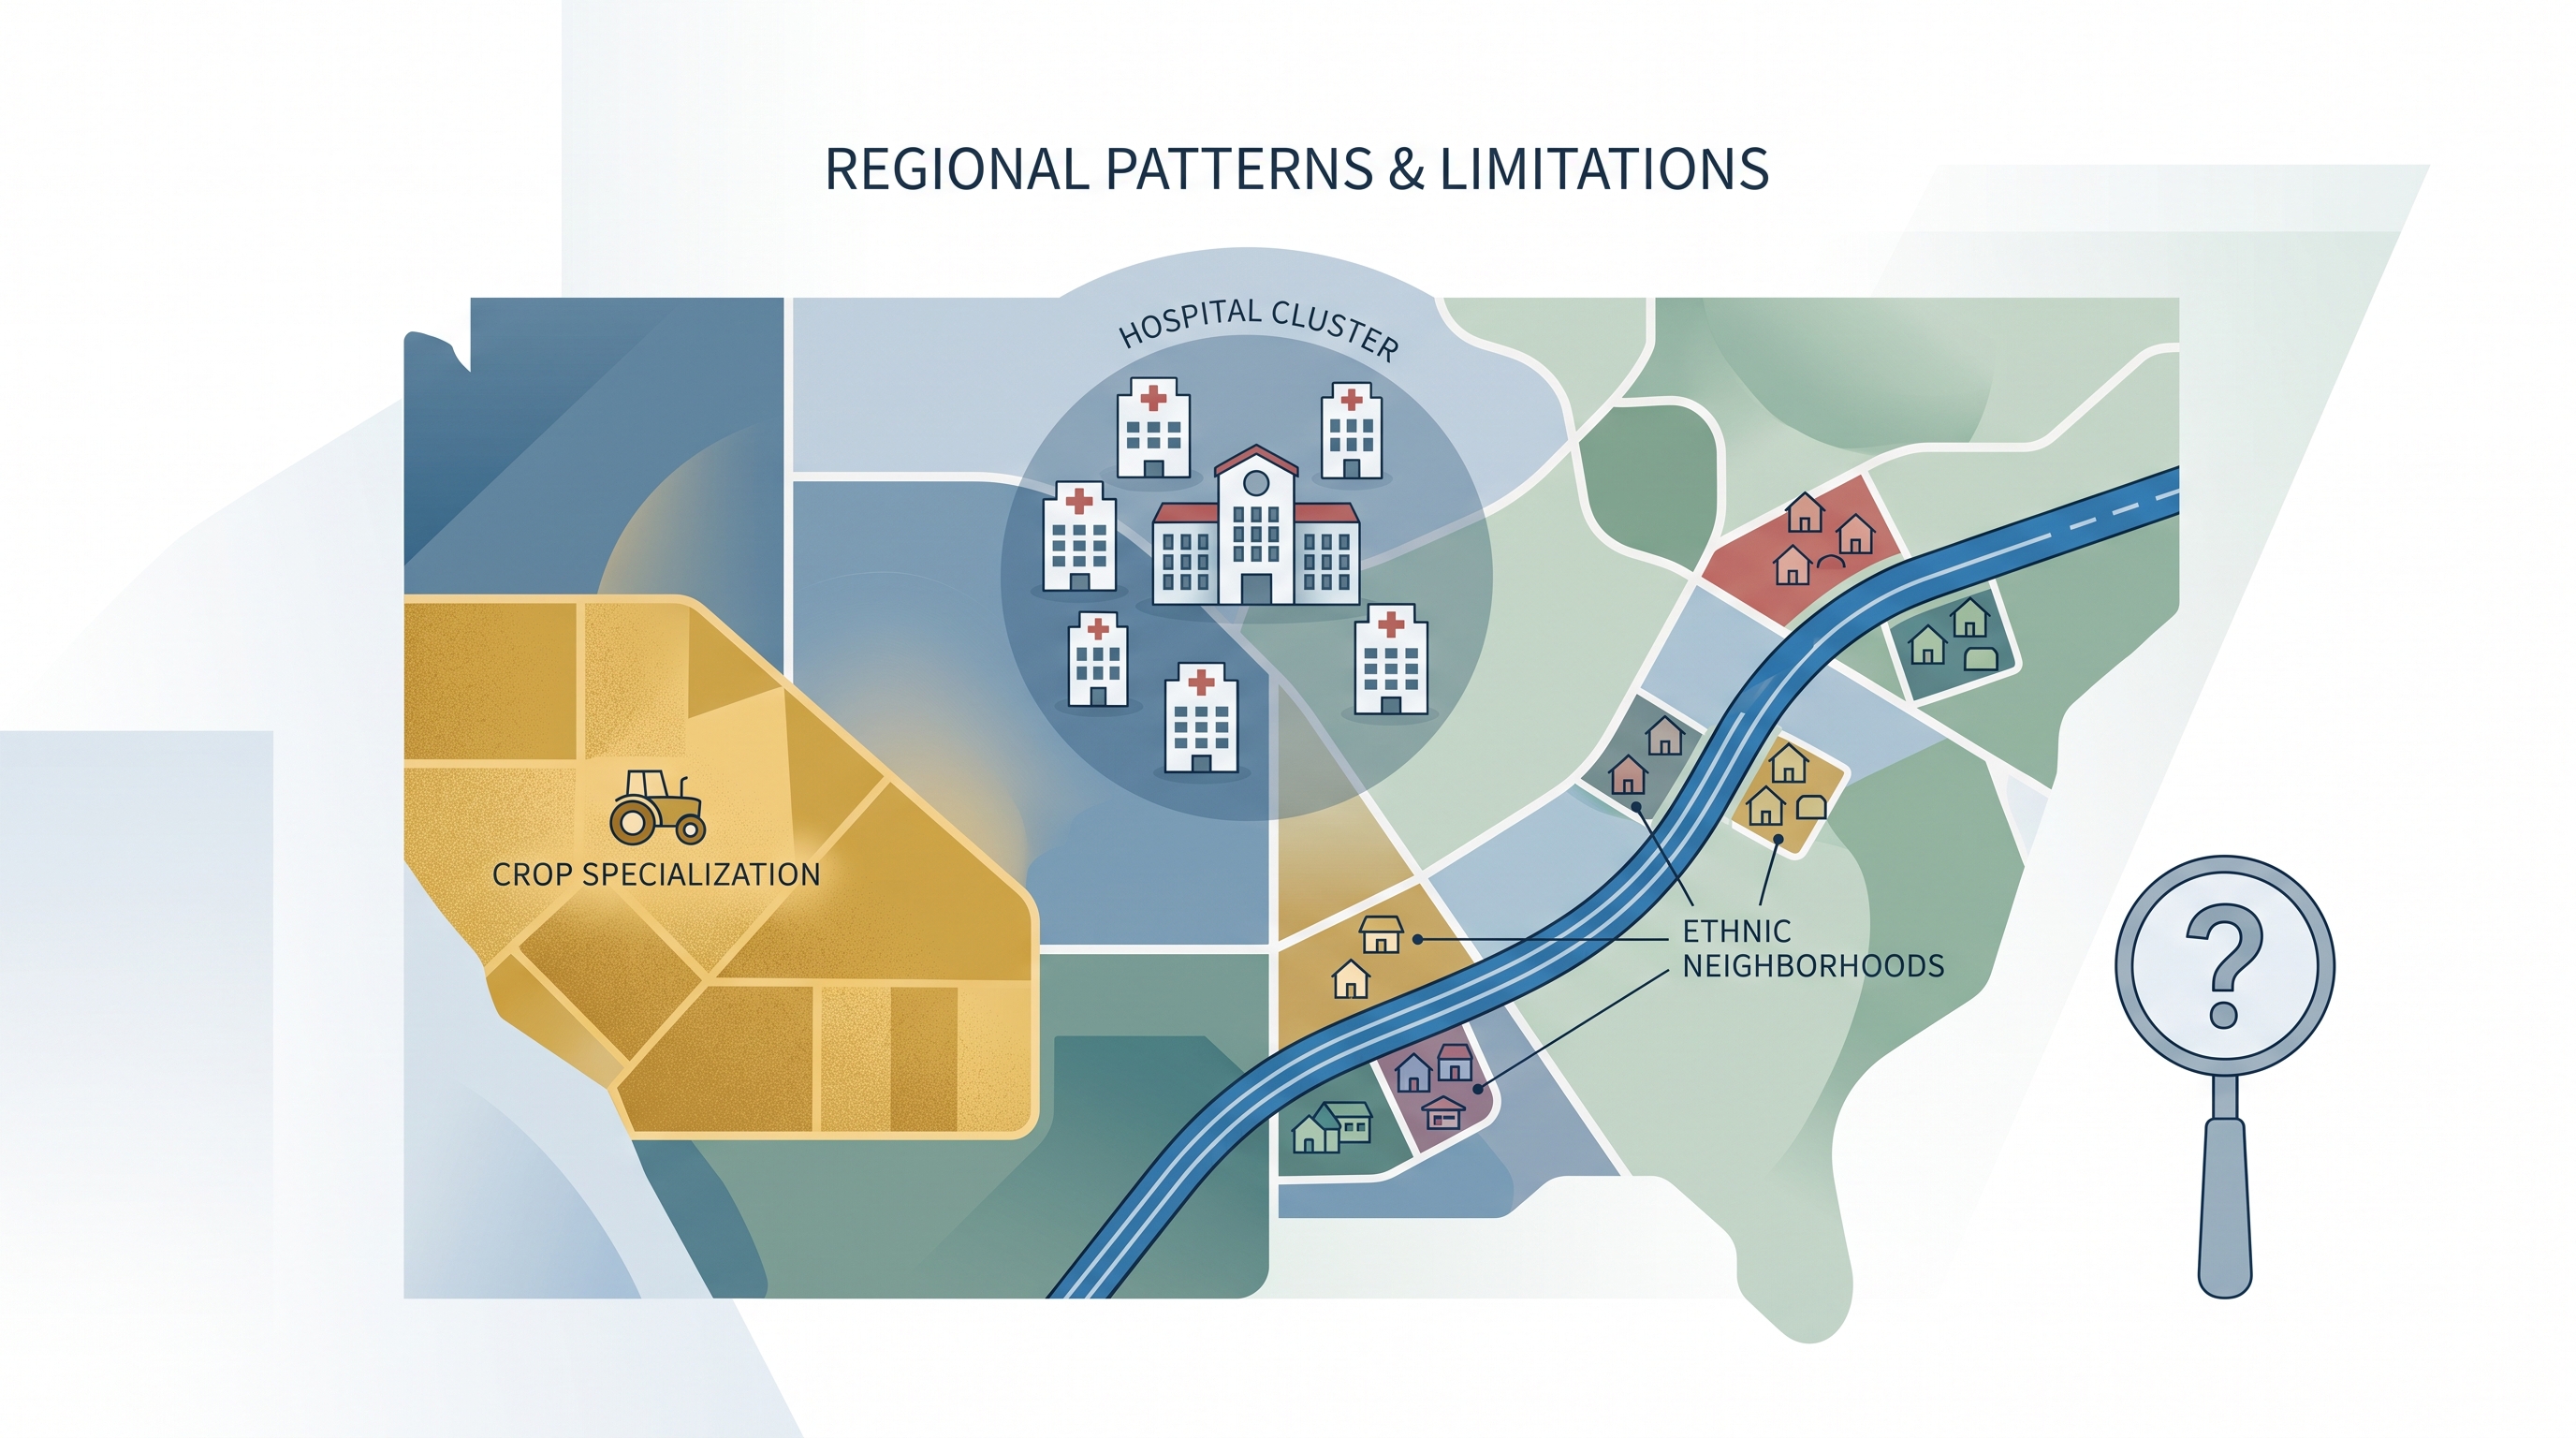
Ethnic neighborhoods are regional patterns produced by migration, family networks, housing access, employment, cultural institutions, and sometimes discrimination. In a metropolitan area, a neighborhood where Chinese Americans and Korean Americans reside together would be an example of overlapping ethnic residential patterns. The pattern may be clustered rather than uniformly distributed: several neighborhoods may contain concentrations, while nearby areas contain fewer residents.
On a regional map, Chinese American neighborhoods might appear concentrated in selected parts of a metropolitan area, connected by transportation routes, or distributed in several clusters rather than forming one continuous zone. A strong description names the pattern—such as clustering, linear concentration, or dispersed concentration—and supports it with locations shown on the map.
Misconception check — “one neighborhood equals one culture”: An ethnic neighborhood does not imply that every resident shares the same ancestry or that the group lives only there. Regional maps show concentration, not exclusivity.
Scale limitations and territoriality
A conclusion drawn from a regional-scale map may not apply to smaller scales or to individual locations within the region. If a region appears economically specialized in technology, that does not mean every city, firm, or worker inside it works in technology. Applying a regional average to individuals can create an ecological fallacy—an inaccurate assumption that a group-level pattern describes every member.
Territoriality is the connection people develop between a group and its land. When a cultural or national group believes that its territory deserves greater political control, territoriality can contribute to devolution, the transfer of power from a central government to a regional government. Scotland’s proposed independence from the United Kingdom illustrates how a distinct national identity, historical territory, and desire for self-government can challenge an existing state structure.
Economic concentration and interdependence
Economic regions can be recognized through concentration, the grouping of similar economic activities. Agglomeration and clustering describe firms or related activities locating near one another to share labor, suppliers, infrastructure, information, and markets. Linear concentration occurs along transportation routes such as rivers or major roads, while regional concentration occurs within a particular metropolitan area, such as specialized activities concentrated in Massachusetts.
Climate-based crop specialization can create comparative or commodity advantages. One region may efficiently produce a crop suited to its climate, while another specializes in a different crop or manufactured good. Trade then creates regional interdependence: each region relies on the other for goods it does not produce as efficiently.
Information technology strengthens these connections by allowing firms, institutions, and workers to communicate, coordinate, analyze data, and provide services across distance. The result can be greater productivity, efficiency, and cost-effectiveness—but technology does not erase geography; infrastructure, skilled labor, markets, and reliable connectivity remain unevenly distributed.
Retrieval check
A map shows a dense cluster of hospitals around one university, crop specialization in a dry western region, and several ethnic neighborhoods along a major highway. Identify the regional concept represented by each pattern, then state one limitation of using the regional map to describe every individual location within it.
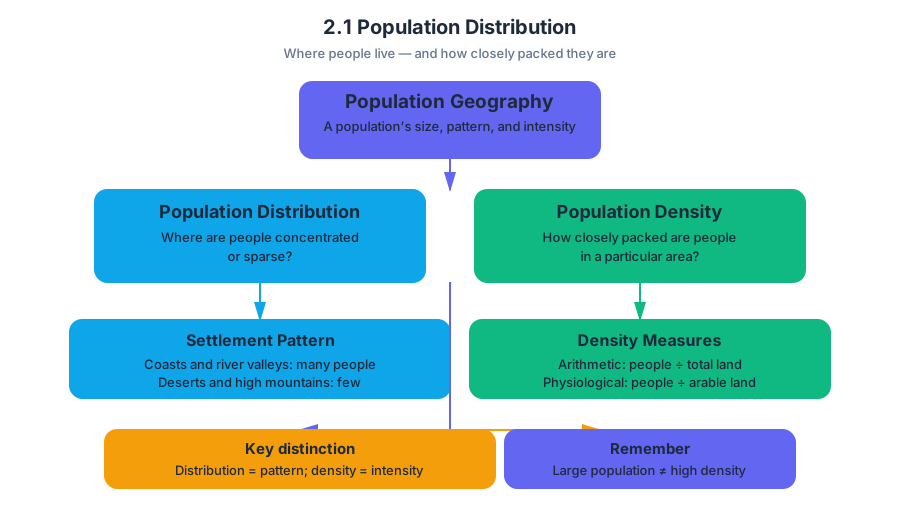
2.1 Population Distribution
Key concepts: Population distribution · Population density · Societal effects of population distribution and density · Environmental effects of population distribution and density · Global cultural patterns · Global political patterns · Global economic patterns · AP Human Geography learning objectives · Chief Reader Report on Student Responses · AP Human Geography Set 1 (2025)
Population distribution is uneven because people choose, or are compelled, to live where environmental conditions, economic opportunities, transportation, political stability, and historical settlement patterns make life more feasible.
2.1 Population Distribution
Population distribution is uneven because people choose, or are compelled, to live where environmental conditions, economic opportunities, transportation, political stability, and historical settlement patterns make life more feasible. A map of population is therefore more than a map of where people are: it helps explain where cultures develop, governments concentrate services, businesses invest, and environmental pressures intensify.
Population distribution is the arrangement of people across Earth’s surface. Population density is the number of people living in a given unit of area, commonly expressed as people per square kilometer or people per square mile.
Distribution and density: two different questions
Distribution asks, “Where are people located?” Density asks, “How closely packed are they there?” A country can have a large population but low overall density if its people are spread across a large territory. Conversely, a small city can have extremely high density even though its total population is much smaller.
| Concept | Question it answers | Example |
|---|---|---|
| Population distribution | Where are people concentrated or sparse? | Many people live along coastlines and river valleys, while few live in deserts or high mountains. |
| Population density | How many people occupy a particular area? | A crowded urban district has high density; a sparsely settled rural region has low density. |
| Arithmetic density | What is the average number of people per unit of total land area? | Total population divided by total land area. |
| Physiological density | How many people depend on each unit of arable land? | A useful indicator of pressure on farmland and food-producing capacity. |
Common misconception — “distribution and density mean the same thing.” They do not. Distribution describes the pattern of settlement; density measures its intensity. Two regions may have similar population totals but very different densities if one is much larger, or if one concentrates its residents in a few urban centers.
Why people cluster
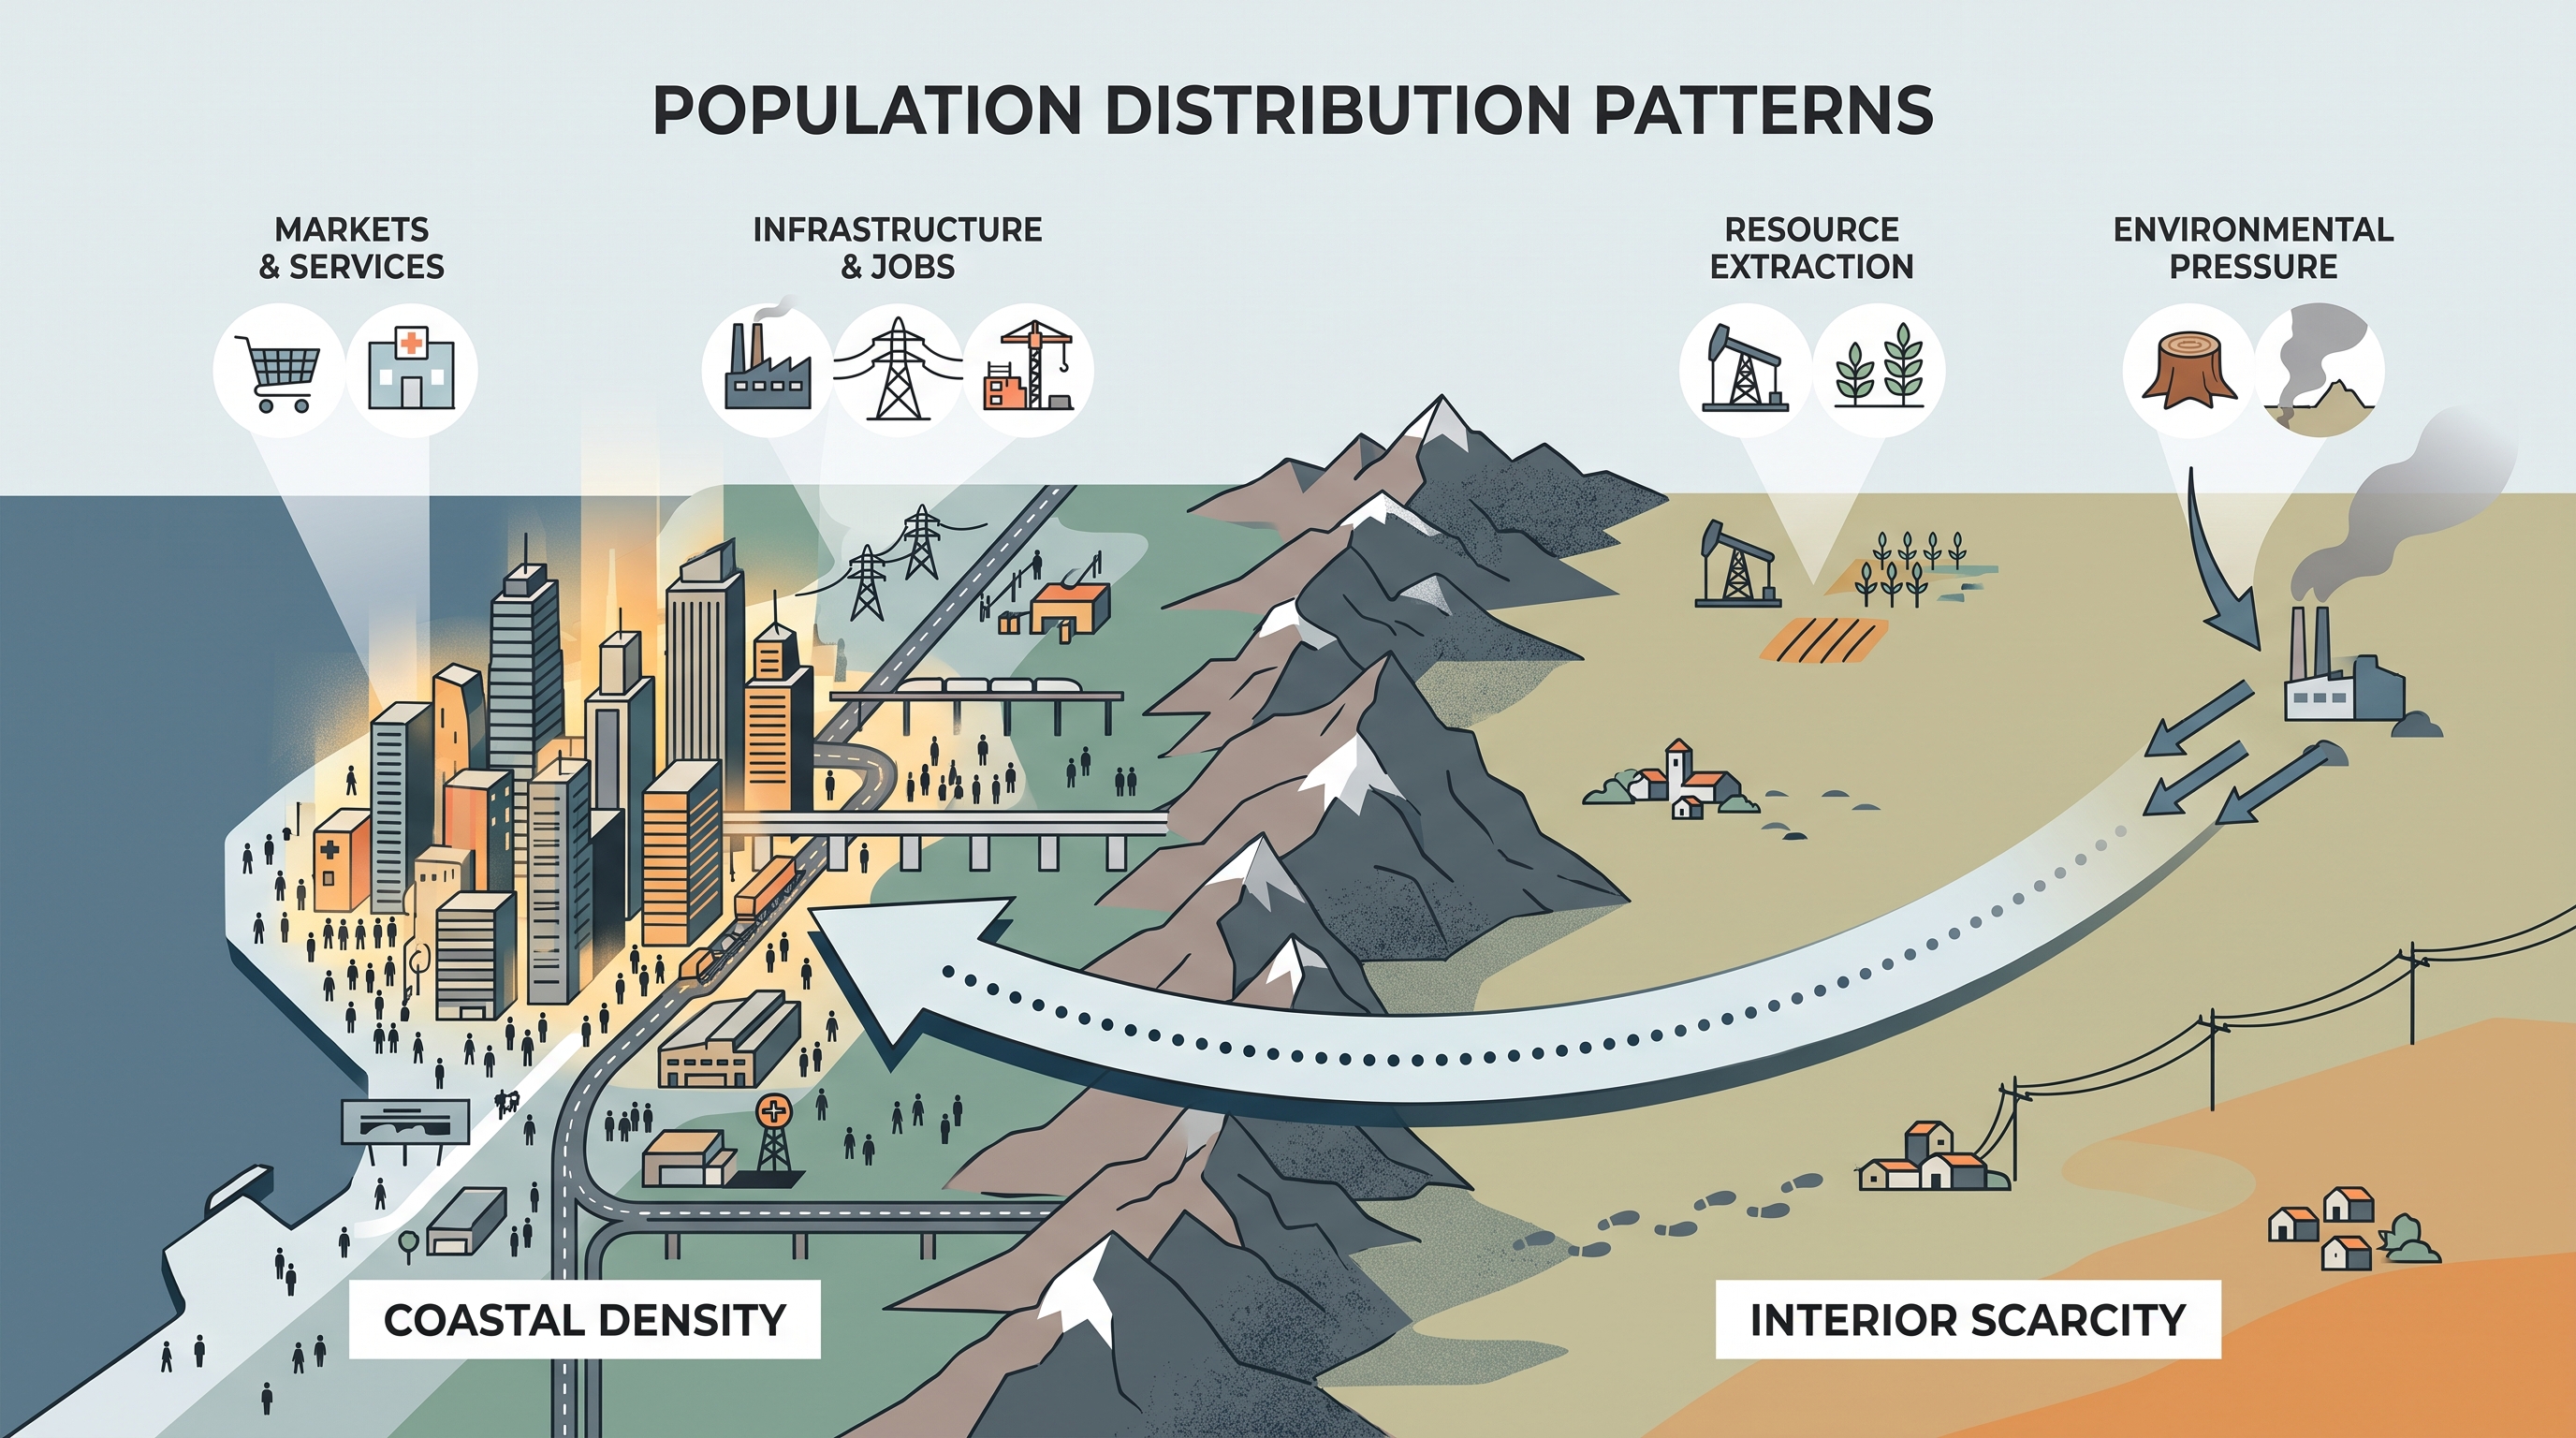
Population clusters often form near coasts, navigable rivers, fertile plains, transportation corridors, and established cities. These locations can combine access to water, food, trade, employment, infrastructure, and political institutions. Physical geography matters, but it does not determine settlement by itself: technology, economic systems, historical migration, and government decisions can make otherwise difficult environments habitable.
A useful geographic explanation connects location to process:
$$ \text{favorable site} \rightarrow \text{settlement} \rightarrow \text{infrastructure and jobs} \rightarrow \text{further population concentration} $$
This feedback loop explains why major population concentrations frequently become even larger. A port attracts factories and warehouses; those industries attract workers; workers support shops, schools, and services; improved infrastructure then attracts additional firms and migrants.
Effects on society and the environment
Under PSO-2.D, the required relationship is that population distribution and density affect society and the environment. The essential knowledge is PSO-2.D.1, which states that population distribution and density affect political, economic, and social processes, including the provision of services such as medical care.
High-density areas can support specialized hospitals, public transit, universities, and large markets because many people live close enough to use them. They can also create congestion, housing shortages, unequal access, and intense competition for land. Low-density areas may have more open space but face higher per-person costs for roads, schools, electricity, emergency response, and health care.
Population patterns also shape global economic patterns. Labor, consumers, ports, financial institutions, and transportation networks cluster in major urban and coastal regions. For example, a densely settled coastal metropolitan region may combine a large workforce, nearby consumers, container terminals, airports, and connections to global supply chains. Investment follows these advantages, reinforcing the concentration of manufacturing, services, trade, and capital.
Worked example: A company comparing an inland rural location with a large coastal city considers more than land price. The city may offer a deeper labor pool, suppliers, consumer markets, port access, and established digital and transportation infrastructure. The rural site may have cheaper land and lower congestion, but the company may face greater shipping distances and difficulty recruiting specialized workers. Population concentration therefore influences the geography of production, trade, and investment at a global scale.
The environmental relationship is expressed in PSO-2.D.2: population distribution and density affect the environment and natural resources; this is known as carrying capacity. Carrying capacity is the level of population that an environment can support over time with available technology, resources, and management practices.
High density does not automatically mean environmental destruction. Compact settlement can reduce travel distances and make public transit, shared infrastructure, and efficient utility systems practical. However, dense populations can also increase demand for water, energy, food, land, and waste disposal, producing pollution or resource depletion when demand exceeds local capacity.
Common misconception — “carrying capacity is a fixed population limit.” Carrying capacity changes with technology, consumption patterns, infrastructure, and resource management. A city may expand its effective water supply through conservation or imports, while drought, pollution, or climate change may reduce the population its local environment can support.
Cultural and political patterns
Where people live helps produce global cultural patterns. Dense cities bring together languages, religions, cuisines, media, and cultural practices from many regions. Coastal trade routes and migration corridors can spread cultural traits across continents, while isolated or sparsely populated areas may preserve distinctive local patterns.
Population distribution also influences global political patterns. Governments tend to prioritize densely populated regions because these areas contain large electorates, economic assets, and strategically important infrastructure. Population concentrations can strengthen urban political influence, shape the placement of administrative centers, and create disputes over representation, resource allocation, and service provision.
The paired AP skill is Skill 2.A: Describe spatial patterns, networks, and relationships. A strong response does not merely identify a cluster. It describes the pattern precisely—such as concentration along coasts or rivers—and then explains a relationship, such as how that concentration supports trade while increasing pressure on water and land.
Retrieval check
A region contains a densely populated coastal city and a sparsely populated interior plateau. Identify one distributional pattern, distinguish density from distribution, and explain one economic effect and one environmental effect of the pattern. A complete answer should name the spatial relationship and connect each effect to population concentration, resources, services, labor, markets, or infrastructure.
2.2 Consequences of Population Distribution
Key concepts: Population distribution and its consequences · Mortality, fertility, and migration · Environmental, economic, cultural, and political influences on population change · Malthusian theory and critiques · Agricultural practices and their environmental and social impacts · Challenges of feeding a growing population · Green Revolution technologies and agricultural surplus · Core-periphery patterns in bilingual populations · Medical care and death rates · Pronatalist and antinatalist population policies
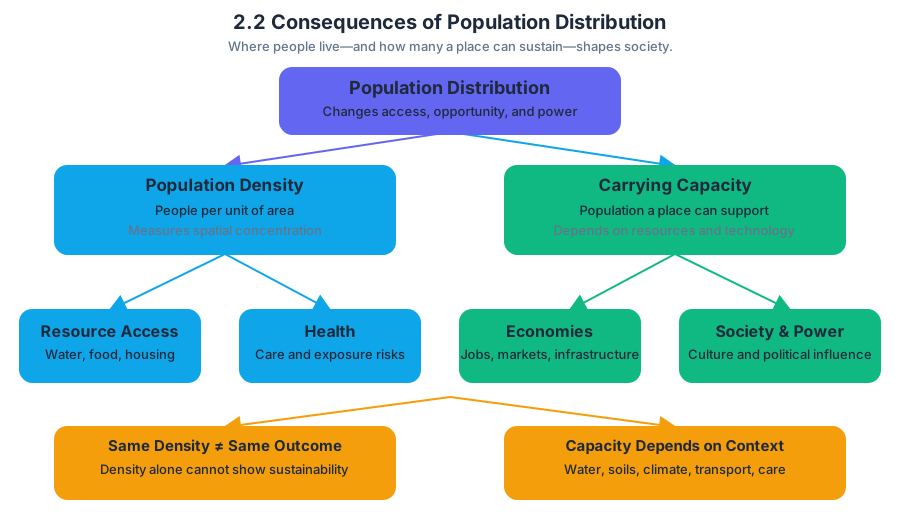
Population distribution changes society because the number of people a place can support—and the way those people are arranged—affects resources, health, economies, culture, and political power.
2.2 Consequences of Population Distribution
Population distribution changes society because the number of people a place can support—and the way those people are arranged—affects resources, health, economies, culture, and political power. Carrying capacity is the population size that a particular place can support with its available resources and technology.
Carrying capacity is not population density. Density measures how many people occupy a unit of area; carrying capacity asks whether the environment and human systems can sustain that population.
The same population density can produce very different outcomes. A densely settled region with reliable water, productive farmland, advanced infrastructure, and accessible medical care may support more people than a sparsely settled region with poor soils, limited transportation, or extreme climate.
Population change: three demographic forces
Population change results from mortality, fertility, and migration. Mortality is the occurrence of death; fertility refers to childbearing, especially the number of births in a population; migration is the movement of people from one place to another. Together, these processes determine whether a population grows, declines, or changes its spatial distribution.
$$ \text{Population change} = \text{births} - \text{deaths} + \text{immigration} - \text{emigration} $$
These forces respond to interacting environmental, economic, cultural, and political factors. Drought may reduce food supplies and encourage migration. Higher wages in a city may attract workers. Cultural expectations about family size may influence fertility. Government policy may encourage births, restrict them, or improve access to medical care, thereby reducing death rates.
| Force | Influences | Possible consequence |
|---|---|---|
| Mortality | Medical care, sanitation, nutrition, disease, conflict | Population decline or longer life expectancy |
| Fertility | Education, employment, contraception, cultural values, policy | Youthful or aging population |
| Migration | Jobs, safety, environmental conditions, family networks, political borders | Redistribution of population |
Worked example: Suppose a rural region experiences repeated droughts, falling farm income, and limited clinics. Mortality may rise if disease and malnutrition increase; fertility may decline as households face economic uncertainty; and working-age adults may migrate to cities. The region can therefore lose population through all three mechanisms at once, while the destination city gains workers and faces increased demand for housing, schools, transportation, and medical services.
Malthusian theory and its critiques
Under Malthusian theory, population tends to grow faster than food production. Thomas Malthus argued that unchecked population growth could create shortages, leading to “positive checks” such as famine, disease, and war, or “preventive checks” such as delayed marriage and lower fertility.
Malthusian theory remains useful as a warning about limits, but critics argue that it underestimates human innovation and the importance of distribution. New seeds, irrigation, fertilizers, mechanization, and improved transportation can increase food production. Hunger may also result from poverty, conflict, waste, or unequal access rather than from a global absence of food.
Named misconception: “More people automatically cause famine.” Population pressure can strain carrying capacity, but famine is not determined by population size alone. Technology, markets, political decisions, environmental conditions, and access to food all matter.
Agriculture, technology, and environmental consequences
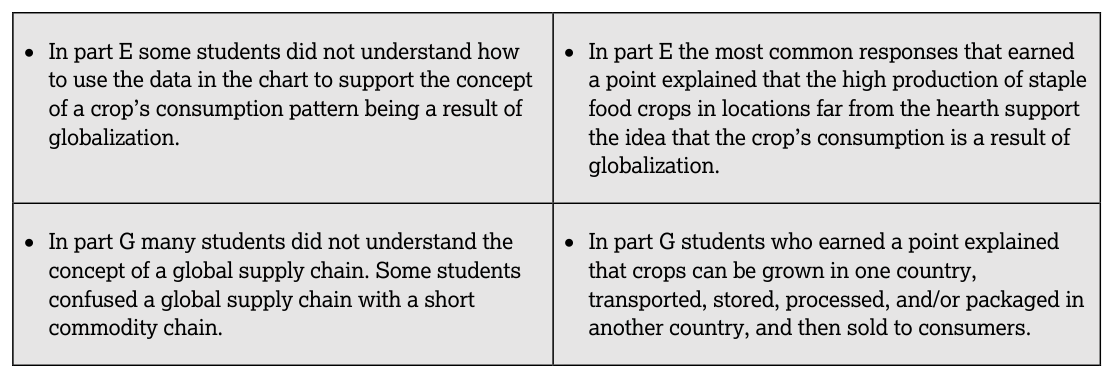
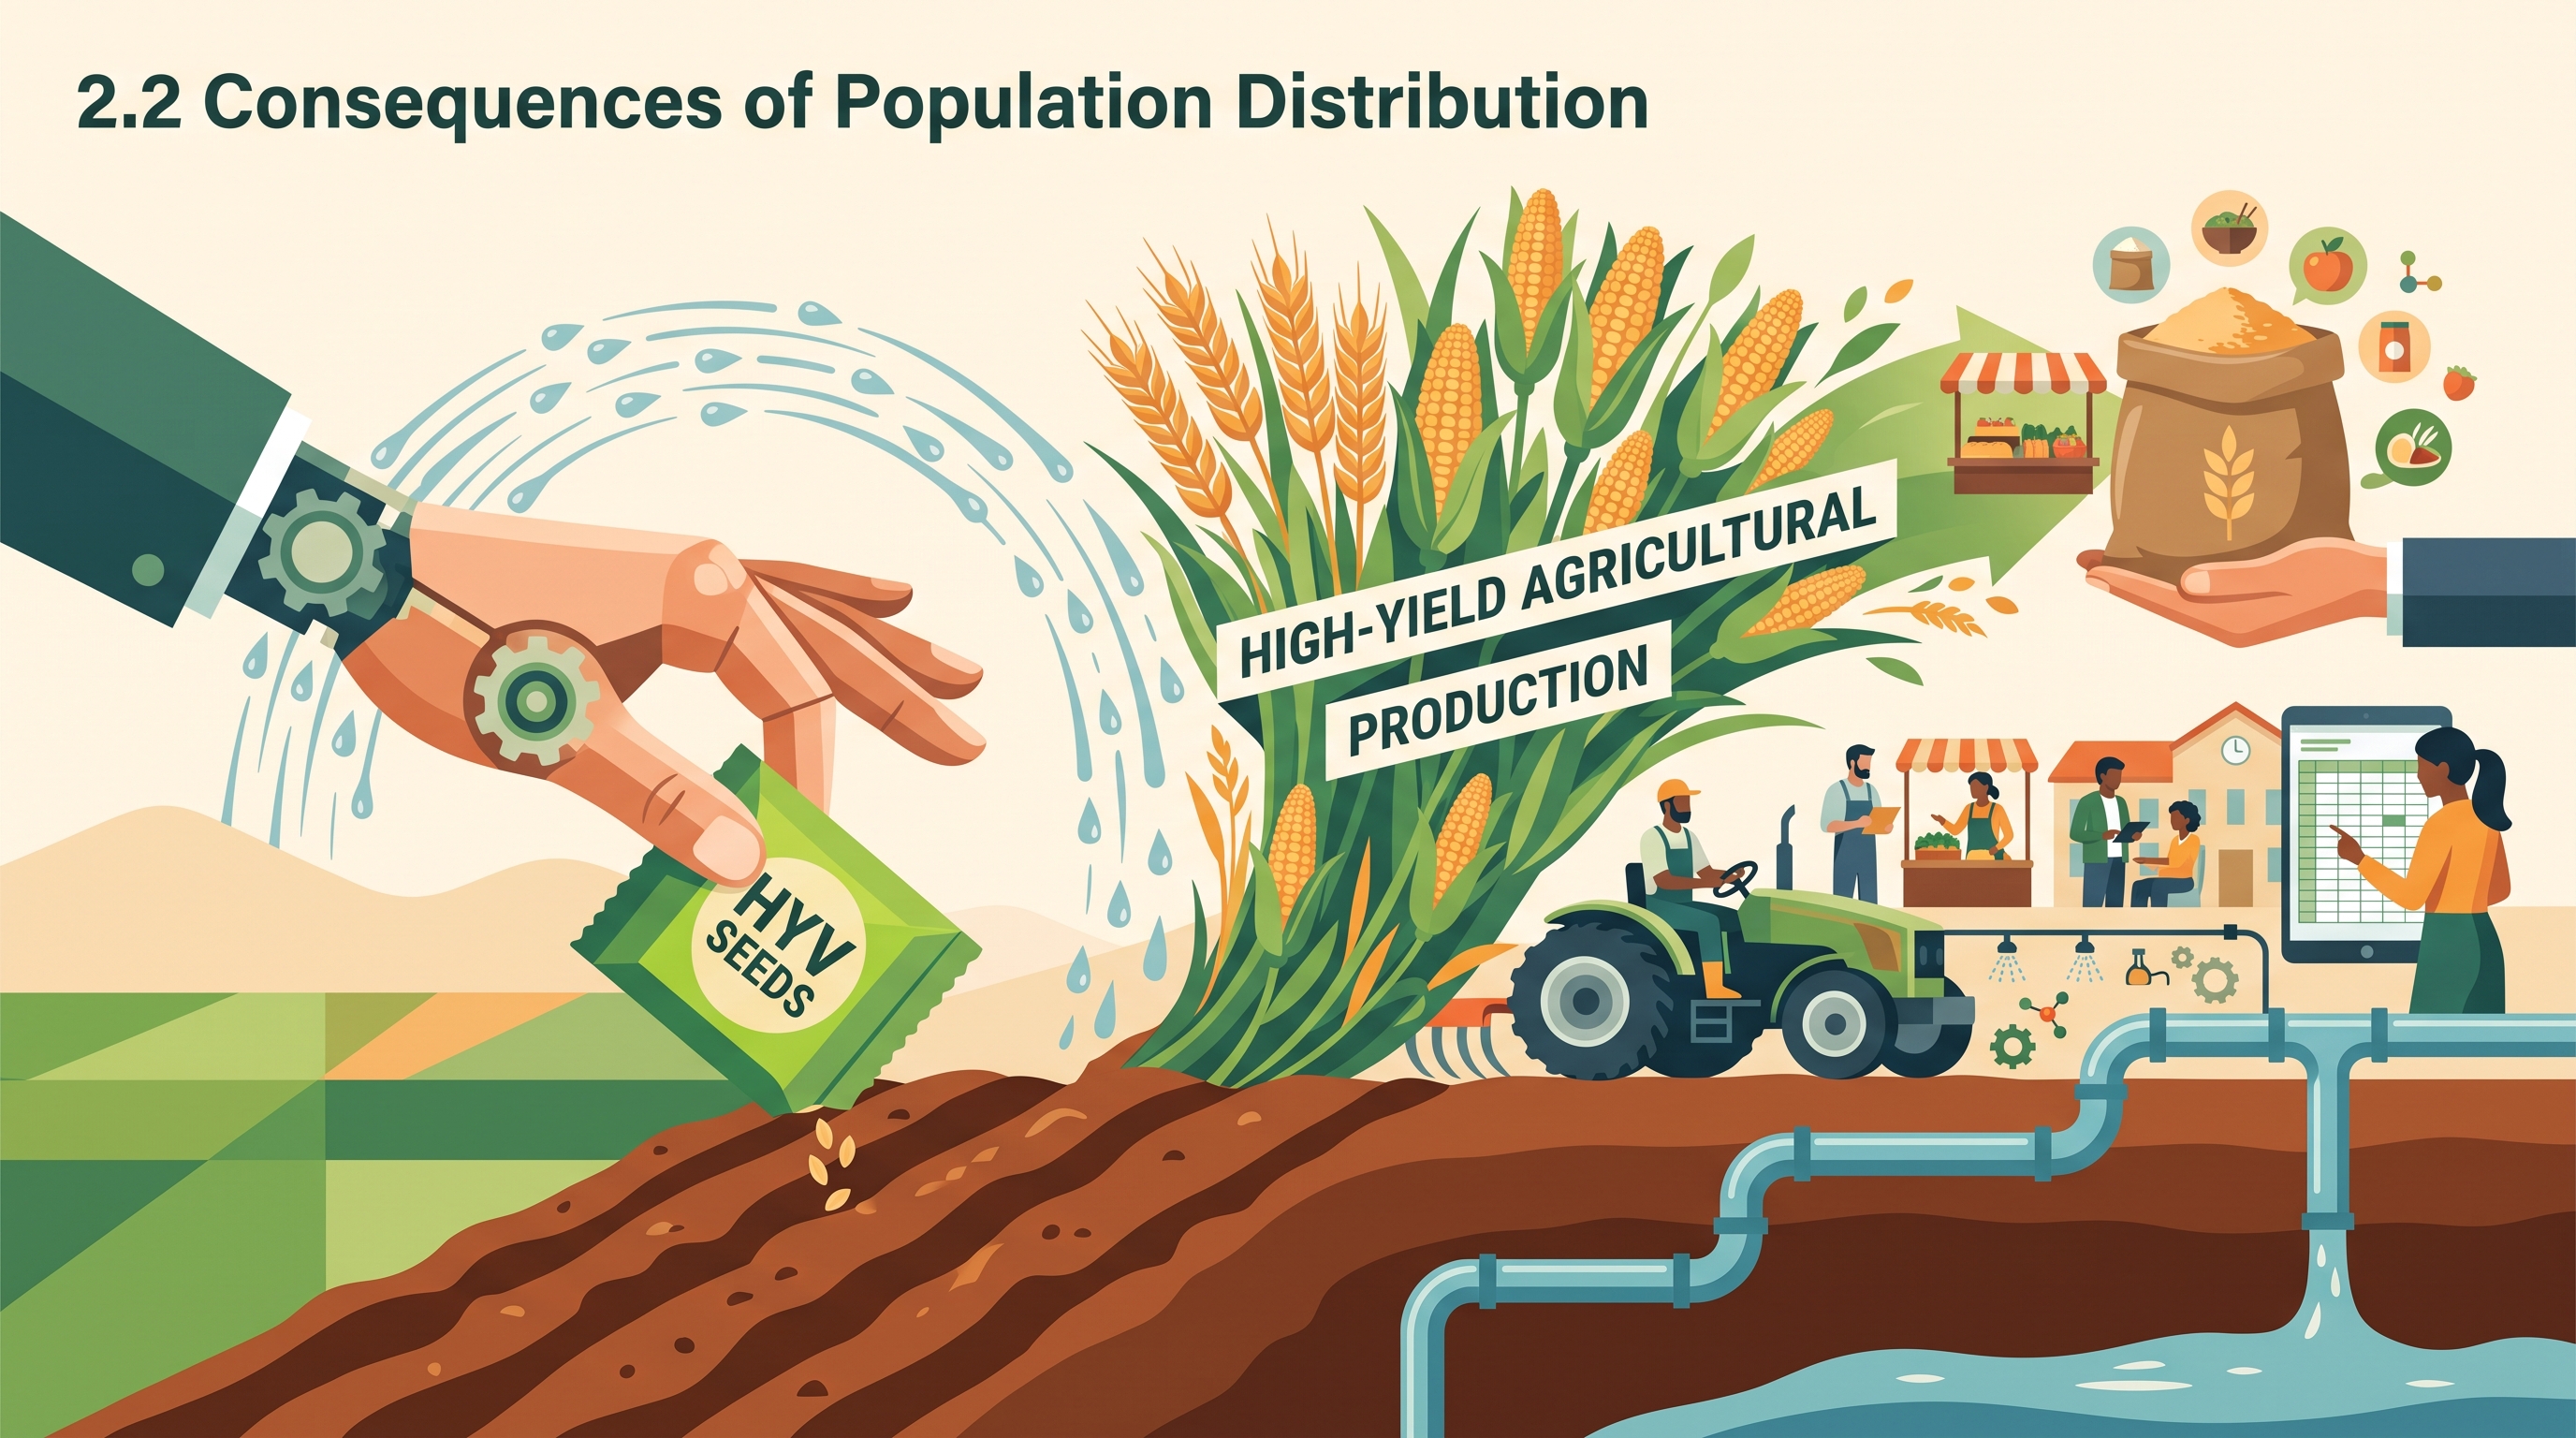
Feeding a growing population may require opening new agricultural land or developing technologies that overcome environmental constraints. The Green Revolution increased food production through high-yield seeds, irrigation, synthetic fertilizers, pesticides, and expanded mechanization. In many places, these practices created surpluses that changed global markets for local agricultural products.
The effects were mixed. Greater yields could reduce hunger and improve food security, but irrigation could deplete aquifers, fertilizers could pollute water, and pesticides could damage ecosystems. Large-scale commercial production could also make small farmers more dependent on purchased inputs and expose local producers to competition from imported food.
Agricultural change also influences the role of women. When farming becomes more commercialized or mechanized, women may lose traditional agricultural work—or gain new opportunities in wage labor, markets, education, and business. The outcome depends on land ownership, access to credit, technology, and local cultural expectations.
Cultural, political, and social consequences
Population distribution shapes cultural landscapes and political relationships. Bilingual populations in Canada are concentrated most strongly in core regions such as Quebec, Ontario, and New Brunswick, with lower concentrations in the northern territories. Linguistic patterns can be spatially uneven: English speakers are present in Quebec, while French speakers are present in Ontario, even though each language has a different regional concentration.
Migration can produce both cultural integration and separation. Integration may involve entering schools, workplaces, business associations, or attaining citizenship, and it may include settling outside ethnic enclaves. These processes can expand social networks, while concentrated enclaves may preserve language, religion, and cultural traditions.
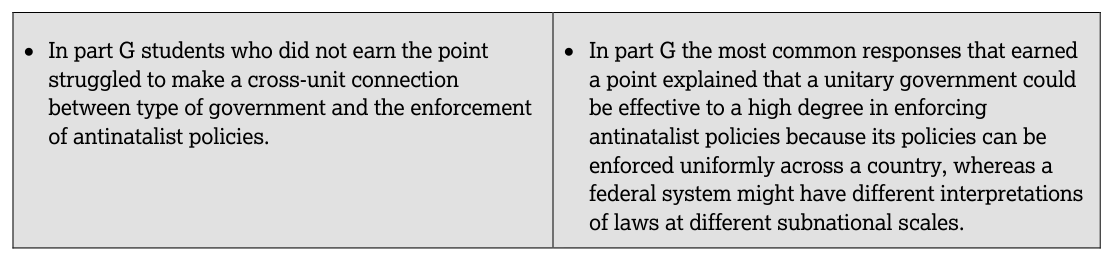
Governments also use population policies to influence demographic outcomes. Pronatalist policies promote population growth through measures such as financial benefits or support for families. Antinatalist policies discourage population growth through limits, incentives, or expanded access to contraception. Policies can change fertility, but their effects depend on enforcement, economic conditions, cultural values, and individual choices.
AP skill connection and retrieval check
This topic develops Skill 1.A: Concepts and Processes by distinguishing carrying capacity from population density and applying demographic terms accurately. It also develops Skill 2.C: Explain a likely outcome in a geographic scenario using geographic concepts, processes, models, or theories: for example, predicting that improved medical care will lower death rates, or that drought and declining farm income may increase migration.
Retrieval check: A densely populated farming region adopts high-yield seeds and irrigation, but groundwater levels fall and fertilizer runoff increases. Identify one way the technology may raise carrying capacity, one environmental consequence, and one reason Malthusian critics would use this example against a simple shortage prediction.
2.3 Population Composition
Key concepts: Population composition · Population pyramids · Using population pyramids to predict future population needs · Data analysis of population information
A country’s population is not just a total count: its population composition—the characteristics of the people who live there—reveals what services it needs now and what pressures it may face later.
2.3 Population Composition
A country’s population is not just a total count: its population composition—the characteristics of the people who live there—reveals what services it needs now and what pressures it may face later. Two countries with the same population size can require entirely different schools, hospitals, housing, and labor policies if one is mostly young and the other is mostly elderly.
Population composition is the structure of a population according to characteristics such as age, sex, race, ethnicity, and other demographic traits. Age and sex are especially important because they strongly influence births, deaths, employment, health care demand, and dependency.
The official learning objective PSO-2.E: Explain the effects of population composition on a society connects demographic structure to social and economic consequences. The essential knowledge identifiers are PSO-2.E.1, which concerns the characteristics used to describe population composition; PSO-2.E.2, which concerns population pyramids as visual representations of composition; and PSO-2.E.3, which concerns using population pyramids to predict future population needs.
Reading a population pyramid
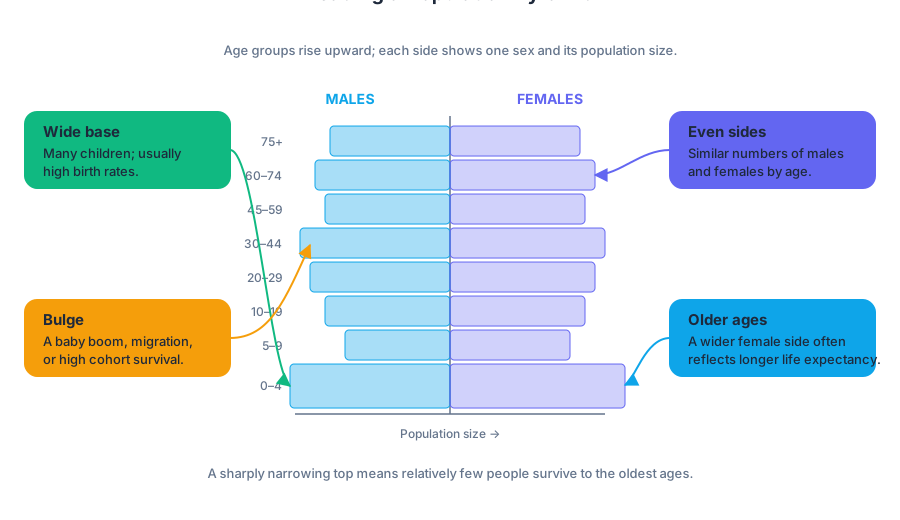
A population pyramid is a bar graph that displays a population by age and sex. Age groups are arranged vertically, usually from youngest at the bottom to oldest at the top. One sex is shown on the left and the other on the right, allowing the graph to show both the number and proportion of people in each age-sex cohort.
The pyramid’s shape is meaningful:
- A wide base indicates many children and usually reflects high birth rates.
- A narrow base indicates fewer recent births and usually reflects low fertility.
- A relatively even-sided shape suggests similar numbers of males and females at many ages.
- A wider female side among older groups often reflects women’s longer average life expectancy.
- A bulge in one age group may represent a baby boom, a migration wave, or unusually high survival for that cohort.
- A sharply narrowing top indicates that relatively few people survive into the oldest age groups.
A pyramid does not merely show “how many people live in a country.” It shows when those people were born and how the population is divided among age groups and sexes. That structure affects the balance between people likely to work and people more likely to depend on others for support.
From shape to future needs
A population pyramid can be used as demographic data to make a conditional prediction: if the current age structure and fertility pattern continue, what services and resources will become more important? The prediction should identify a visible pattern, connect it to a demographic process, and name the resulting need.
Worked example: a rapidly growing population
Imagine Country A has a very broad base: its cohorts ages $0$–$4$, $5$–$9$, and $10$–$14$ are much larger than its older cohorts. This pattern indicates many children and likely high birth rates. As these large cohorts move into school age, Country A will need more classrooms, teachers, child-care facilities, and children’s products.
The reasoning chain is:
$$ \text{wide base} \rightarrow \text{many young people} \rightarrow \text{more school-age children} \rightarrow \text{greater future demand for schools and child care} $$
The same population may later create a large labor force when those children reach working age. However, the pyramid alone does not prove that the economy will create enough jobs; it supports a prediction about demographic pressure, not a complete prediction about economic success.
Worked example: an aging population
Country B has a narrow base and a relatively large share of adults in older age groups. This shape indicates low fertility and an aging population. In the future, Country B may need expanded elderly medical care, specialized housing, accessible transportation, and products designed for senior citizens.
$$ \text{narrow base} \rightarrow \text{fewer future workers and children} \rightarrow \text{larger relative older population} \rightarrow \text{greater demand for elder care and health services} $$
A country with both low birth rates and many older adults may also face labor shortages. One possible response is increased immigration, although the pyramid itself shows the demographic pressure rather than determining the policy response.
Data-analysis skills
Population pyramids require Skill 3.E (Data Analysis): use data visualization to identify what the evidence shows and support a precise inference. A strong response does not say only “the country is old” or “the country is growing.” It identifies the relevant part of the pyramid and explains its consequence.
They may also require Skill 2.A (Spatial Relationships): Describe spatial patterns, when comparing age-sex structures among countries or regions, and Skill 5.C (Scale Analysis), when explaining how population composition differs between scales such as a country, county, or urban area. For example, an urban area may have a different life-expectancy pattern from an entire county because access to food, health care, sanitation, and social services varies by scale.
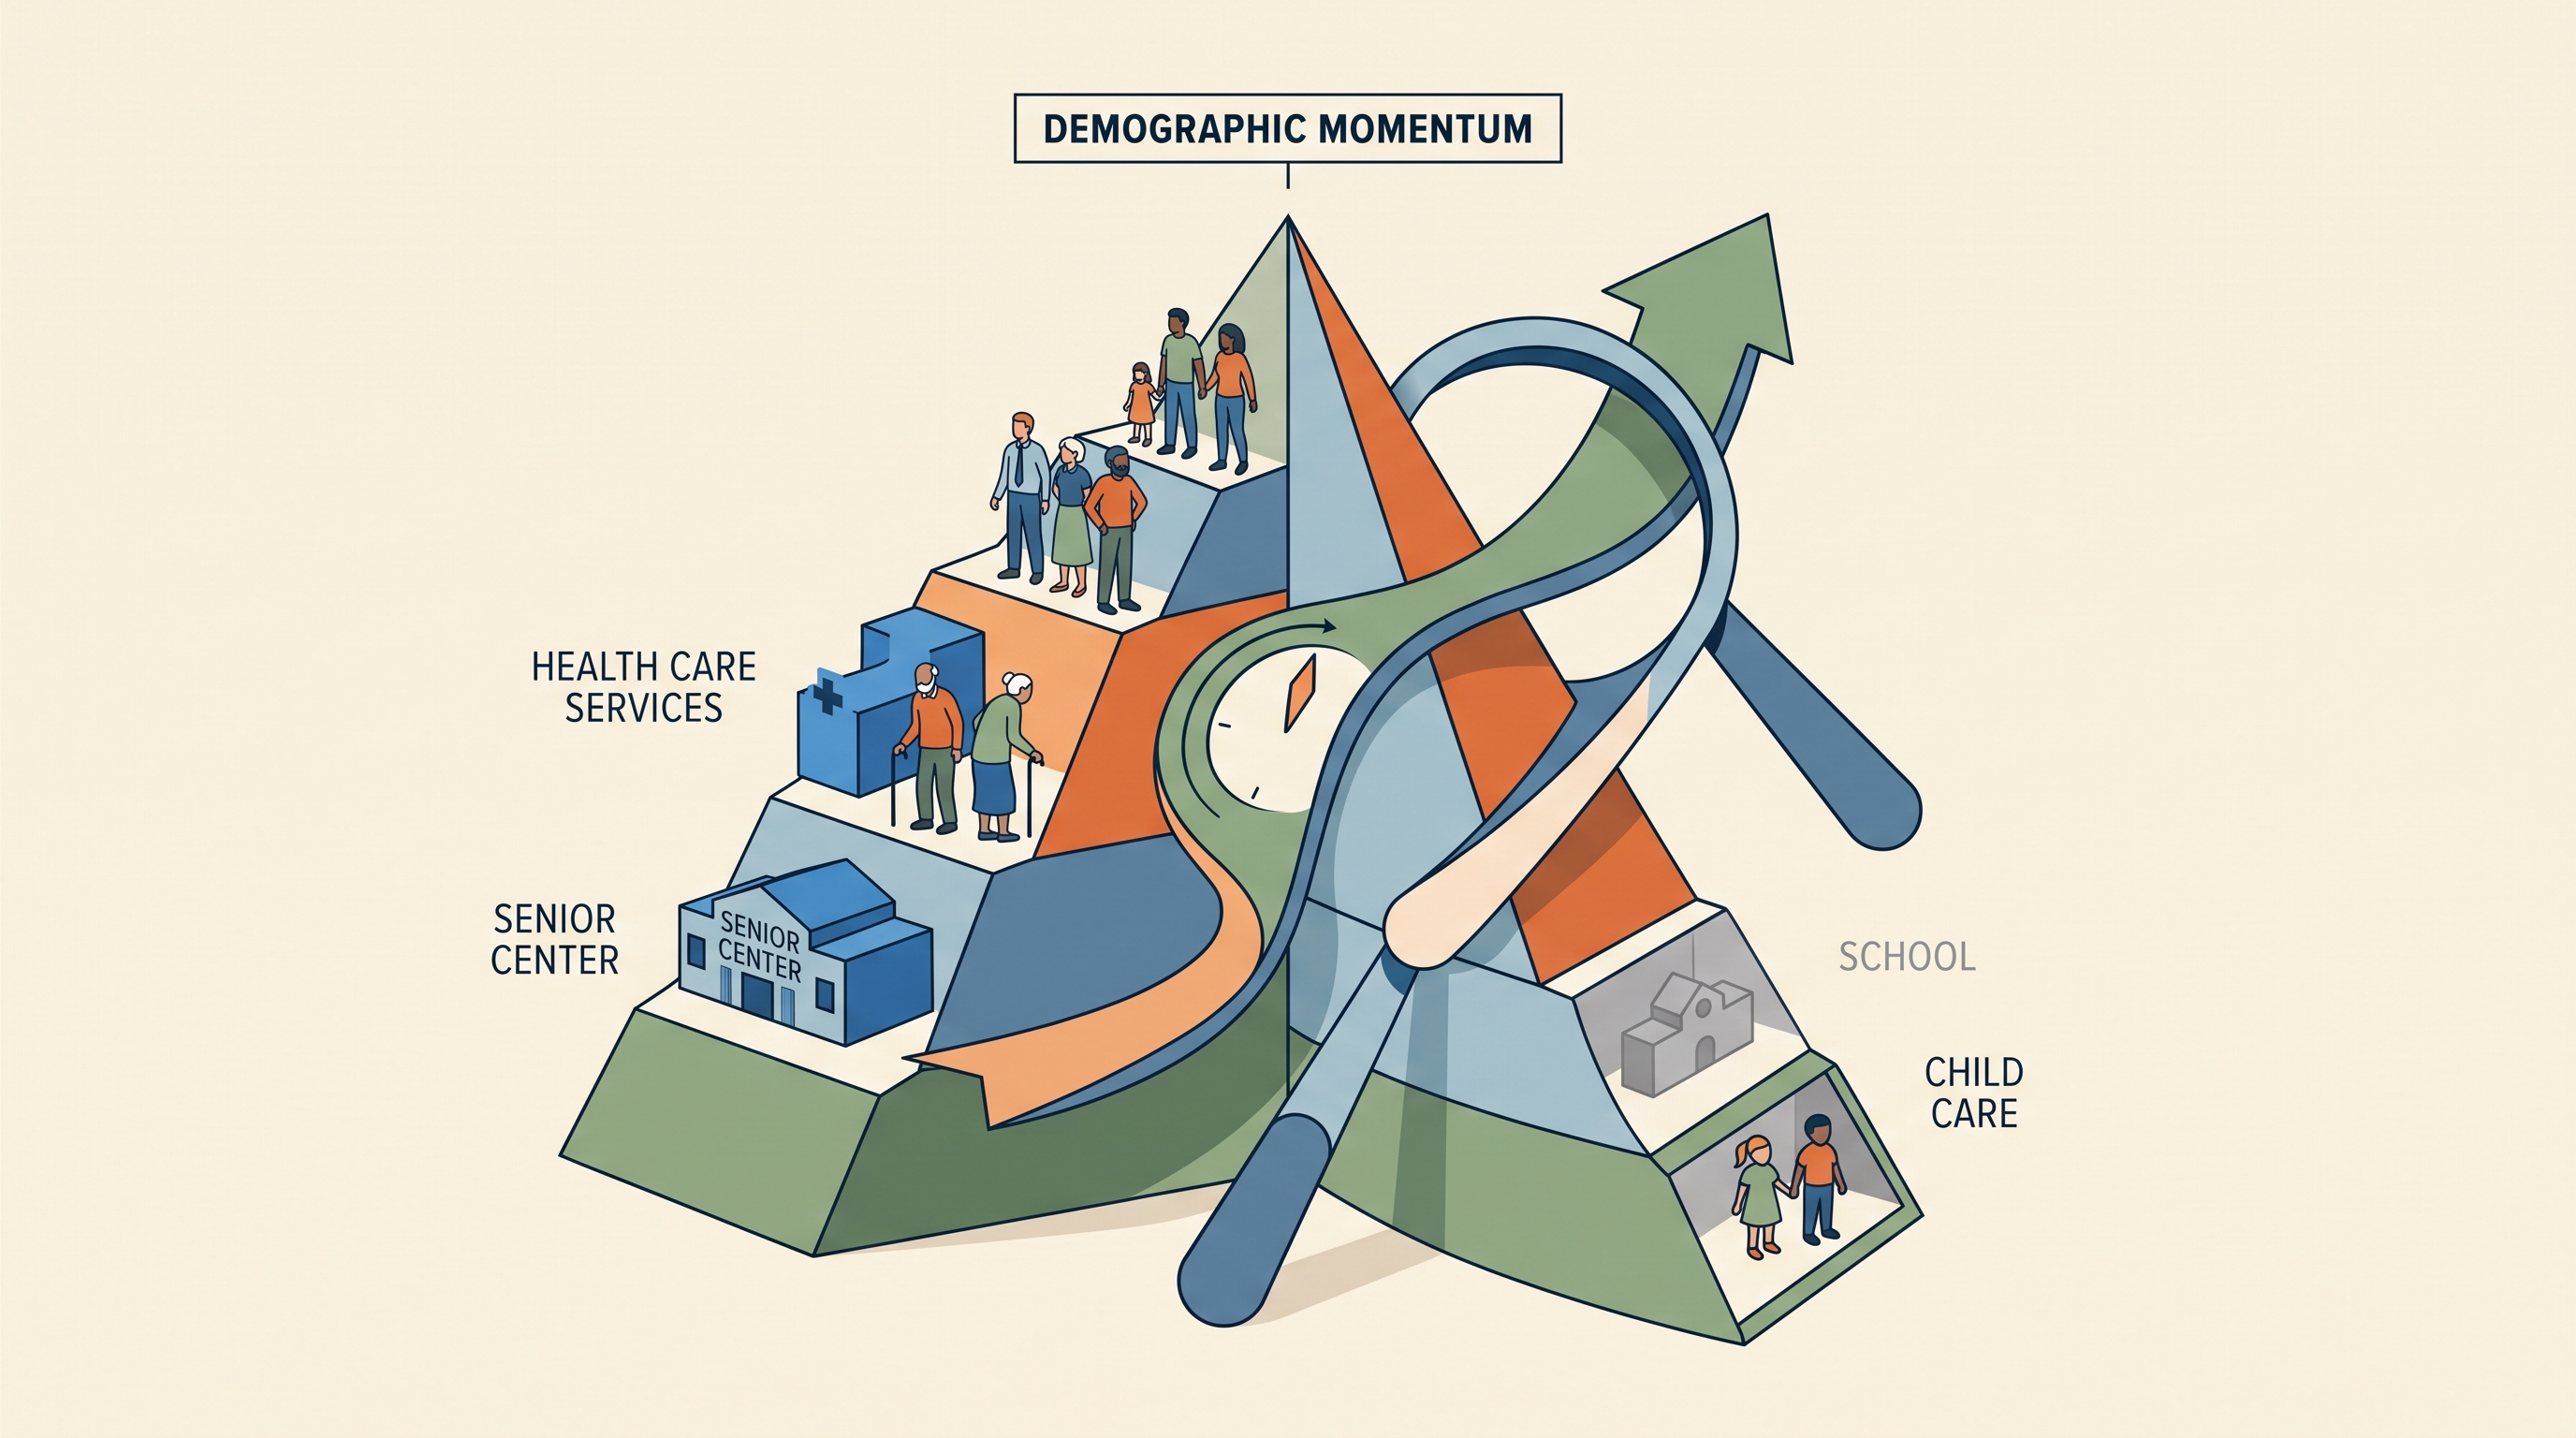
Common misconception — “A population pyramid predicts the future with certainty.” It does not. Fertility, mortality, migration, policies, conflict, disease, and economic conditions can change. The accurate claim is that the pyramid reveals demographic momentum and helps forecast likely needs if major conditions remain similar.
Retrieval check: A country’s pyramid has a narrow base, a large middle-aged population, and a widening female advantage among older adults. What two future needs are most defensible? Answer: fewer new schools and child-care facilities because birth rates are low, and more health care or elder-care services because the population is aging. Explain each prediction by pointing to the pyramid feature that supports it.
2.4 Population Dynamics
A population can grow even when families are having fewer children—and shrink even when births still outnumber deaths—because population dynamics tracks the combined effects of natural change and migration.
2.4 Population Dynamics
A population can grow even when families are having fewer children—and shrink even when births still outnumber deaths—because population dynamics tracks the combined effects of natural change and migration.
Population change = natural increase or decrease + net migration
Natural change compares births with deaths. Migration change compares people entering with people leaving. Separating these processes prevents a common analytical mistake: treating every population increase as the result of high fertility.
Natural increase and decrease
The crude birth rate (CBR) is the number of live births per $1{,}000$ people in a population during one year. The crude death rate (CDR) is the number of deaths per $1{,}000$ people during one year. “Crude” means that the rate uses the total population as its denominator rather than controlling for age structure or other characteristics.
The difference between the CBR and CDR is the natural increase rate (NIR), expressed as a percentage:
$$ \text{NIR}=\frac{\text{CBR}-\text{CDR}}{10} $$
The division by $10$ converts a difference measured per $1{,}000$ people into a percentage. If a country has a CBR of $24$ and a CDR of $9$, its natural increase is $15$ per $1{,}000$, or an NIR of $1.5%$. If deaths exceed births, the NIR becomes negative: the population experiences natural decrease.
Worked example: separating natural change from migration
Suppose a country records a CBR of $12$ and a CDR of $17$ per $1{,}000$ people. Its natural change is:
$$ 12-17=-5\text{ per }1{,}000 $$
Therefore:
$$ \text{NIR}=\frac{12-17}{10}=-0.5% $$
The country also receives net migration of $+2$ per $1{,}000$. Migration reduces the loss, but it does not eliminate it:
$$ -5+2=-3\text{ per }1{,}000 $$
Total population would decline because net migration of $+2$ per $1{,}000$ is insufficient to offset the natural decrease of $5$ per $1{,}000$. Population growth would require net migration greater than $+5$ per $1{,}000$.
Net migration
Net migration is the difference between immigration and emigration:
$$ \text{Net migration}=\text{immigration}-\text{emigration} $$
A positive value means more people enter than leave; a negative value means more people leave than enter. Combining the two components gives the total population-change rate:
$$ \text{Total change}=(\text{CBR}-\text{CDR})+\text{net migration} $$
For example, a country with an NIR of $1.2%$ and net migration of $-0.4%$ still grows overall at approximately $0.8%$ per year. Conversely, a country with an NIR of $-0.5%$ needs net migration above $0.5%$ merely to avoid decline.
Why rates can mislead
CBR and CDR are useful for comparing populations, but they are not complete explanations. A high CDR may reflect a large elderly population rather than poor health care, while a low CBR may reflect delayed childbearing, urbanization, or access to contraception. Because these are crude rates, the age composition already examined in population pyramids helps explain why the rates differ.
Named misconception — “Positive NIR always means population growth.” A positive NIR describes natural increase only. If emigration is large enough, total population can still fall. The reverse is also possible: a country with natural decrease can grow when net immigration more than compensates for deaths exceeding births.
Named misconception — “A CBR of $12$ means $12%$ of the population gave birth.” It means $12$ births per $1{,}000$ people, or $1.2%$ of the total population before deaths and migration are considered.
Skill focus: Skill 3.C Data Analysis
Topic 2.4 is associated with IMP and Skill 3: Data Analysis, especially Skill 3.C: Describe spatial patterns and relationships presented in maps, tables, charts, graphs, and diagrams. In practice, read the data in sequence: identify whether births or deaths are larger, calculate natural change, add net migration, and then state whether the total population grows or declines.
Retrieval check: A country has a CBR of $12$, a CDR of $17$, and net migration of $+2$ per $1{,}000$. What is its NIR, and does its total population grow?
The NIR is $-0.5%$. Natural decrease is $5$ per $1{,}000$, while net migration adds only $2$ per $1{,}000$, so total population declines by $3$ per $1{,}000$. The key conclusion is that population change must be analyzed by combining natural change with net migration, not by looking at either component alone.
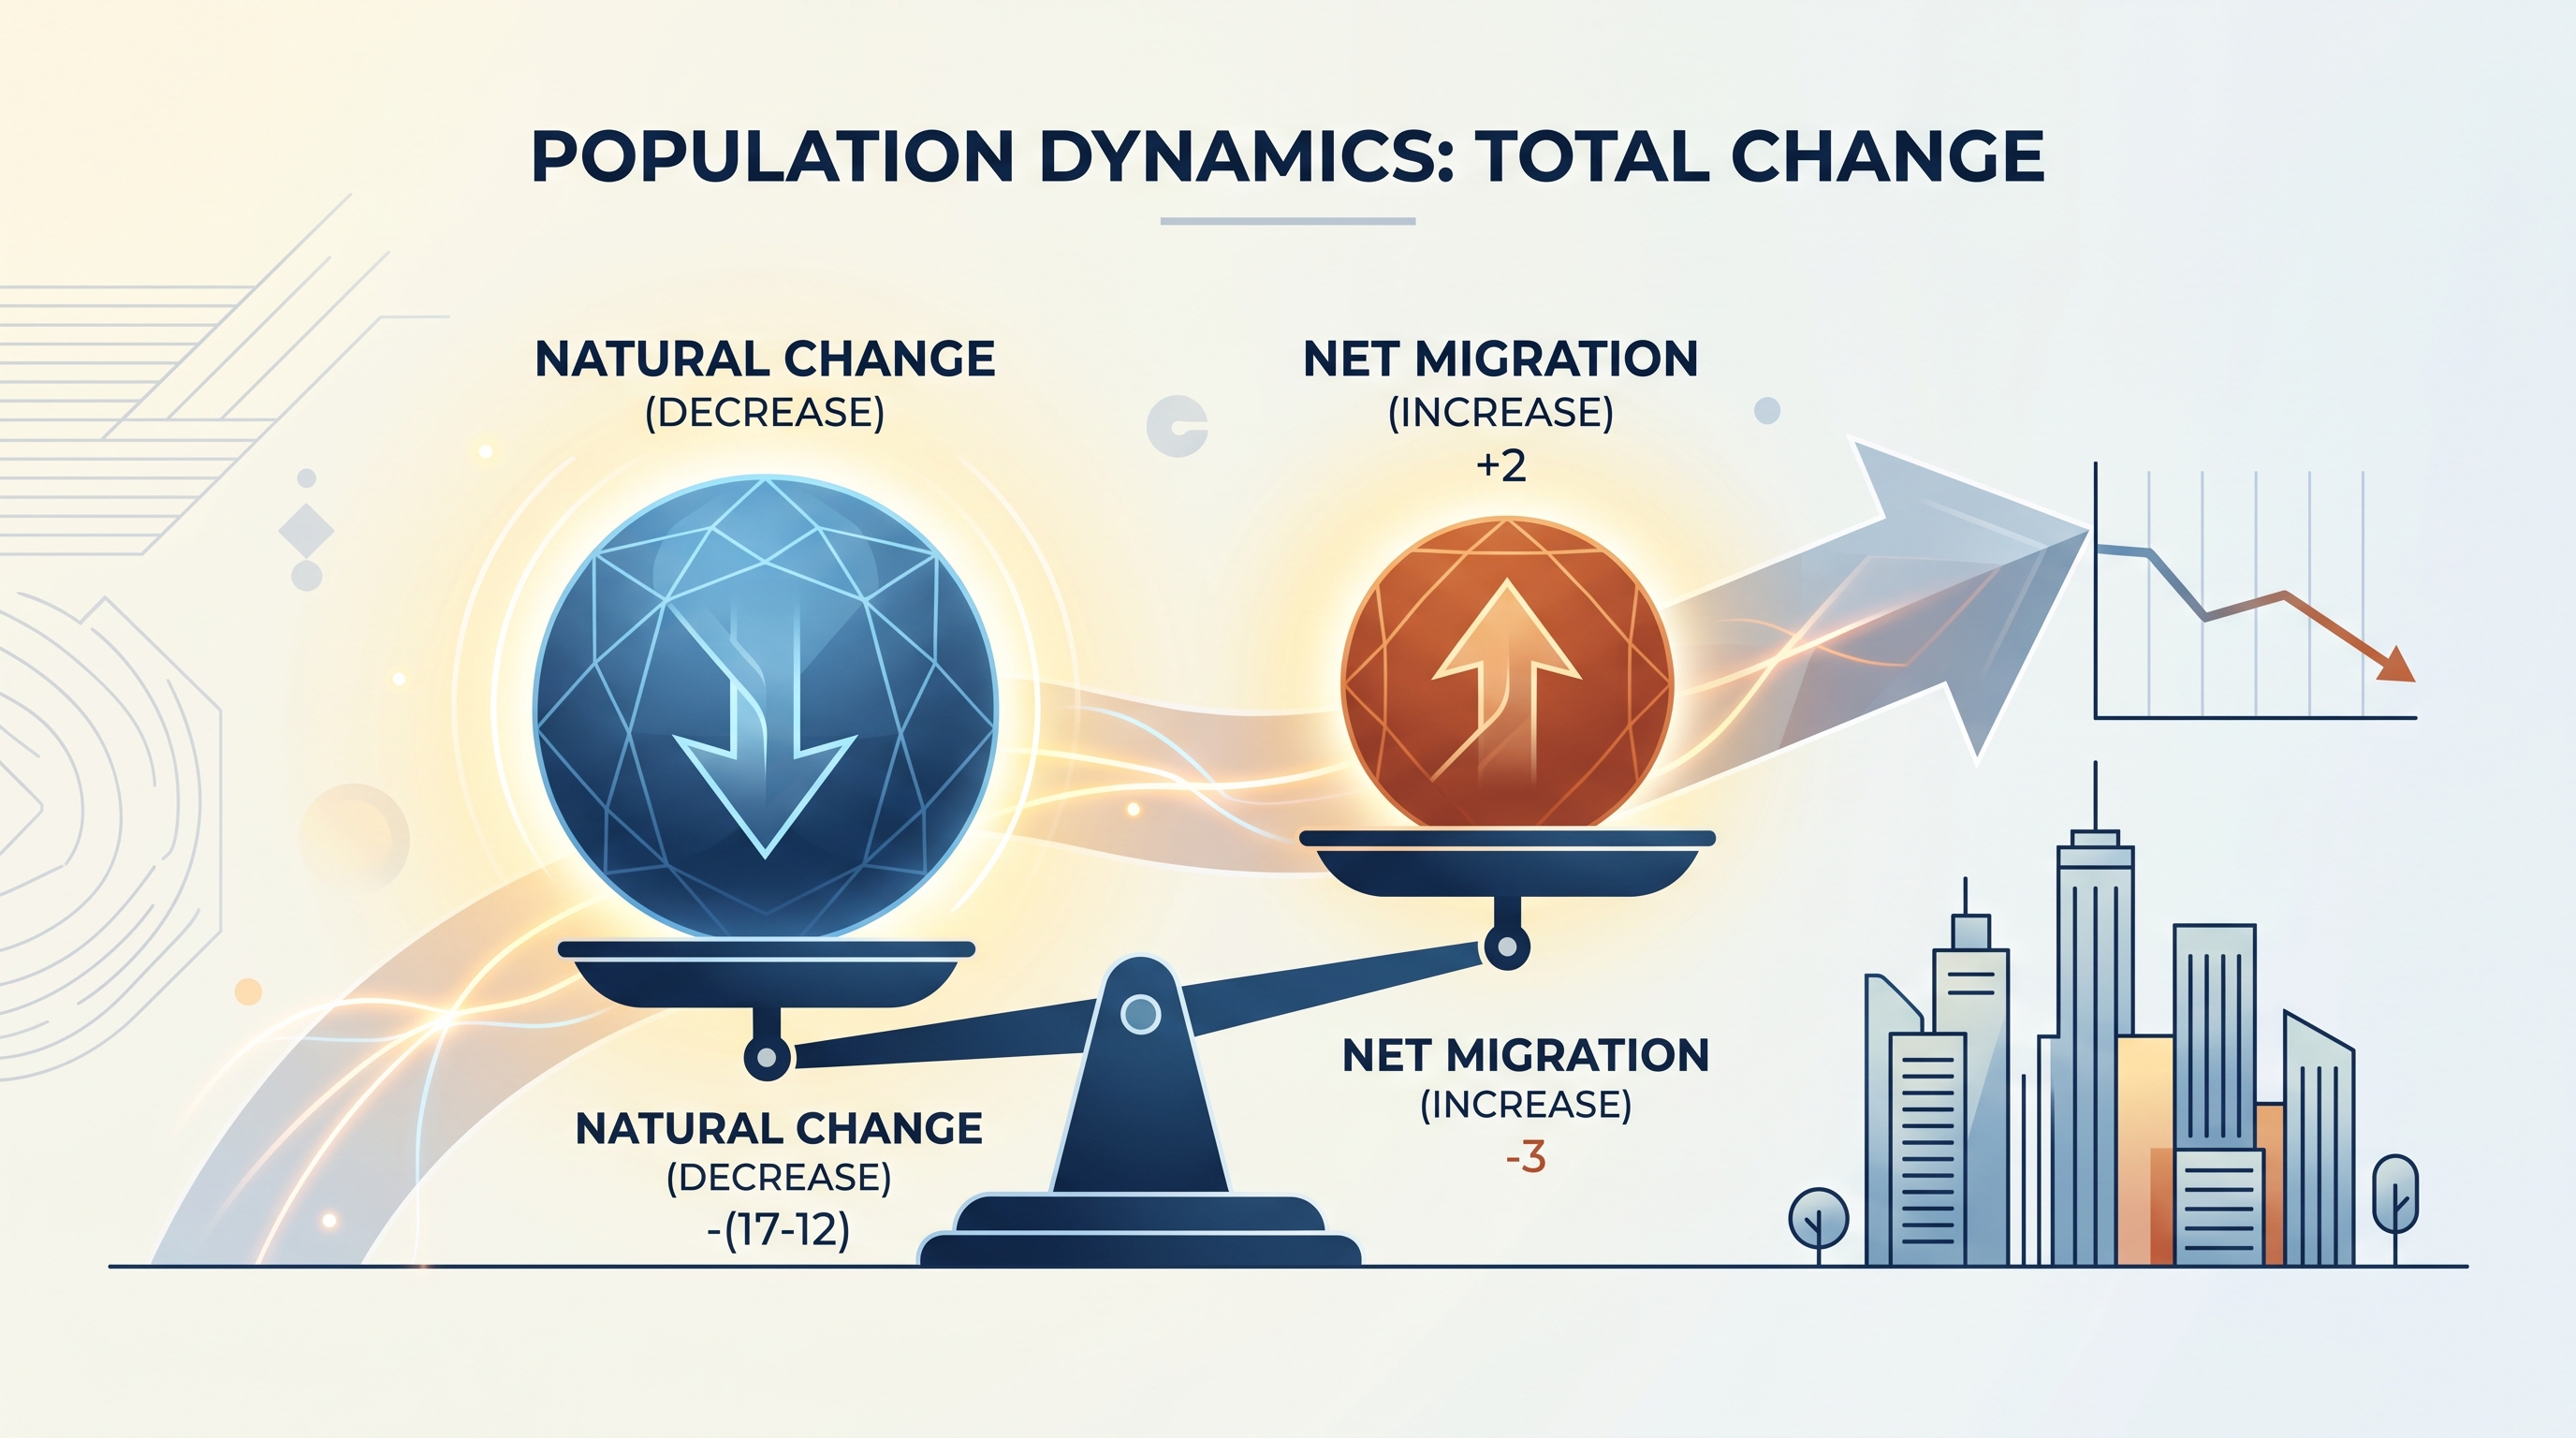
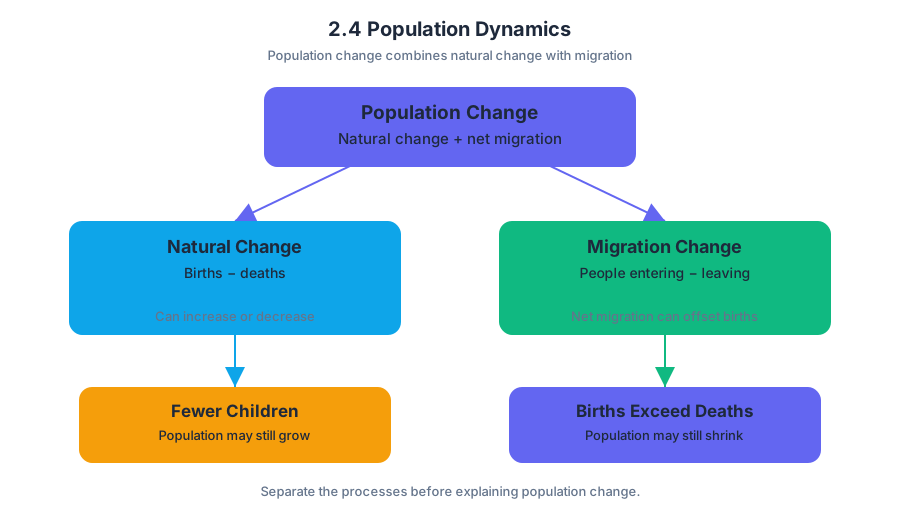
2.5 The Demographic Transition Model
Key concepts: Demographic Transition Model (DTM) · Population change over time · Epidemiological transition · Fertility rates · Mortality rates · Migration rates · Crude birth rate · Crude death rate · Rate of natural increase · Population pyramids
A country can move from rapid population growth to population decline even when people live much longer. The Demographic Transition Model (DTM) explains this historical change by tracking how fertility rates and mortality rates change as environmental, economic, cultural, and political conditions change.
2.5 The Demographic Transition Model
A country can move from rapid population growth to population decline even when people live much longer. The Demographic Transition Model (DTM) explains this historical change by tracking how fertility rates and mortality rates change as environmental, economic, cultural, and political conditions change.
IMP-2.B.1 — The demographic transition model can be used to explain population change over time.
The population-accounting foundation
Population change depends on three components: births, deaths, and migration. A useful accounting relationship is
$$ \text{Population change} = \text{births} - \text{deaths} + \text{net migration}. $$
The crude birth rate (CBR) is the number of live births per $1{,}000$ people per year:
$$ \text{CBR}=\frac{\text{number of live births in one year}}{\text{midyear population}}\times 1{,}000. $$
$$ \text{CDR}=\frac{\text{number of deaths in one year}}{\text{midyear population}}\times 1{,}000. $$
The rate of natural increase (RNI) measures population growth from births and deaths alone, excluding migration:
$$ \text{RNI}=\text{CBR}-\text{CDR}. $$
Because CBR and CDR are usually expressed per $1{,}000$, divide by $10$ to express RNI as a percentage. For example, if a country has a CBR of $28$ and a CDR of $8$, its RNI is $20$ per $1{,}000$, or $2.0%$.
Migration rates must also be expressed relative to population size. The net migration rate (NMR) is net migration per $1{,}000$ people:
$$ \text{NMR}=\frac{\text{immigrants}-\text{emigrants}}{\text{midyear population}}\times 1{,}000. $$
Thus, approximate total population change in percentage terms is
$$ \text{Total growth rate} \approx \text{RNI}+\frac{\text{NMR}}{10}. $$
A country with an RNI of $-0.4%$ and an NMR of $+6$ per $1{,}000$ has an approximate total growth rate of $+0.2%$. Natural decrease is being offset by immigration.
Reading the DTM as a sequence
The DTM is a model, not a universal law. Its stages describe a common pattern:
| Stage | Birth rates | Death rates | Overall population pattern |
|---|---|---|---|
| 1 | High | High and fluctuating | Slow growth |
| 2 | Remain high | Fall rapidly | Rapid growth |
| 3 | Fall substantially | Low | Growth slows |
| 4 | Low | Low | Stable or very slow growth |
| 5, in some versions | Very low | Low or rising slightly | Natural decrease |
In Stage 1, limited sanitation, medical care, and food security produce high mortality, while families often have many children. In Stage 2, mortality falls first because of cleaner water, improved sanitation, better nutrition, disease control, and medical advances. Fertility may remain high because cultural expectations, limited access to contraception, agricultural labor needs, and uncertainty about child survival persist.
In Stage 3, urbanization, education, contraception, rising household costs, and expanded employment opportunities—especially for women—contribute to declining fertility. Stage 4 combines low fertility with low mortality; Stage 5 describes countries where fertility remains below replacement level and deaths exceed births.
IMP-2.B.2 — The epidemiological transition explains causes of changing death rates.
Why death rates change: the epidemiological transition
The epidemiological transition describes the shift from deaths caused mainly by infectious diseases, famine, and poor sanitation toward deaths caused mainly by chronic and degenerative diseases such as heart disease and cancer. Mortality therefore falls sharply when public health improves, even before a society becomes highly industrialized.
Later, mortality may remain low but increase at older ages because a larger share of the population survives into late adulthood. This does not mean health has suddenly worsened; it can reflect population aging and the fact that chronic diseases become more common when infectious diseases no longer dominate.
Fertility is not the same as the birth rate
A fertility rate measures childbearing behavior more directly than a crude birth rate. The total fertility rate (TFR) is the average number of children a woman is expected to have over her lifetime, based on current age-specific fertility rates.
CBR describes births relative to the entire population, while TFR describes the average births associated with women of reproductive age. A country with many elderly people may have a low CBR partly because a smaller share of its population is in childbearing ages, even if its TFR is not extremely low. As TFR declines, smaller younger cohorts eventually enter reproductive ages, reinforcing later-stage population aging and possible decline.
Population pyramids: a snapshot of the model
A population pyramid displays age-sex structure: males are usually shown on the left, females on the right, and younger ages at the bottom. Its shape provides a visual clue about demographic conditions.
- A broad triangular base suggests high fertility and a large child population, commonly associated with Stage 2.
- A more column-shaped pyramid suggests low fertility and low mortality, associated with Stage 4.
- A narrow base with a wider middle or upper section suggests very low fertility, aging, and possible natural decrease, as seen in contemporary Japan.
- Uneven bulges may reveal migration, war, disease, or a baby boom rather than a normal DTM stage.
Misconception check — “A pyramid predicts population growth by itself.” It does not. A young population may create population momentum because many people will soon enter childbearing ages, but migration policy, fertility behavior, mortality, and economic conditions can alter the outcome.
Applying the model geographically
To analyze a map or dataset, identify the spatial pattern first, then connect it to a demographic process. Regions with youthful pyramids and high RNI may reflect lower incomes, limited contraception, or rural labor systems; regions with aging pyramids may reflect urbanization, delayed marriage, high education costs, or sustained low TFR. Political policies—such as pronatalist programs or immigration rules—and environmental pressures can modify any expected trajectory.
Worked interpretation: Japan’s constrictive pyramid, low fertility, and aging population indicate late-stage transition and natural decrease. Immigration can reduce the speed of total decline, but it does not automatically reverse low fertility or aging because NMR affects total population directly while RNI captures only births minus deaths.
AP skills: 1.B — Explain geographic concepts, processes, models, and theories by linking each DTM stage to changing CBR, CDR, and RNI. 3.B — Describe spatial patterns presented in maps and in quantitative and geospatial data by identifying pyramid shapes, regional clusters, and trends. 3.C — Explain patterns and trends in maps and in quantitative and geospatial data by connecting those patterns to environmental, economic, cultural, and political factors.
Retrieval check: A country has CBR $9$, CDR $12$, and NMR $+8$ per $1{,}000$. What are its RNI and approximate total growth rate?
Answer: RNI is $-3$ per $1{,}000$, or $-0.3%$. Adding NMR’s $+0.8%$ gives approximately $+0.5%$ total growth.
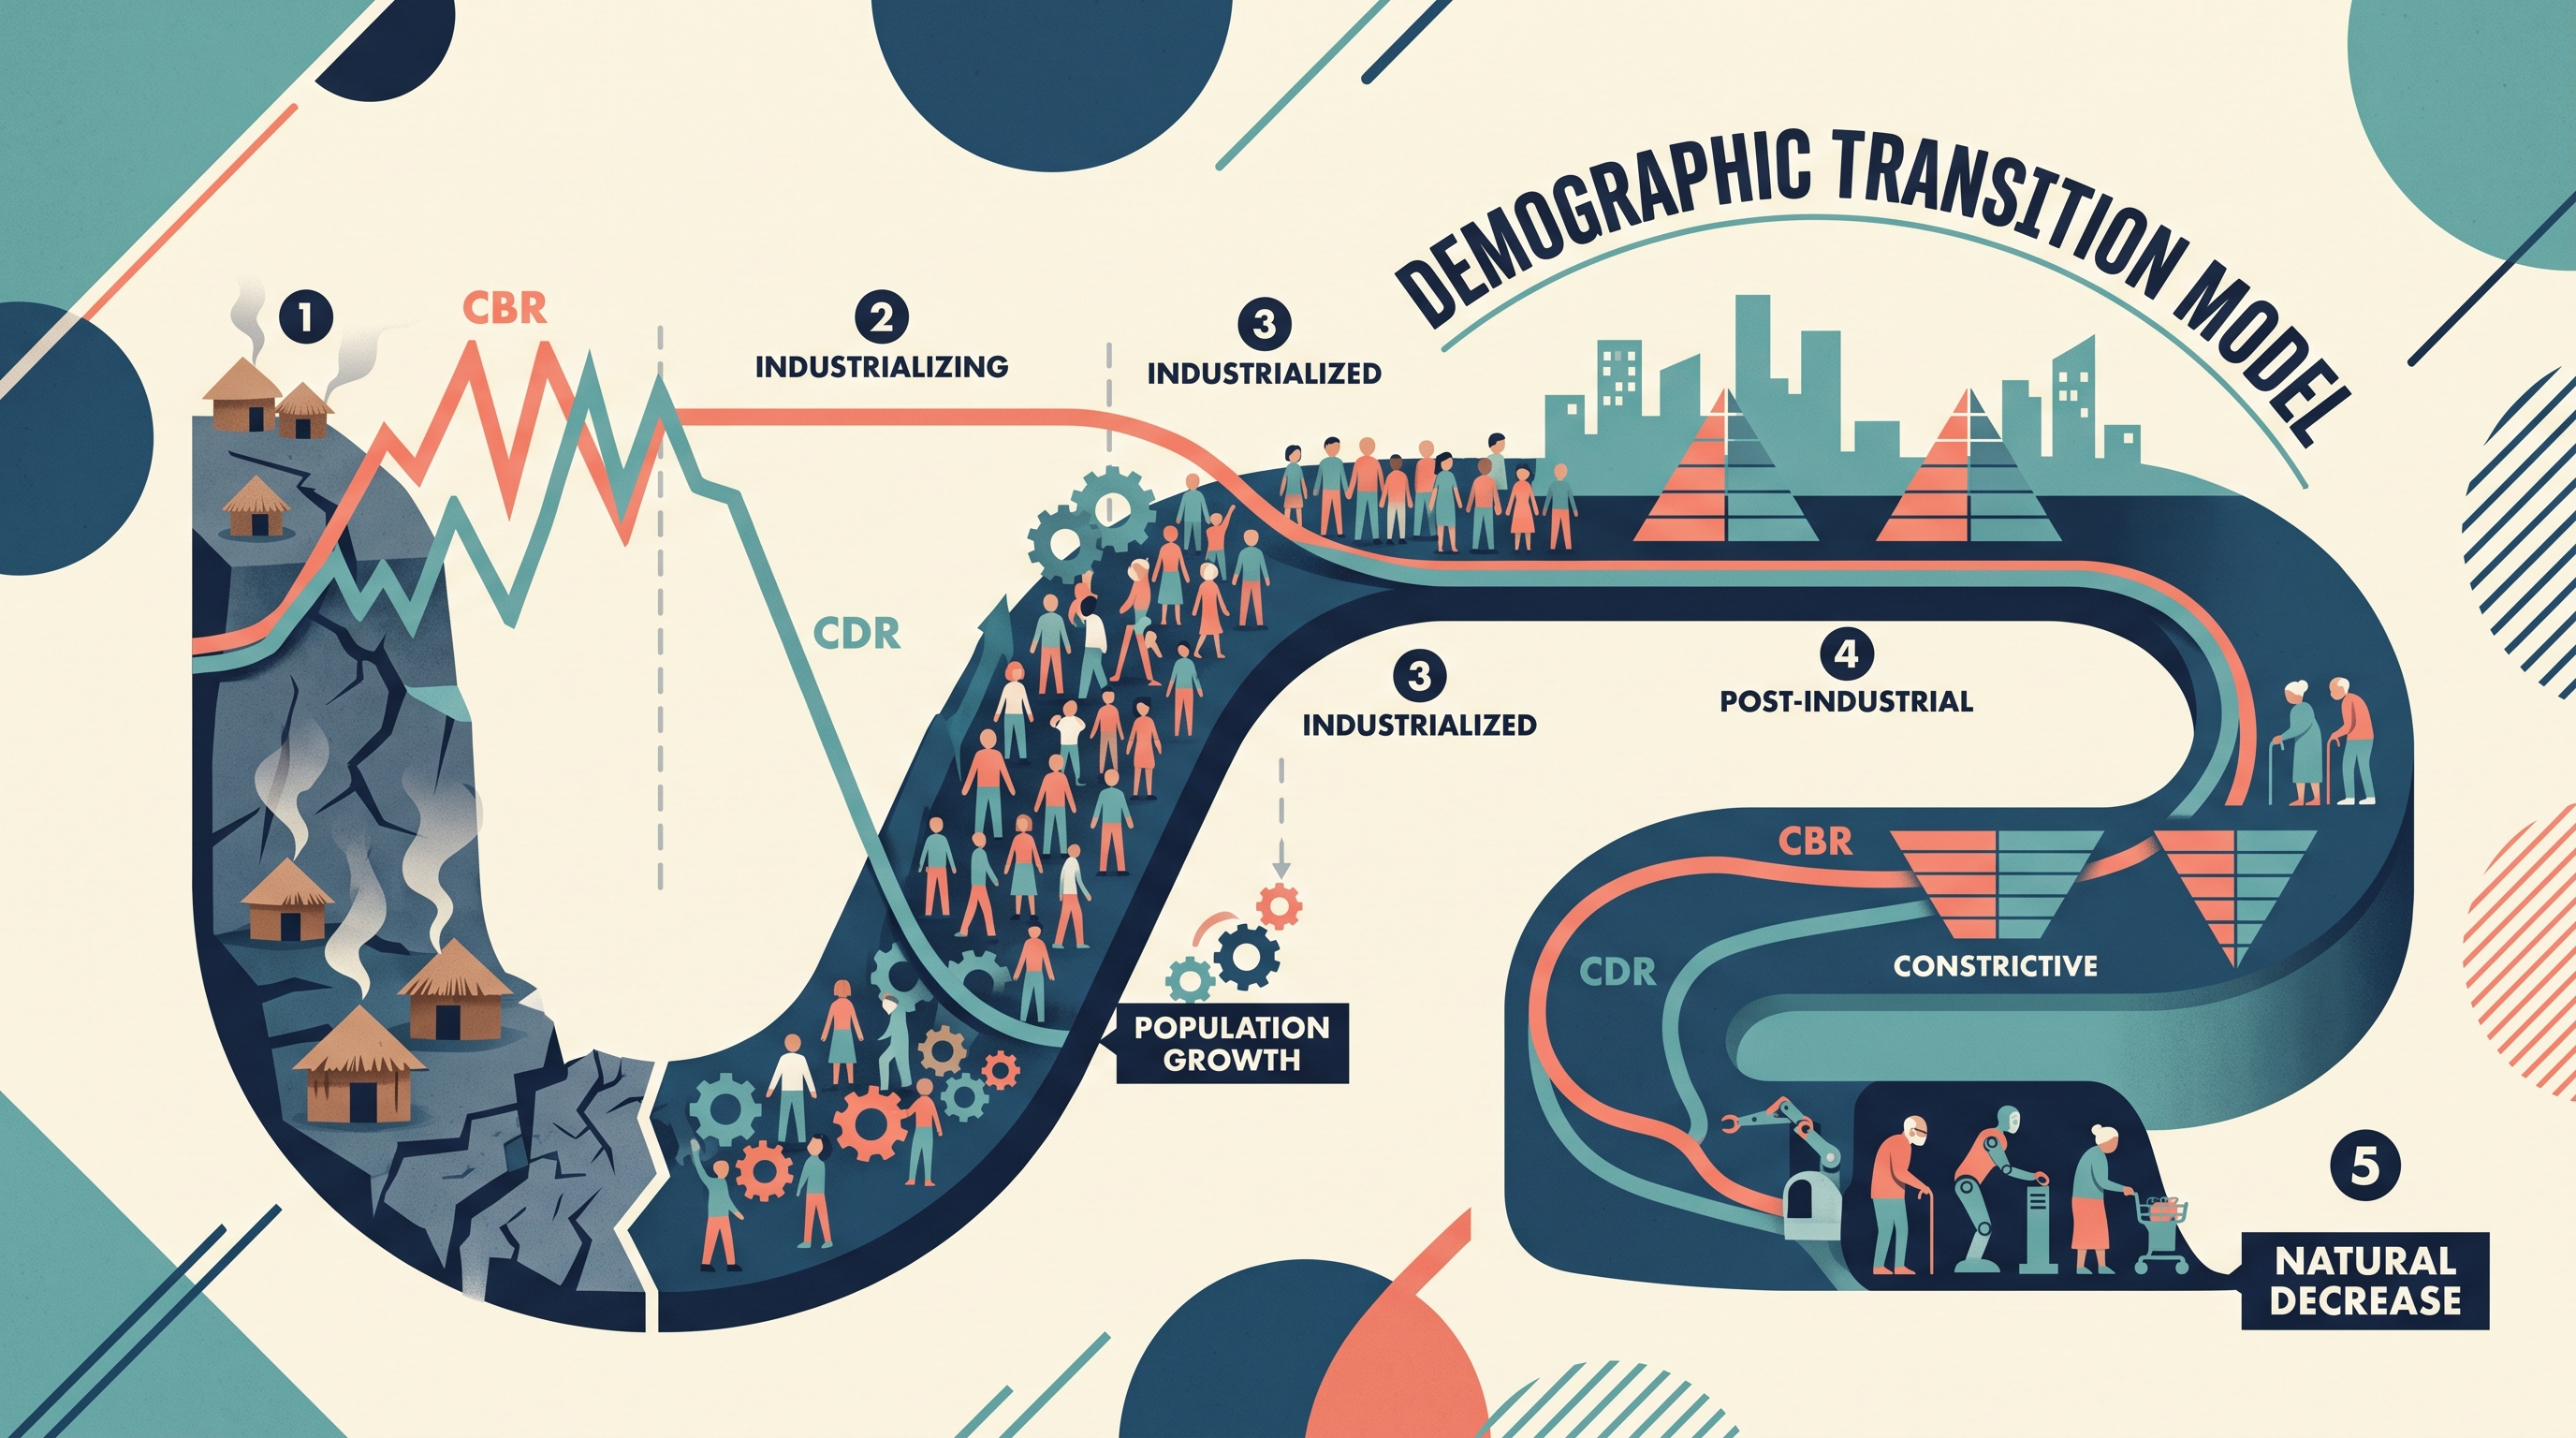
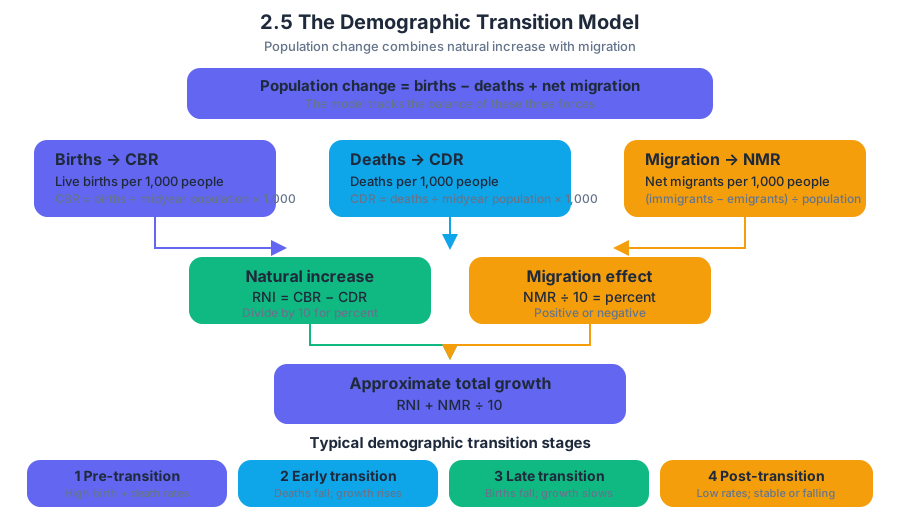
2.6 Malthusian Theory
Key concepts: Malthusian Theory · Population growth · Food production · Agricultural technological advancements · Agricultural revolutions · Expensive farm inputs · Agricultural production costs · Farm profitability · Rural-to-urban migration · Wealth gap between farms
A population can grow rapidly even while the food system supporting it changes slowly. Malthusian theory is the argument that population growth can eventually outpace food production, creating pressure on resources and lowering living standards unless population growth is checked.
2.6 Malthusian Theory
A population can grow rapidly even while the food system supporting it changes slowly. Malthusian theory is the argument that population growth can eventually outpace food production, creating pressure on resources and lowering living standards unless population growth is checked.
Core idea: If the number of people rises faster than the food supply, the gap between population and food production can produce hunger, disease, conflict, or other limits on population growth.
The Malthusian model
Thomas Malthus proposed that population tends to increase faster than food production. In simplified form, population growth is often represented as exponential, while food production is represented as increasing more slowly. The crucial relationship is not a memorized graph but the possibility that the two growth rates diverge.
A Malthusian explanation focuses on carrying capacity, the largest population an environment can sustainably support with available resources and technology. When population approaches or exceeds that capacity, scarcity becomes more likely. In human geography, the theory connects population dynamics to agricultural production, environmental limits, and migration.
Why Malthusian theory is limited
The major weakness of Malthusian theory is that Malthus failed to predict the impact of agricultural technological advancements. Agricultural revolutions introduced new methods and inputs that allowed food production to increase faster than he anticipated.
Examples include high-yield seeds, irrigation, mechanization, synthetic fertilizers, pesticides, improved transportation, and expanded commercial farming. These changes can raise output per unit of land, allowing food production to outpace population growth rather than fall permanently behind it.
Exam-ready weakness: Malthusian theory assumes that food production cannot keep pace with population growth, but agricultural revolutions have increased food production at a rate that can outpace population growth.
Worked example: when technology changes the prediction
Imagine that a farming region has $100$ farms producing enough grain for $1{,}000$ people. The population then grows to $1{,}300$. A strictly Malthusian prediction would expect increasing scarcity because the population has risen by $30%$ without a comparable increase in farmland.
Now suppose farmers adopt high-yield seeds, irrigation, and improved fertilizers. If production rises from enough for $1{,}000$ people to enough for $1{,}600$, food production has increased faster than population. The original population-pressure prediction no longer holds because technology changed the relationship between land, food, and people.
The example does not prove that scarcity is impossible. It shows why Malthusian theory is a useful warning about resource limits but an incomplete prediction of modern food production. Technology can expand effective carrying capacity, although access to that technology is unequal.
The costs of agricultural advancement
Agricultural technology can increase total production while making farming more expensive. Farm inputs are the resources used to produce crops or livestock. Expensive inputs include high-yield seeds, agricultural chemicals, and fossil fuels used in machinery, irrigation, transportation, and processing.
When input prices rise, the cost of agricultural production increases and farm profits may shrink. A farm can therefore produce more food and still become financially vulnerable. Changes in farming conditions—such as higher input costs, altered land-use patterns, or changing market prices—can cause farms to struggle or close.
Unequal effects on farms
Large, wealthy farms often have advantages in purchasing, machinery, storage, transportation, and access to credit. They may benefit from economies of scale, in which producing at a larger scale lowers the average cost per unit. Smaller farms may lack those advantages and find it harder to compete.
Industrial-scale food production can also increase supply and drive down global prices. Lower prices may benefit consumers, but they can reduce the revenue available to small local farms. If smaller farms close while larger farms expand, agricultural change can contribute to a wider wealth gap between smaller farms and larger, wealthier farms.
A common geographic consequence is rural-to-urban migration: people leave farming communities and move to cities because agricultural work no longer provides dependable income. The migration is associated with changes in farming conditions, not necessarily with a direct population-policy decision.
Misconception check
Misconception: “Malthus was simply wrong because the world produces enough food.” The stronger interpretation is more precise: agricultural technological advancements weakened Malthus’s prediction that population growth would inevitably outpace food production, but food availability does not guarantee equal access, farm profitability, or economic security.
Misconception: “More technology always helps every farmer.” Technology can raise production while increasing dependence on costly seeds, chemicals, fuel, machinery, and credit. The effects differ by farm size, market access, land ownership, and local economic conditions.
Retrieval check
A region adopts high-yield seeds and mechanized equipment, doubles its crop output, and then sees many small farms close as input costs rise and crop prices fall. What is the best explanation? The evidence demonstrates a weakness in Malthusian theory because agricultural technology increased food production, while expensive inputs and economies of scale disadvantaged smaller farms and encouraged rural-to-urban migration.
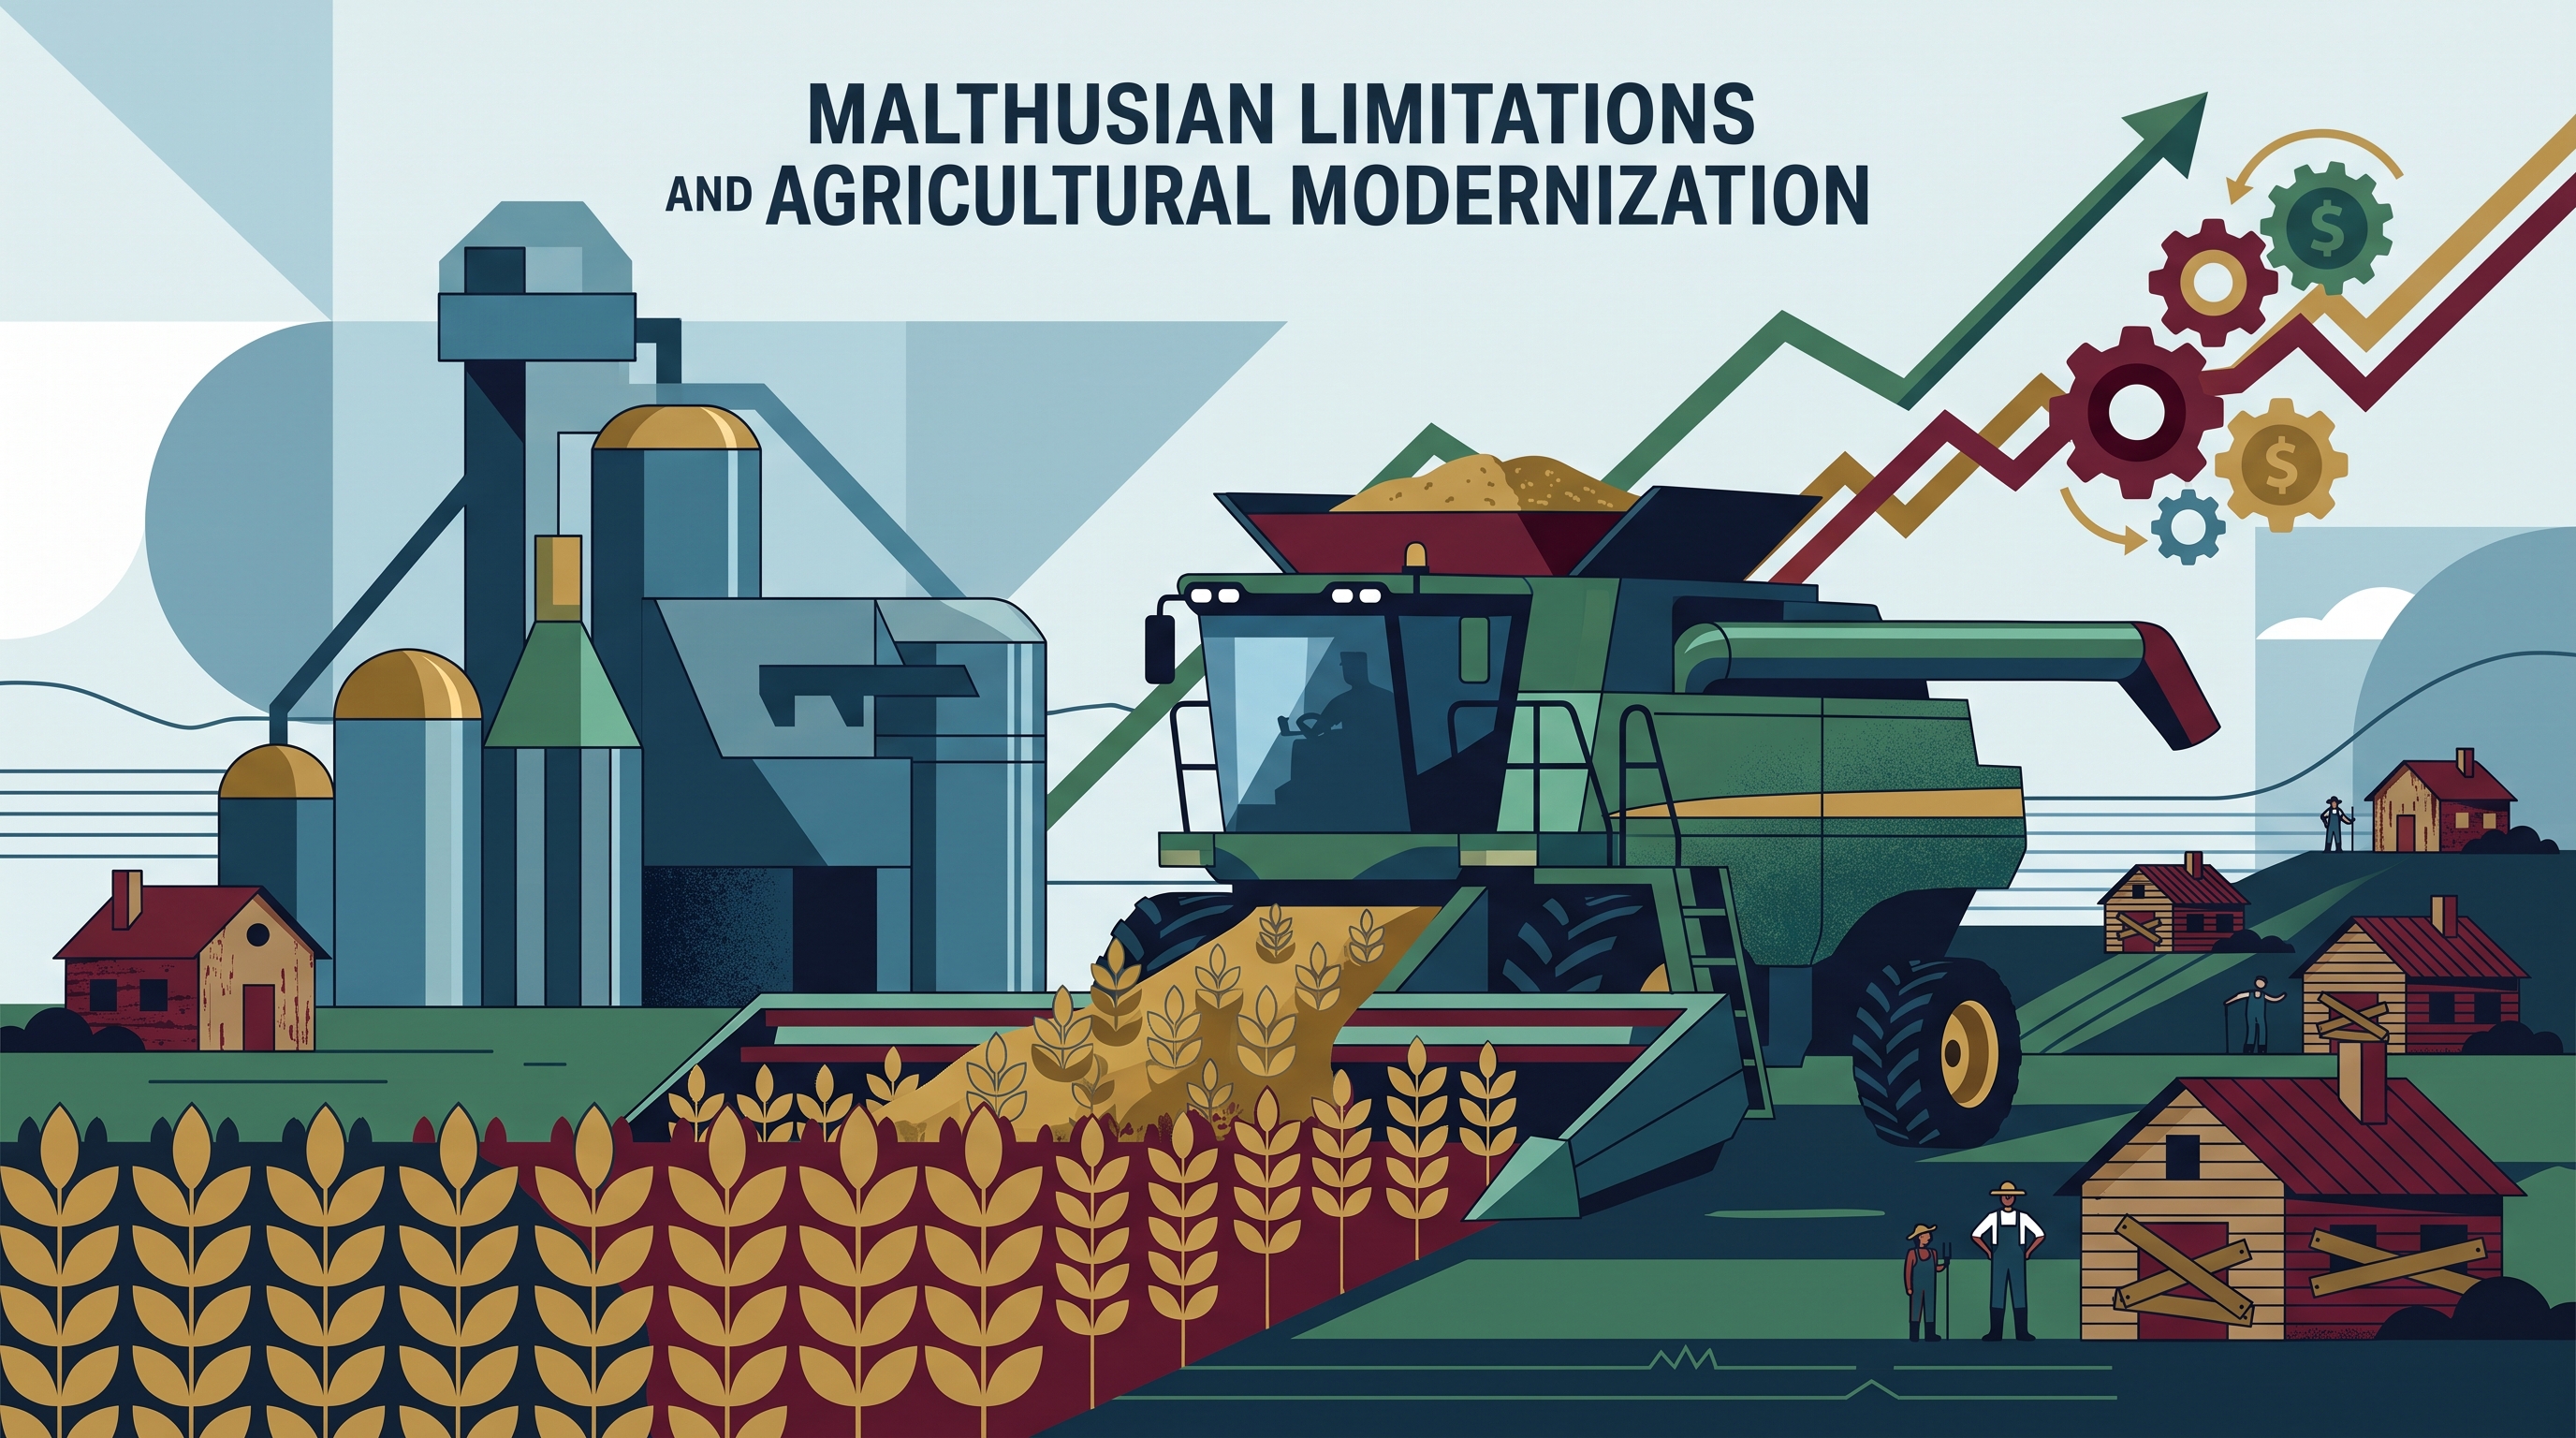
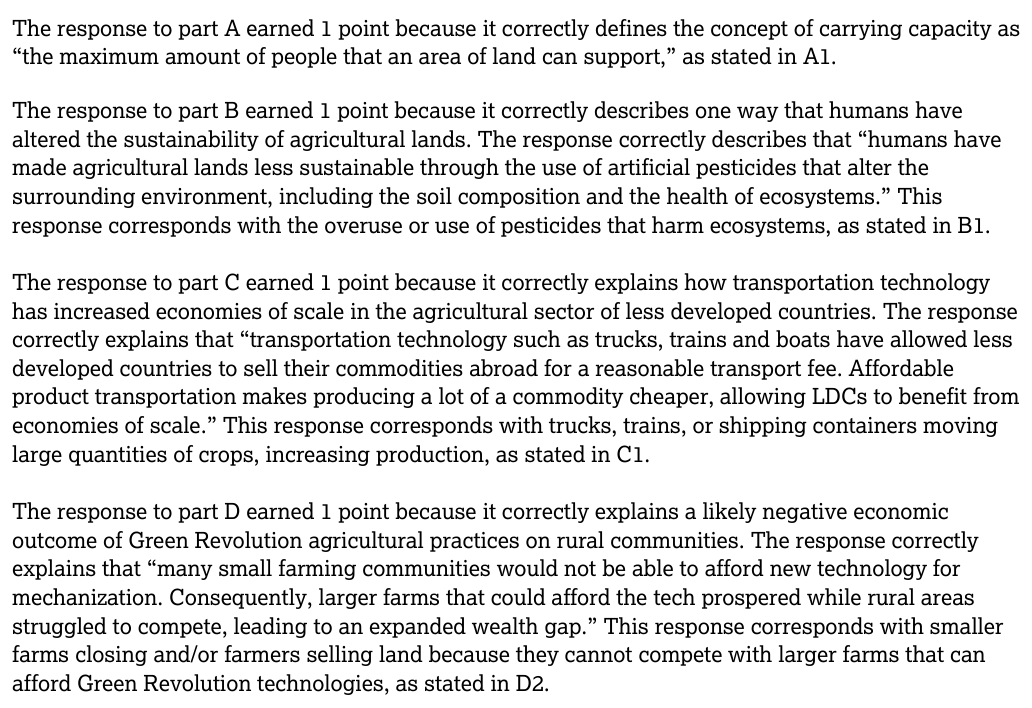
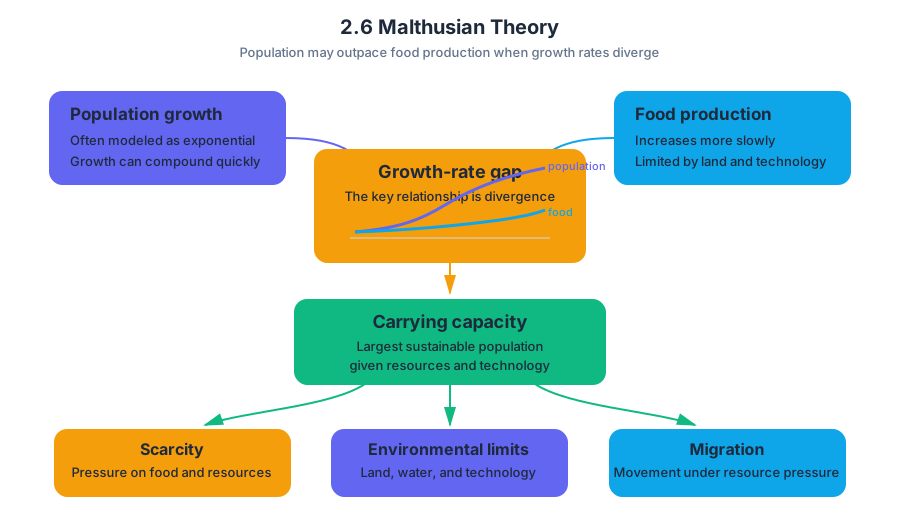
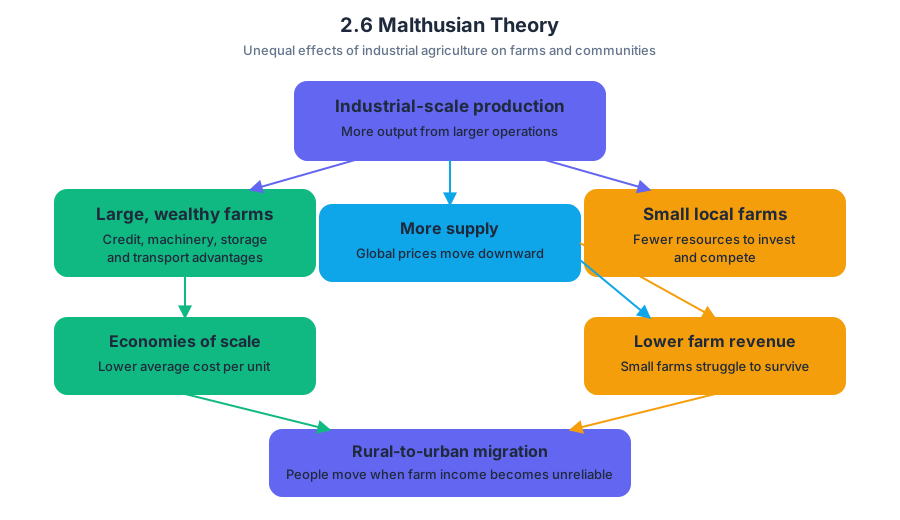
2.7 Population Policies
Key concepts: Pronatalist population policies · Antinatalist population policies · Government incentives and social programs · Population growth rates and fertility · Drivers of population decline · Women’s education, employment, and fertility · Immigration and emigration · Population pyramids and demographic planning · Limits of population pyramids for measuring immigration · Urbanization and population change
A government can change population patterns not only by counting births and deaths, but by changing the conditions under which people decide whether and when to have children.
2.7 Population Policies
A government can change population patterns not only by counting births and deaths, but by changing the conditions under which people decide whether and when to have children. Population policies are government actions intended to influence population size, growth rate, fertility, mortality, or migration.
Investigative question: When a country’s fertility rate falls and its population begins to age, can government policy reverse the trend?
CED alignment: Learning Objective 2.7.A — Explain how population policies affect fertility rates and population growth.
Essential Knowledge 2.7.A.1 — Pronatalist policies encourage population growth by increasing fertility through incentives and social programs.
Essential Knowledge 2.7.A.2 — Antinatalist policies encourage population decline or slower growth by reducing fertility.
Essential Knowledge 2.7.A.3 — Population policies may have different effects because social norms, individual choices, family structures, economic conditions, and environmental concerns influence reproductive behavior.
Pronatalist population policies
A pronatalist population policy encourages people to have more children. Governments may adopt these policies when low fertility, population aging, or population decline threatens the future labor force, tax base, consumer market, or ability to support older adults.
Common pronatalist tools include:
| Policy tool | How it may influence fertility |
|---|---|
| Paid parental leave | Allows parents to keep receiving income while caring for a child. |
| Tax incentives | Reduces the financial cost of raising children. |
| Government subsidies | Helps cover housing, medical care, or education expenses. |
| Childcare support | Makes it easier for parents to remain employed. |
| Family-friendly employment laws | Allows parents to delay returning to work or adjust work schedules. |
The central mechanism is not simply “pay people to have babies.” A more complete explanation is that parental leave, subsidized childcare, and employment protections reduce the economic and career penalties associated with childbearing. If parents can retain their jobs, receive pay while caring for children, and return to work later, the perceived cost of having a child may decrease.
Antinatalist population policies
An antinatalist population policy encourages lower fertility. Governments may use such policies when rapid population growth places pressure on food supplies, housing, schools, healthcare, employment, or environmental resources. Policies can include access to contraception, family-planning programs, public education, or legal limits on births.
Pronatalist and antinatalist policies operate in opposite demographic directions, but neither automatically produces the government’s desired result. Fertility decisions are also shaped by social expectations, religious beliefs, household finances, environmental concerns, family structures, and individual preferences.
Key distinction: A policy can encourage a demographic behavior without fully controlling it.
Why population policies may have limited effects
A pronatalist policy can affect a country’s population growth rate to a moderate or high degree, especially when it improves access to childcare, income, housing, and employment security. However, its effects may remain limited if people continue to prefer smaller families, postpone childbearing, face high living costs, or view parenthood as incompatible with career goals.
Population change also depends on more than fertility. A country’s total population may decline because of:
- Declining fertility: Fewer children are born.
- Increasing mortality: Death rates rise.
- Out-migration or emigration: More people leave than enter.
- Social or cultural factors: Education and employment opportunities may lower fertility.
- Political factors: War, conflict, or restrictive immigration policies can reduce population.
- Medical factors: Epidemics or limited healthcare can increase mortality or reduce fertility.
- Environmental factors: Disasters, pollution, or resource scarcity can push people away.
- Economic factors: Unemployment, recession, high living costs, or weak social programs can discourage childbearing.
Worked example: Suppose Country A has low fertility, a large elderly population, and many young adults moving abroad. A strong answer would not say only “the country needs a pronatalist policy.” It would explain that paid parental leave and subsidized childcare could reduce the cost of raising children, while improved employment opportunities could make parenthood more compatible with work. Because out-migration is also reducing the population, the government might additionally revise immigration policies.
Population pyramids as policy evidence
A population pyramid displays a population’s age-sex structure. Its shape helps governments anticipate future needs. A wide base indicates many children and may signal future demand for schools, pediatric healthcare, and daycare centers. A narrow base combined with a wide upper section suggests low fertility and population aging, increasing demand for eldercare, healthcare, pensions, and accessible transportation.
Population pyramids have an important limitation: they do not distinguish people born in the country from migrants, show how many people migrated, or reveal migration’s effects on particular cities. They are usually national-scale representations, so a pyramid may hide substantial immigration into one metropolitan area.
Migration to cities, economic growth, industrialization, development, and expanded transportation or communication systems can reshape population change even when national fertility remains stable. Geographic scale therefore matters: a country may be aging overall while one city gains young adult migrants and continues to grow.
Misconception check
Misconception: “A population pyramid can increase only through births.”
Correction: Population pyramids reflect births, deaths, aging, and migration. A country can gain population through immigration even when its fertility rate is low.
AP skill focus
This topic most directly develops DAT-1.A: Identify information from geographic representations, DAT-1.B: Describe spatial patterns, DAT-1.C: Explain patterns and trends, CON-2.A: Describe spatial patterns and processes, and SCALE-1.A: Identify the scales of analysis presented by geographic data. On an exam, connect the pyramid’s visible pattern to a specific policy and explain the demographic mechanism rather than naming a policy alone.
Retrieval check
A country has a narrow population-pyramid base, a growing elderly population, and rapid youth out-migration. Name one pronatalist policy and one non-pronatalist policy that could respond to these conditions. For each, explain the population problem it addresses.
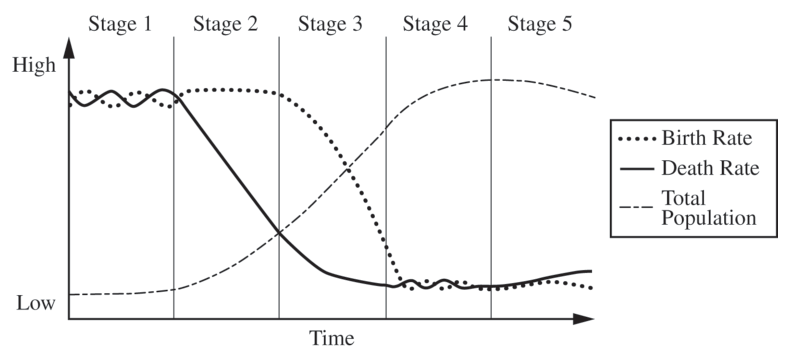
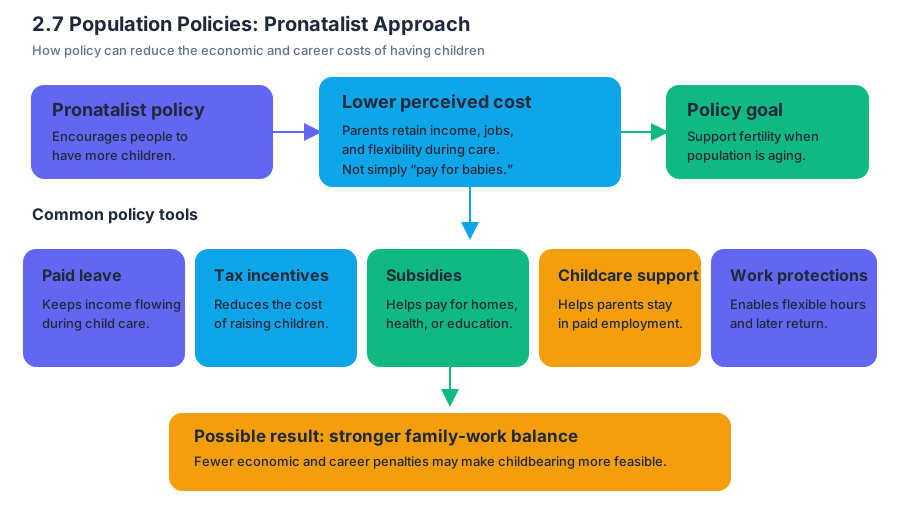
2.8 Women and Demographic Change
Key concepts: Women’s social and economic roles · Education and employment of women · Fertility and birth rates · Demographic Transition Model stages 3 and 4 · Population growth and decline · Rate of Natural Increase (RNI) · Doubling time · Age of marriage · Infant mortality and fertility · Economic effects of demographic change
When women gain greater access to education and paid employment, fertility usually declines because marriage and childbearing are often delayed, the opportunity cost of raising children increases, and families gain more control over reproductive decisions.
2.8 Women and Demographic Change
When women gain greater access to education and paid employment, fertility usually declines because marriage and childbearing are often delayed, the opportunity cost of raising children increases, and families gain more control over reproductive decisions. This relationship helps explain why population growth commonly slows as countries move from stage 3 to stage 4 of the Demographic Transition Model.
Women’s social and economic roles
A society’s expectations for women shape demographic behavior. In places where women have limited educational, occupational, and political opportunities, marriage may occur at younger ages and childbearing may begin earlier. Children may also be viewed as economic assets, especially in highly agricultural societies where they can contribute labor to farming or household production.
By contrast, education and paid employment can delay both marriage and childbearing. A student who remains in school longer or an adult pursuing a career may postpone having children. Employment can also increase women’s independence, household income, and access to health information, contraception, and family-planning services.
The relationship is not mechanical: education alone does not automatically produce low fertility. Its demographic effect is strongest when education is paired with employment opportunities, accessible health care, contraception, and social conditions that allow women to make meaningful reproductive choices.
Education, employment, and fertility
Fertility refers to the actual reproductive behavior of a population, often measured with the total fertility rate (TFR), the average number of children born to a woman during her lifetime. The crude birth rate (CBR) measures live births per $1{,}000$ people in a year, while fertility focuses more directly on childbearing patterns.
Consider two countries with similar populations. In Country A, most women marry at age $19$, work primarily in subsistence agriculture, and have limited access to contraception. In Country B, women commonly complete secondary or higher education, enter paid employment, marry later, and have reliable access to family planning. Country A will generally have higher fertility and faster population growth than Country B.
A second factor is infant mortality. When many infants die, families may have more children because they cannot be certain that all children will survive to adulthood. As infant mortality falls through improved health care, sanitation, and nutrition, families often choose fewer births while maintaining the desired number of surviving children.
Key relationship: Expanded education and employment for women are associated with lower fertility; limited social roles, early marriage, agricultural child labor, and high infant mortality are associated with higher fertility.
Stages 3 and 4 of the Demographic Transition Model
The Demographic Transition Model (DTM) connects changing birth and death rates to economic and social development. In stage 3, the death rate is already low, but the birth rate declines as urbanization, education, contraception, and changing family expectations spread. In stage 4, both birth and death rates are low, so population growth is slow, zero, or sometimes negative.
The movement from stage 3 to stage 4 often reflects changes in women’s lives. Increased education and employment can raise the age of marriage, reduce the number of years available for childbearing, and make large families less economically practical. These changes lower the birth rate even when life expectancy remains high.
Misconception check — “Stage 4 means the population immediately shrinks.” Not necessarily. A stage-4 country may continue growing because of population momentum: a large number of people may still be entering childbearing ages. Negative growth occurs only when deaths exceed live births, producing a negative Rate of Natural Increase.
Rate of Natural Increase and doubling time
The Rate of Natural Increase (RNI) measures population change from births and deaths, excluding migration. It is calculated as:
$$ \text{RNI} = \text{crude birth rate} - \text{crude death rate} $$
If a country has a crude birth rate of $24$ per $1{,}000$ people and a crude death rate of $9$ per $1{,}000$, its difference is $15$ per $1{,}000$, or approximately $1.5%$ natural increase. If births are $7$ per $1{,}000$ and deaths are $11$ per $1{,}000$, the RNI is $-4$ per $1{,}000$, or approximately $-0.4%$; the population is declining naturally.
A high RNI generally produces a short doubling time, the time required for a population to double if its growth rate remains constant. A low RNI produces a long doubling time. The “rule of $70$” gives an estimate:
$$ \text{Doubling time} \approx \frac{70}{\text{annual growth rate in percent}} $$
For an annual growth rate of $2%$, doubling time is approximately $\frac{70}{2}=35$ years. At $0.5%$, it is approximately $140$ years.
Population change and economic effects
Population change creates short- and long-term economic consequences. Rapid growth can expand the labor force and consumer market, but it can also strain schools, housing, health care, food systems, and infrastructure. Negative growth can reduce the available workforce and increase government spending on pensions, health care, and other support for older residents.
Skill connections: Topic 2.8 draws especially on Skill 2.C: Spatial Relationships, when explaining how demographic conditions vary between places; Skill 3.B: Data Analysis, when describing population patterns and trends; Skill 3.D: Data Analysis, when comparing demographic data; and Skill 3.F: Data Analysis, when identifying limitations in demographic data. The topic’s required content includes IMP-2.B.1, which connects women’s social and economic roles to population change.
Retrieval check
A country’s birth rate falls from $30$ to $15$ per $1{,}000$, while its death rate remains $8$ per $1{,}000$. What happens to its RNI and doubling time? The RNI falls from $22$ to $7$ per $1{,}000$; natural growth continues, but doubling time becomes longer because population growth has slowed.
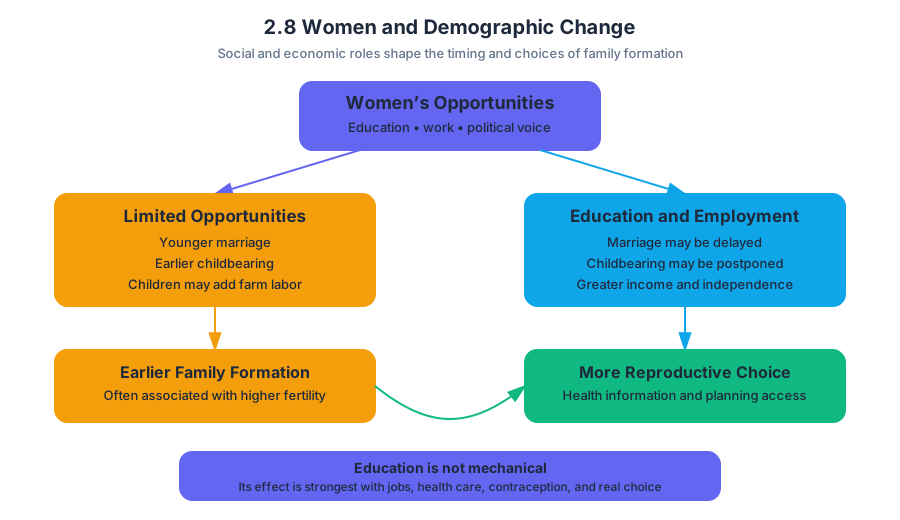
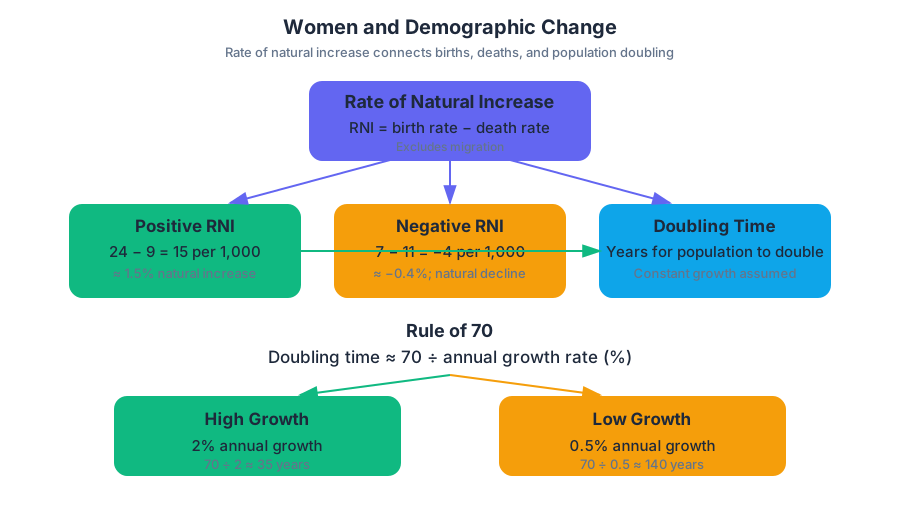
2.9 Aging Populations
Key concepts: Aging populations
An aging population is one in which the proportion of older people increases relative to the total population. The change can result from longer lives, fewer births, or the movement of younger adults away from a place—and it can reshape labor markets, public budgets, family life, and political priorities.
2.9 Aging Populations
An aging population is one in which the proportion of older people increases relative to the total population. The change can result from longer lives, fewer births, or the movement of younger adults away from a place—and it can reshape labor markets, public budgets, family life, and political priorities.
Investigative question: Why can a country become “older” even when its elderly population is not growing rapidly?
The population pyramid tells the story
A population pyramid displays a population’s age-sex structure. When the base becomes narrow, fewer children are entering the population; when the upper sections widen, more people are surviving into older ages. Together, these changes raise the median age—the age at which half the population is younger and half is older.
Under CED 2.9.A, aging populations are associated with demographic patterns such as declining fertility and increasing life expectancy. A population may age from both ends of the age structure:
- fewer births shrink the younger cohorts;
- improved health care, nutrition, and living conditions allow more people to survive to old age;
- the resulting larger share of older people increases the population’s dependency needs.
The key measurement is proportion, not simply the number of older residents. If a country has $10$ million older people in a population of $100$ million, older adults represent $10%$ of the population. If births decline and the total population falls to $80$ million while the older population remains $10$ million, the older share rises to $12.5%$ even without an increase in the absolute number of older people.
Why fertility matters
Low fertility has a powerful aging effect because each younger cohort is smaller than the one before it. In a country where families have an average of fewer than approximately $2.1$ children per woman—the rough replacement-level fertility rate in many developed settings—the population may eventually experience a negative rate of natural increase, especially if immigration does not offset the difference between births and deaths.
Worked example: Japan. Imagine a population pyramid with a narrow base, relatively large middle-aged cohorts, and a broad upper section. The narrow base indicates that Japan’s recent fertility has declined. The large upper cohorts show that many people have survived into old age. The correct geographic interpretation is not merely “Japan has many elderly people”; it is that low fertility and high life expectancy have changed the proportions of the entire age structure.
The causes of population aging
Under CED 2.9.B, three mechanisms are especially important:
| Mechanism | How it ages a population | Typical geographic pattern |
|---|---|---|
| Declining fertility | Reduces the size of younger cohorts | Common in highly urbanized and economically developed countries |
| Increased life expectancy | Expands the number surviving to older ages | Often linked to improved medical care and living conditions |
| Out-migration of younger people | Removes working-age adults and sometimes their children | Common in rural regions and places with limited employment |
The third mechanism explains why aging is not only a national issue. A rural district can age rapidly when young adults leave for universities or jobs elsewhere. Even if older residents do not live longer than before, the departure of younger people raises the local percentage of elderly residents.
Named misconception — “Aging means everyone is living longer.”
Longer life expectancy is one cause, but it is not the only one. A place can age because fewer children are born or because young adults migrate out. Always identify the demographic process shown by the evidence.
Consequences of an aging population
Under CED 2.9.C, aging produces economic, social, and political consequences.
- Economic: A shrinking working-age population may create labor shortages and reduce the number of workers supporting pension and health-care systems. Governments may raise taxes, delay retirement, encourage immigration, or invest in automation.
- Social: Demand increases for hospitals, long-term care, accessible housing, and transportation. Families may face greater caregiving responsibilities.
- Political: Older voters may influence spending priorities, pension policy, health care, and immigration debates. Political leaders must balance services for older adults with investments in education, employment, and children.
A useful indicator is the dependency ratio, which compares economically dependent age groups with the working-age population. A simplified form is
$$ \text{Dependency ratio} = \frac{\text{young dependents}+\text{older dependents}} {\text{working-age population}} \times 100. $$
An aging population raises the old-age component because more people are in later-life cohorts relative to the working-age group.
AP geographic reasoning
This topic most directly develops SPS-2.A: Describe spatial patterns, SPS-2.B: Explain spatial relationships, IMP-2.A: Explain how demographic processes influence patterns and outcomes, and DATA-1.A: Identify information presented in a map, chart, table, or graph. A strong response identifies the visible age structure, names the demographic cause, and connects it to a specific consequence rather than listing unrelated effects.
Retrieval check: A rural province has a falling birth rate, a rising share of residents over age $65$, and a large outflow of people ages $20$–$34$. Name two causes of its aging population and explain one economic consequence. A complete answer should identify declining fertility and younger-adult out-migration, then connect the pattern to a smaller labor force, labor shortages, or increased pressure on support systems.
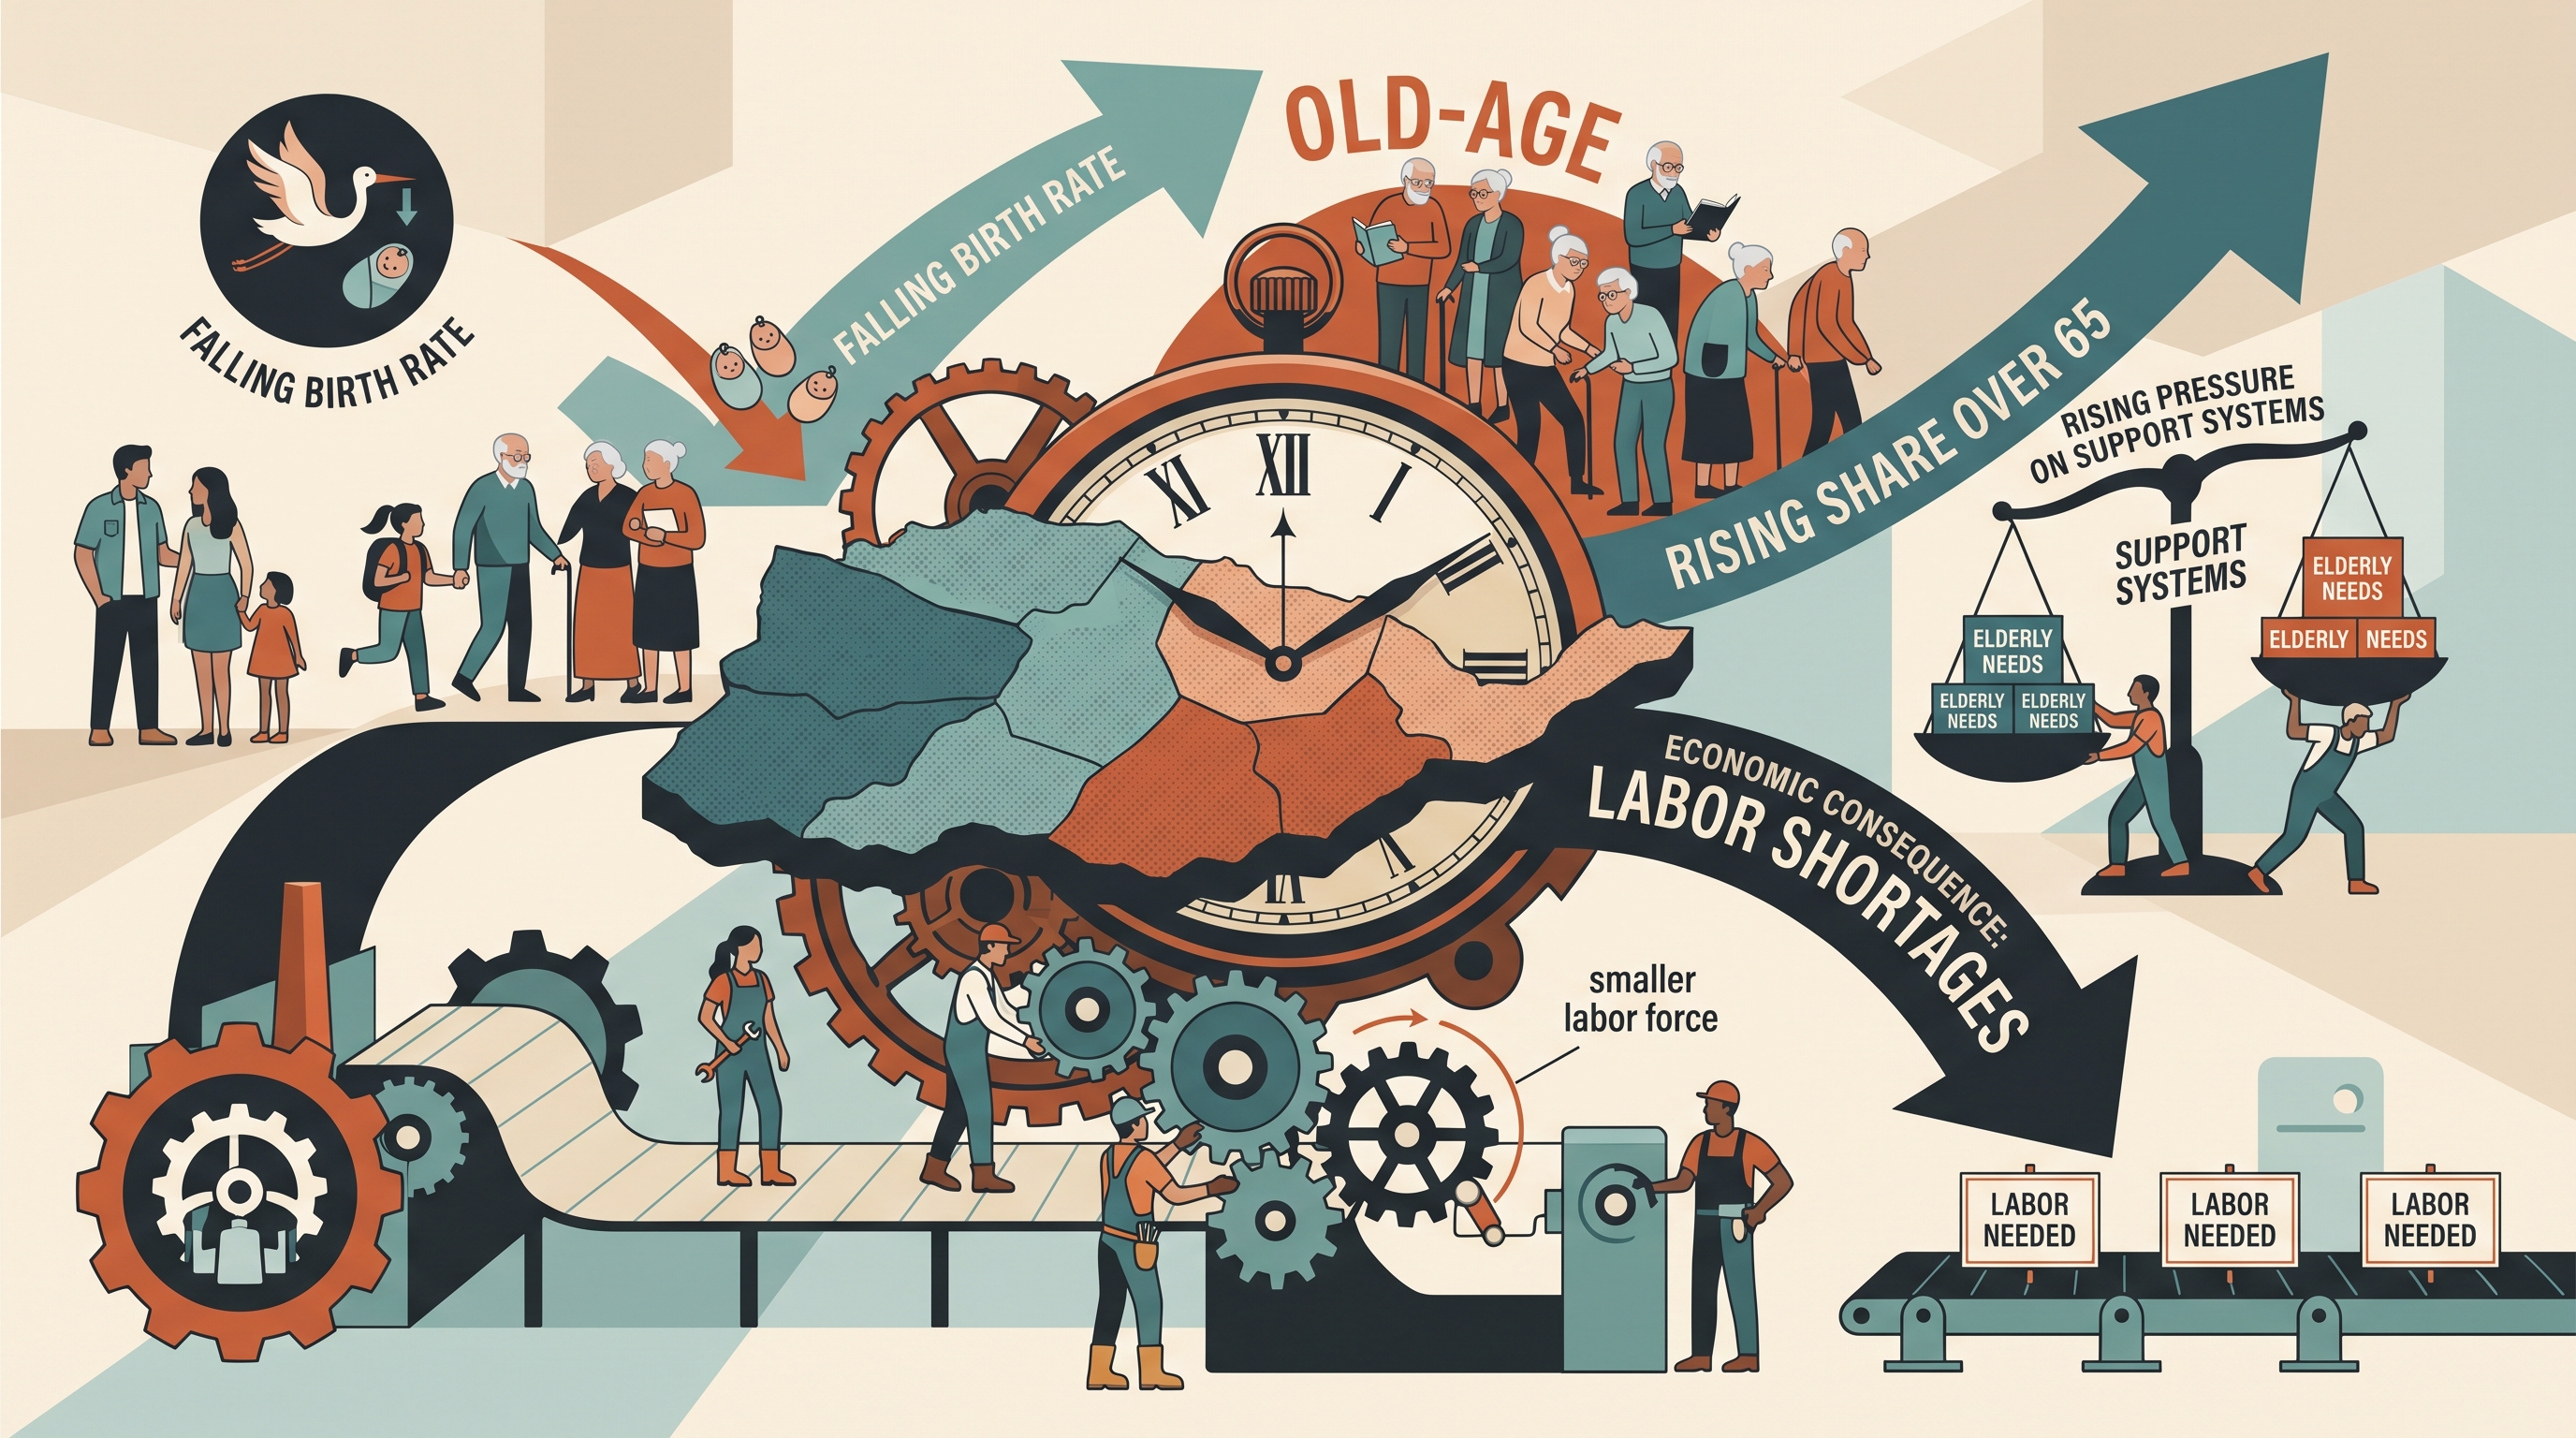
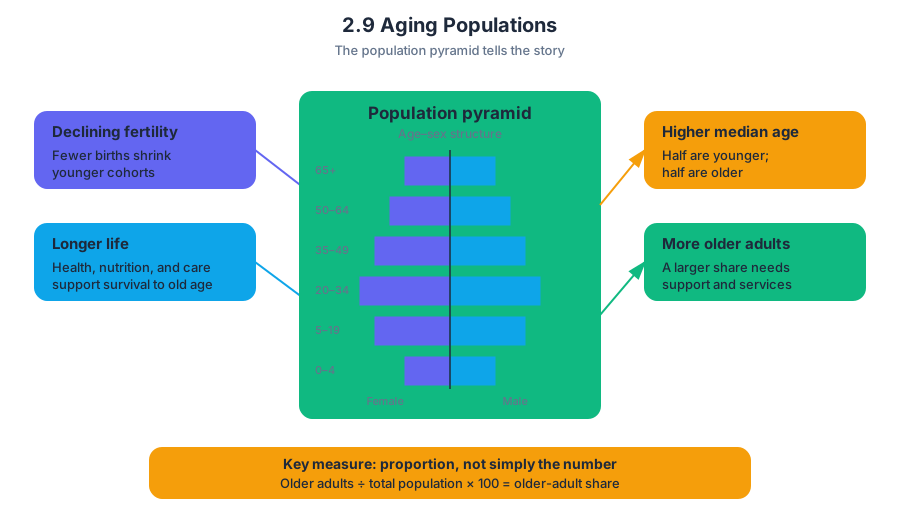
2.10 Causes of Migration
Key concepts: Seasonal migration · Transhumance · Pastoral nomadism · Resource availability · Grazing plants · Water access · Arid environments · Sahel region · Seasonal environmental conditions · Migration routes
In the Sahel, a herd cannot graze in one place indefinitely because rainfall, grazing plants, and water access shift across space and through the seasons.
2.10 Causes of Migration
In the Sahel, a herd cannot graze in one place indefinitely because rainfall, grazing plants, and water access shift across space and through the seasons. Migration is therefore often an environmental strategy: people move livestock toward temporarily available resources and away from areas that have become dry or depleted.
Learning Objective 2.10.A: Explain the causes and effects of migration.
Essential Knowledge 2.10.A.1: Push and pull factors influence migration.
Essential Knowledge 2.10.A.2: Environmental factors, including climate and natural disasters, can cause migration.
Seasonal movement in an arid environment
Seasonal migration is movement that occurs at a particular time of year in response to predictable conditions. In the Sahel, pastoralists may move south during the dry season, where rainfall and vegetation may be more available, and then return north during the wet season as rain renews grazing resources.
The pattern is not random. It follows a resource calendar:
- Wet season: Rainfall supports new vegetation and replenishes water sources farther north.
- Dry season begins: Grass dries, surface water disappears, and herders move toward areas with greater rainfall or more reliable water.
- Grazing pressure shifts: Livestock use plants in the destination area while the previous grazing area recovers.
- Next wet season: Renewed rainfall makes return movement possible.
This is a geographic example of a push factor—a condition encouraging departure, such as drying pasture—and a pull factor—a condition attracting movement, such as fresh grazing plants or accessible water. The same location can change from a pull factor during the wet season to a push factor during the dry season.
Transhumance and pastoral nomadism
Pastoralists are people whose livelihoods depend substantially on raising livestock. Transhumance is the specific, recurring seasonal movement of livestock and pastoralists between established grazing areas, often between wet-season and dry-season pastures.
Pastoral nomadism is a livelihood based on moving herds between temporary grazing and watering areas, often by following seasonal resource availability. The distinction matters: transhumance emphasizes a predictable cyclical route between known areas, while pastoral nomadism is a broader mobile way of life in which movement may be more flexible as resource conditions change.
| Term | What it emphasizes | Sahel example |
|---|---|---|
| Pastoralist | Livelihood based on livestock | A herder raising cattle, goats, sheep, or camels |
| Transhumance | Regular seasonal movement | Moving south in the dry season and north in the wet season |
| Pastoral nomadism | Mobile livestock-based livelihood | Moving herds among temporary pasture and watering sites |
The movement protects the herd and manages land. If livestock remain in one area year-round, they may remove too much grass cover, compact soil, and exhaust water sources. Moving allows previously used grazing resources to recover or be renewed before animals return.
Worked example: explaining a migration map
Suppose a map shows herders moving south during the dry season and north during the wet season. A complete explanation would connect direction, season, and resources:
During the dry season, pastoralists move south toward areas with greater rainfall and more available grazing plants and water. During the wet season, they move north as rainfall renews vegetation and water sources there. This seasonal movement also prevents year-round grazing from exhausting one location.
Notice what makes the explanation geographic: it does not merely say “people move because of climate.” It identifies the physical environmental condition—seasonally distributed rainfall—and links it to the spatial distribution of vegetation, water, livestock grazing, and human movement.
Resource access and changing routes
Migration routes depend on access, not only on climate. A newly restricted protected area, for example, may close a traditional passage to a watering site or grazing plants. That restriction reduces the resources available along the old route, so herders may be forced to reroute, shorten the movement cycle, or stop moving through the area altogether.
This can create pressure elsewhere: livestock concentrated on fewer accessible pastures may increase competition for grazing plants and water and may contribute to overgrazing. Thus, a change in land management can alter a migration pattern by changing the resource geography on which that pattern depends.
Misconception check
Misconception: “All migration is permanent relocation.” Seasonal movement in the Sahel is often temporary and repeated. The purpose is not necessarily to abandon one place, but to follow changing resources and maintain access to pasture and water over an annual cycle.
AP skill connection — Skill Category 2: Spatial Relationships, especially 2.A Describe spatial patterns and 2.B Explain spatial relationships: A strong response describes the direction and season of movement, then explains the relationship between rainfall, vegetation, water access, and grazing. It also applies Skill Category 1: Concepts and Processes by using terms such as transhumance, pastoral nomadism, push factors, and pull factors precisely.
Retrieval check
A map shows livestock moving north after several months of rainfall. What resource-based explanation best fits the pattern? Answer in one sentence using seasonal migration, grazing plants, and water access.
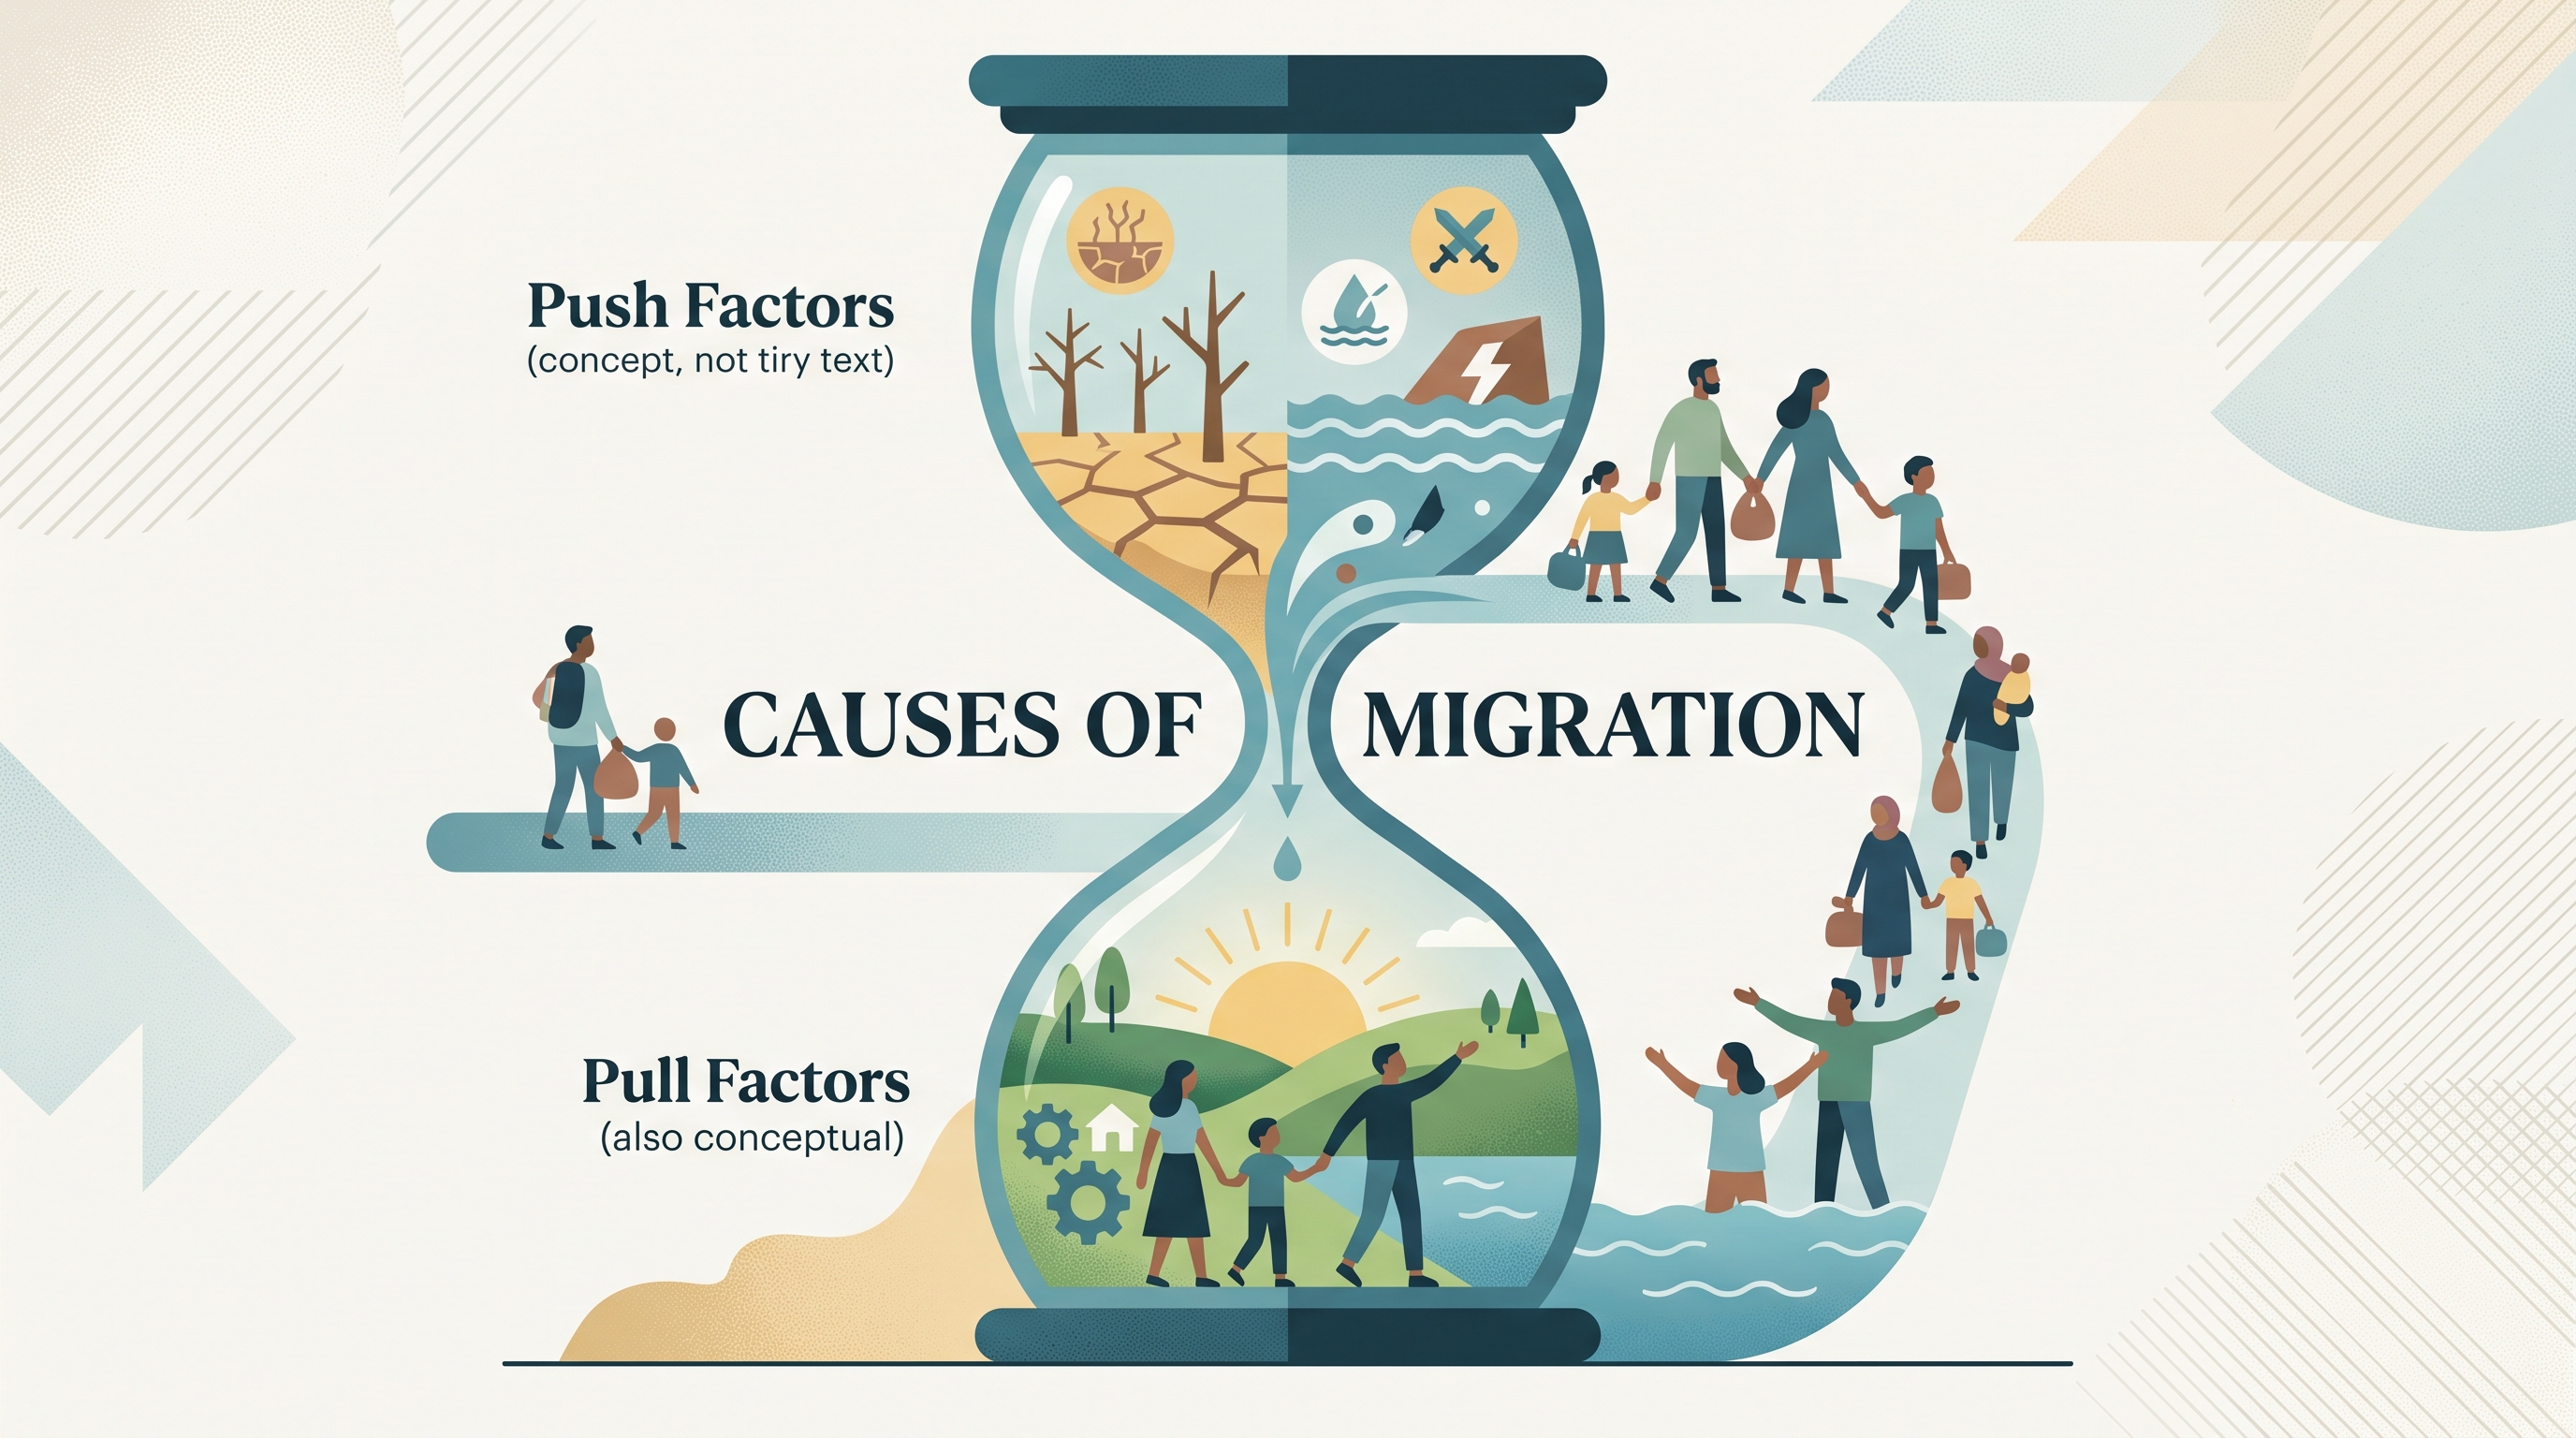
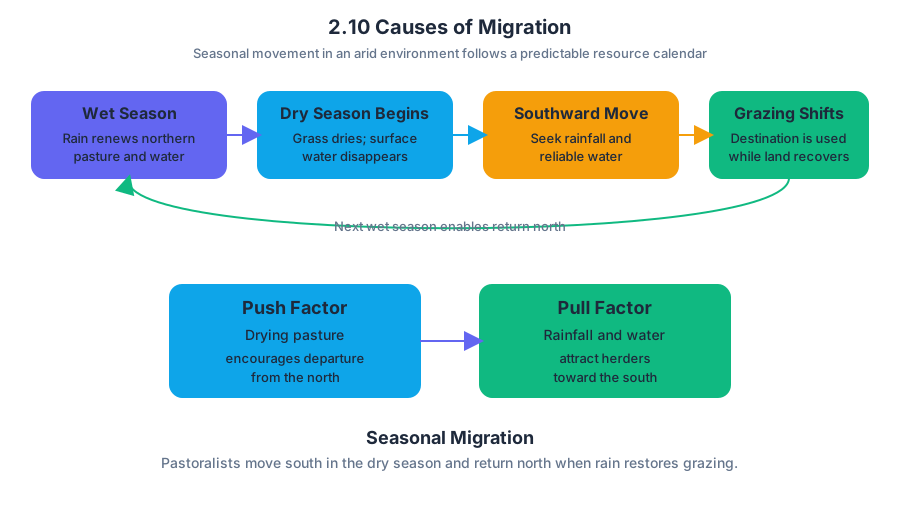
2.11 Forced and Voluntary Migration
Key concepts: Forced migration · Voluntary migration · Refugees · Internally displaced persons (IDPs) · Asylum seekers · Slavery · Chain migration · Family migration · Guest workers · Brain drain
Migration is not one uniform process: some people move because they choose or are able to pursue a different opportunity, while others move because remaining where they are has become impossible or unsafe.
2.11 Forced and Voluntary Migration
Migration is not one uniform process: some people move because they choose or are able to pursue a different opportunity, while others move because remaining where they are has become impossible or unsafe. That distinction—forced migration versus voluntary migration—helps explain who moves, where they go, and how migration networks form.
Learning Objective IMP-2.D: Describe types of forced and voluntary migration.
Essential Knowledge IMP-2.D.1: Forced migrations include slavery and events that produce refugees, internally displaced persons, and asylum seekers.
Essential Knowledge IMP-2.D.2: Types of voluntary migrations include transnational, transhumance, internal, chain, step, guest worker, and rural-to-urban migration.
Forced migration: movement under compulsion
Forced migration occurs when people must leave because of coercion, violence, persecution, disaster, or another circumstance that removes meaningful choice. The key geographic question is not simply Did the person cross a border? but What conditions compelled the movement, and what legal or spatial status followed?
| Term | Meaning | Border crossed? | Typical circumstance |
|---|---|---|---|
| Refugee | A person forced to leave their country because of conflict, persecution, or comparable danger | Yes | War or political persecution |
| Internally displaced person (IDP) | A person forced from home but still within the country of origin | No | Civil war or internal violence |
| Asylum seeker | A person who has crossed an international border and requested protection, but whose claim has not yet been legally decided | Yes | Seeking refuge from persecution |
| Slave | A person compelled into forced labor or captivity and denied freedom of movement | Not required | Trafficking, conquest, or an institutionalized system of slavery |
The categories can change as a person moves. Someone displaced by violence may first become an IDP after fleeing to another region of the same country. If that person later crosses an international boundary, they may seek asylum; while the claim is being evaluated, the person is an asylum seeker, and if protection is granted, the person may be recognized as a refugee.
The Lost Boys of Sudan: a spatial sequence
The experience of the Lost Boys of Sudan demonstrates how forced migration can unfold across multiple scales. During the Sudanese civil war, many young boys were separated from their families and fled violence. They traveled on foot in large groups through parts of Africa, often spending years in refugee camps before some were eventually resettled in the United States.
The pattern can be represented as a movement chain:
Sudan → neighboring regions of Africa → refugee camps → United States
This sequence matters because it distinguishes origin, intermediate locations, and final destination. The boys did not simply make a single voluntary relocation for a better job; violence produced displacement, neighboring regions became temporary destinations, and international resettlement created a later migration step.
Misconception check — “Every forced migrant is a refugee.” Not necessarily. A person displaced within national borders is an IDP, not a refugee. A person who crosses a border and requests protection is an asylum seeker until the claim receives a legal determination. Slavery is also forced migration or forced movement, but it is not accurately described as ordinary relocation chosen by the migrant.
Voluntary migration: movement through choice or opportunity
Voluntary migration occurs when people move by choice, even though economic pressure, family responsibilities, or limited opportunities may strongly influence that choice. “Voluntary” does not mean equally free or easy; it means the movement is not directly compelled by captivity, persecution, or immediate physical coercion.
| Type | Geographic pattern | Example |
|---|---|---|
| Transnational migration | Movement across an international boundary | A worker moving from Nepal to Qatar |
| Transhumance | Seasonal movement between ecological or climate zones | Herders moving livestock between summer and winter pastures |
| Internal migration | Movement within a country | A household moving from one province to another |
| Chain migration | Movement facilitated by connections to people who migrated earlier | Relatives joining an established community abroad |
| Step migration | Movement through a series of intermediate destinations | Village to small town to regional city to national capital |
| Guest-worker migration | Temporary movement for employment | A foreign worker recruited for a construction project |
| Rural-to-urban migration | Movement from rural areas to cities | Farmers relocating to a metropolitan area for factory or service work |
Networks, families, and labor
Chain migration is migration facilitated by connections to people who previously migrated. Earlier migrants reduce information costs by sharing knowledge about jobs, housing, transportation, language, and legal procedures. As a result, migration often produces a spatial cluster: one destination attracts additional migrants from the same village, region, family, or ethnic community.
Family migration is movement intended to connect or reunify separated family members. It may overlap with chain migration, but the concepts emphasize different mechanisms: chain migration highlights the network effect, while family migration highlights the purpose of reunification.
Guest workers migrate for economic opportunities, usually under temporary or conditional arrangements. By contrast, brain drain is the migration of people with technological or specialized skills from one country or region to another. A country may lose trained doctors, engineers, or researchers even while receiving remittances from migrants abroad.
Applying spatial relationships
AP Skill 1.B — Explain spatial relationships: Connect a migration pattern to the relationships among places. For example, a guest-worker flow from South Asia to the Persian Gulf reflects a relationship between labor supply in the origin region and employment demand in the destination. Chain migration adds another relationship: existing migrant networks make particular destinations more accessible.
AP Skill 2.B — Explain spatial patterns: Use the arrangement of migration flows to infer a process. A step-migration pattern suggests movement through an urban hierarchy; a concentrated cluster of migrants suggests chain migration; movement across several countries followed by resettlement suggests forced displacement followed by refugee protection or asylum.
Retrieval check: A family leaves its village, spends two years in a regional city, and then settles in the national capital after relatives help them find housing. Identify the voluntary migration types present.
Answer: The movement is step migration because it occurs through intermediate destinations, internal migration because it remains within one country, and chain migration because relatives facilitated the final settlement.
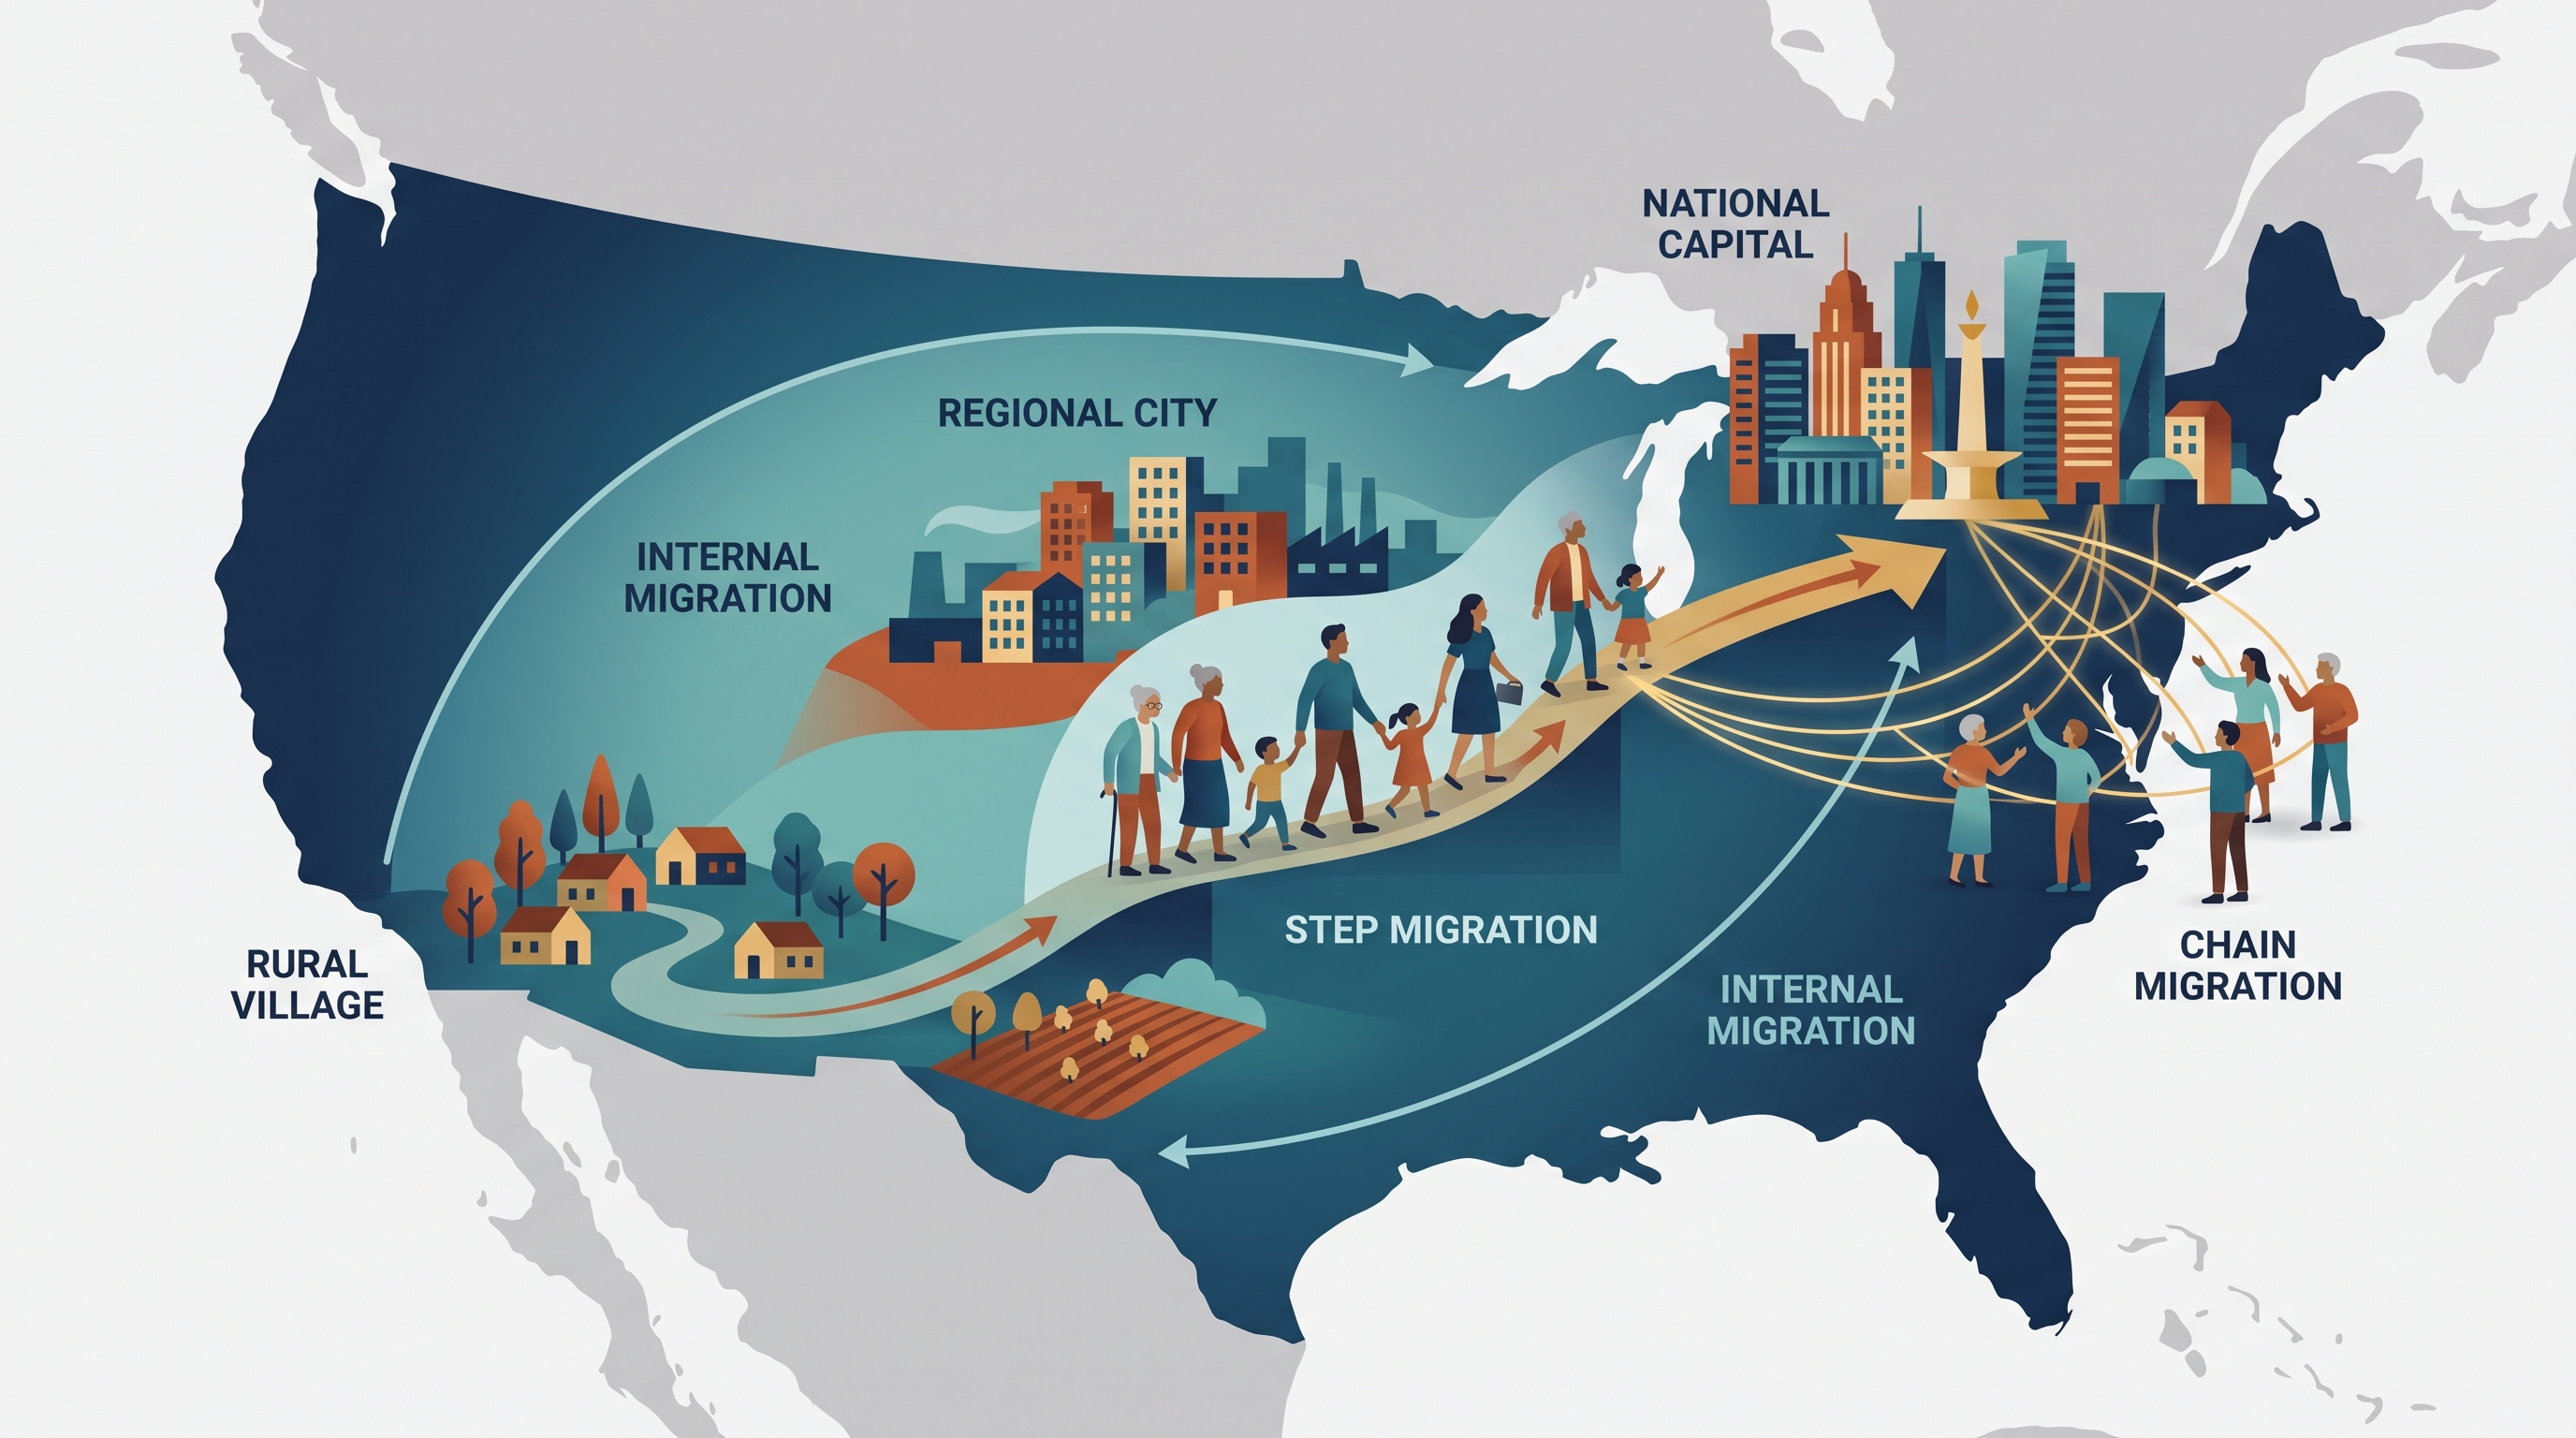
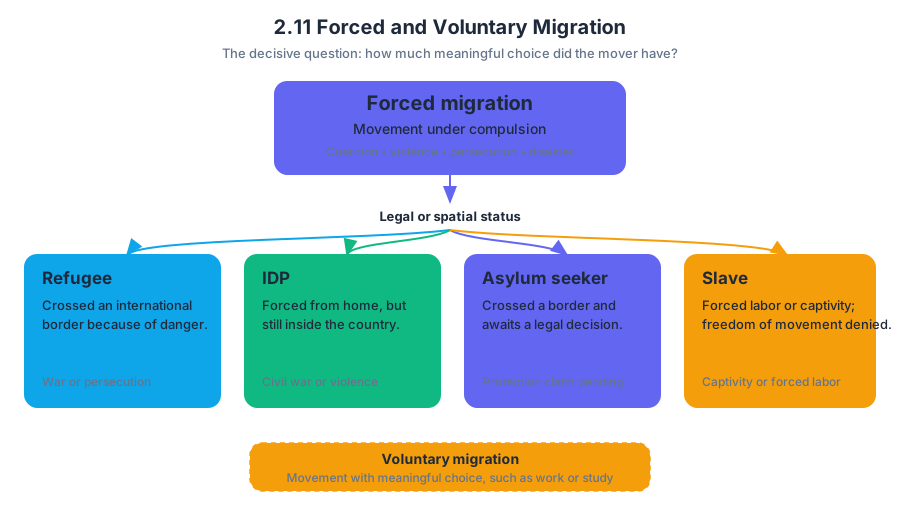
2.12 Effects of Migration
Key concepts: In-migration · Out-migration · Labor force · Entrepreneurship · Economic development · Employment and wages · Tax revenues · City infrastructure · Quality of life · Social development
A city can gain workers, businesses, and tax revenue when people move in—but it can also face housing and infrastructure pressure. When people move out, the same city may lose employees, customers, investment, and public revenue.
2.12 Effects of Migration
A city can gain workers, businesses, and tax revenue when people move in—but it can also face housing and infrastructure pressure. When people move out, the same city may lose employees, customers, investment, and public revenue. The effects of migration are therefore measured through changes in employment, wages, businesses, unemployment, tax revenues, infrastructure, and quality of life.
CED alignment: Learning Objective 2.12.A: Explain the effects of migration. Essential Knowledge identifiers: 2.12.A.1 and 2.12.A.2.
In-migration and the urban economy
In-migration is movement into a place. Migrants can enlarge a city’s labor force, meaning the people available to work, and can increase economic productivity when their skills match local needs. A growing workforce can support economic development because businesses have more potential employees, while the larger population creates demand for shops, housing, transportation, education, and health services.
Migration can also produce entrepreneurship, the creation or expansion of businesses. A migrant who opens a restaurant, repairs homes, or develops a technology company does more than earn personal income: the business may employ other residents, purchase supplies, attract customers, and generate additional local spending. This chain of related economic activity is a multiplier effect.
A larger population may expand a city’s tax base, the people and property from which government collects revenue. New residents may contribute sales, income, and property taxes, helping fund transportation, schools, sanitation, health care, and other public programs. Migration may also increase demand for residential and commercial property, raising real-estate values—but higher demand can make housing less affordable if construction and infrastructure do not keep pace.
Employment and wages
Migration does not produce one universal wage outcome. In-migration increases the supply of workers, so wages may grow more slowly—or temporarily fall—in occupations where many qualified workers compete for the same jobs. However, if migrants fill severe labor shortages, businesses may expand, remain open, or become more productive; strong demand for scarce skills can raise wages in those occupations.
Out-migration can have the reverse effects. When workers leave, labor shortages may push wages upward for workers who remain in some sectors. Yet out-migration can also weaken the wider economy: businesses may close, customers disappear, investment declines, and unemployment may rise when people lose manufacturing jobs or cannot find similarly paid work in another sector. Higher unemployment can reduce tax revenues and further limit public services.
Out-migration and financial health
Out-migration is movement away from a place. A city experiencing out-migration may lose part of its labor force, customer base, tax base, and local investment. Fewer workers can reduce production; fewer residents can reduce sales and property-tax collections; and vacant homes or commercial buildings can lower property values. These interconnected losses are sometimes described as backwash effects.
Both in-migration and out-migration can create public-spending challenges. In-migration may require governments to expand housing, schools, transportation, utilities, and health care. Out-migration may leave governments with fewer taxpayers while they still must maintain roads, water systems, schools, and other infrastructure designed for a larger population.
Infrastructure and quality of life
High-quality infrastructure—including public utilities, transportation, housing, schools, commercial buildings, and health care—can improve residents’ quality of life. Reliable water, sewage, electricity, and medical services support public health and sanitation, while transportation and communications connect people to jobs, education, goods, and services.
Insufficient infrastructure can create housing shortages, inadequate public utilities, pollution, and poor sanitation. These conditions may inhibit social development because residents have less reliable access to health care, education, employment, and safe living conditions.
Worked example: tracing the effects
Suppose a manufacturing city loses factories and many residents leave to search for similarly paid employment. The immediate change is out-migration: the labor force and consumer population shrink. Businesses lose customers, property values may weaken, unemployment may increase among workers who remain, and reduced sales, income, and property taxes can limit funding for infrastructure. The result is a reinforcing cycle of economic decline rather than a single isolated effect.
Named misconception — “More migrants always help or always hurt.” The outcome depends on conditions. Migrants may strengthen a city when they fill labor shortages, start businesses, and expand the tax base; the same city may experience strain when housing, utilities, schools, and health services cannot accommodate rapid population growth. Strong answers explain the mechanism, not merely label migration as positive or negative.
AP skills in action
This topic most directly uses Skill 1.B: Describe geographic concepts, processes, and models, by accurately distinguishing in-migration, out-migration, labor force, and tax base; Skill 2.B: Explain spatial relationships, by connecting migration to employment, businesses, infrastructure, and city finances; and Skill 3.C: Explain patterns and trends in geographical data, when interpreting changes in population, unemployment, wages, or tax revenue. At different scales, Skill 5.B: Describe the scale of analysis, helps distinguish effects on a household, city, region, or national economy.
Retrieval check
A city receives many new workers, but its housing supply and sewage system do not expand. Identify one likely economic benefit, one likely infrastructure problem, and one possible wage effect. A strong response might state: the labor force and tax base may grow; housing shortages and poor sanitation may result; and wages may moderate in occupations with abundant workers but rise where migrants fill labor shortages.
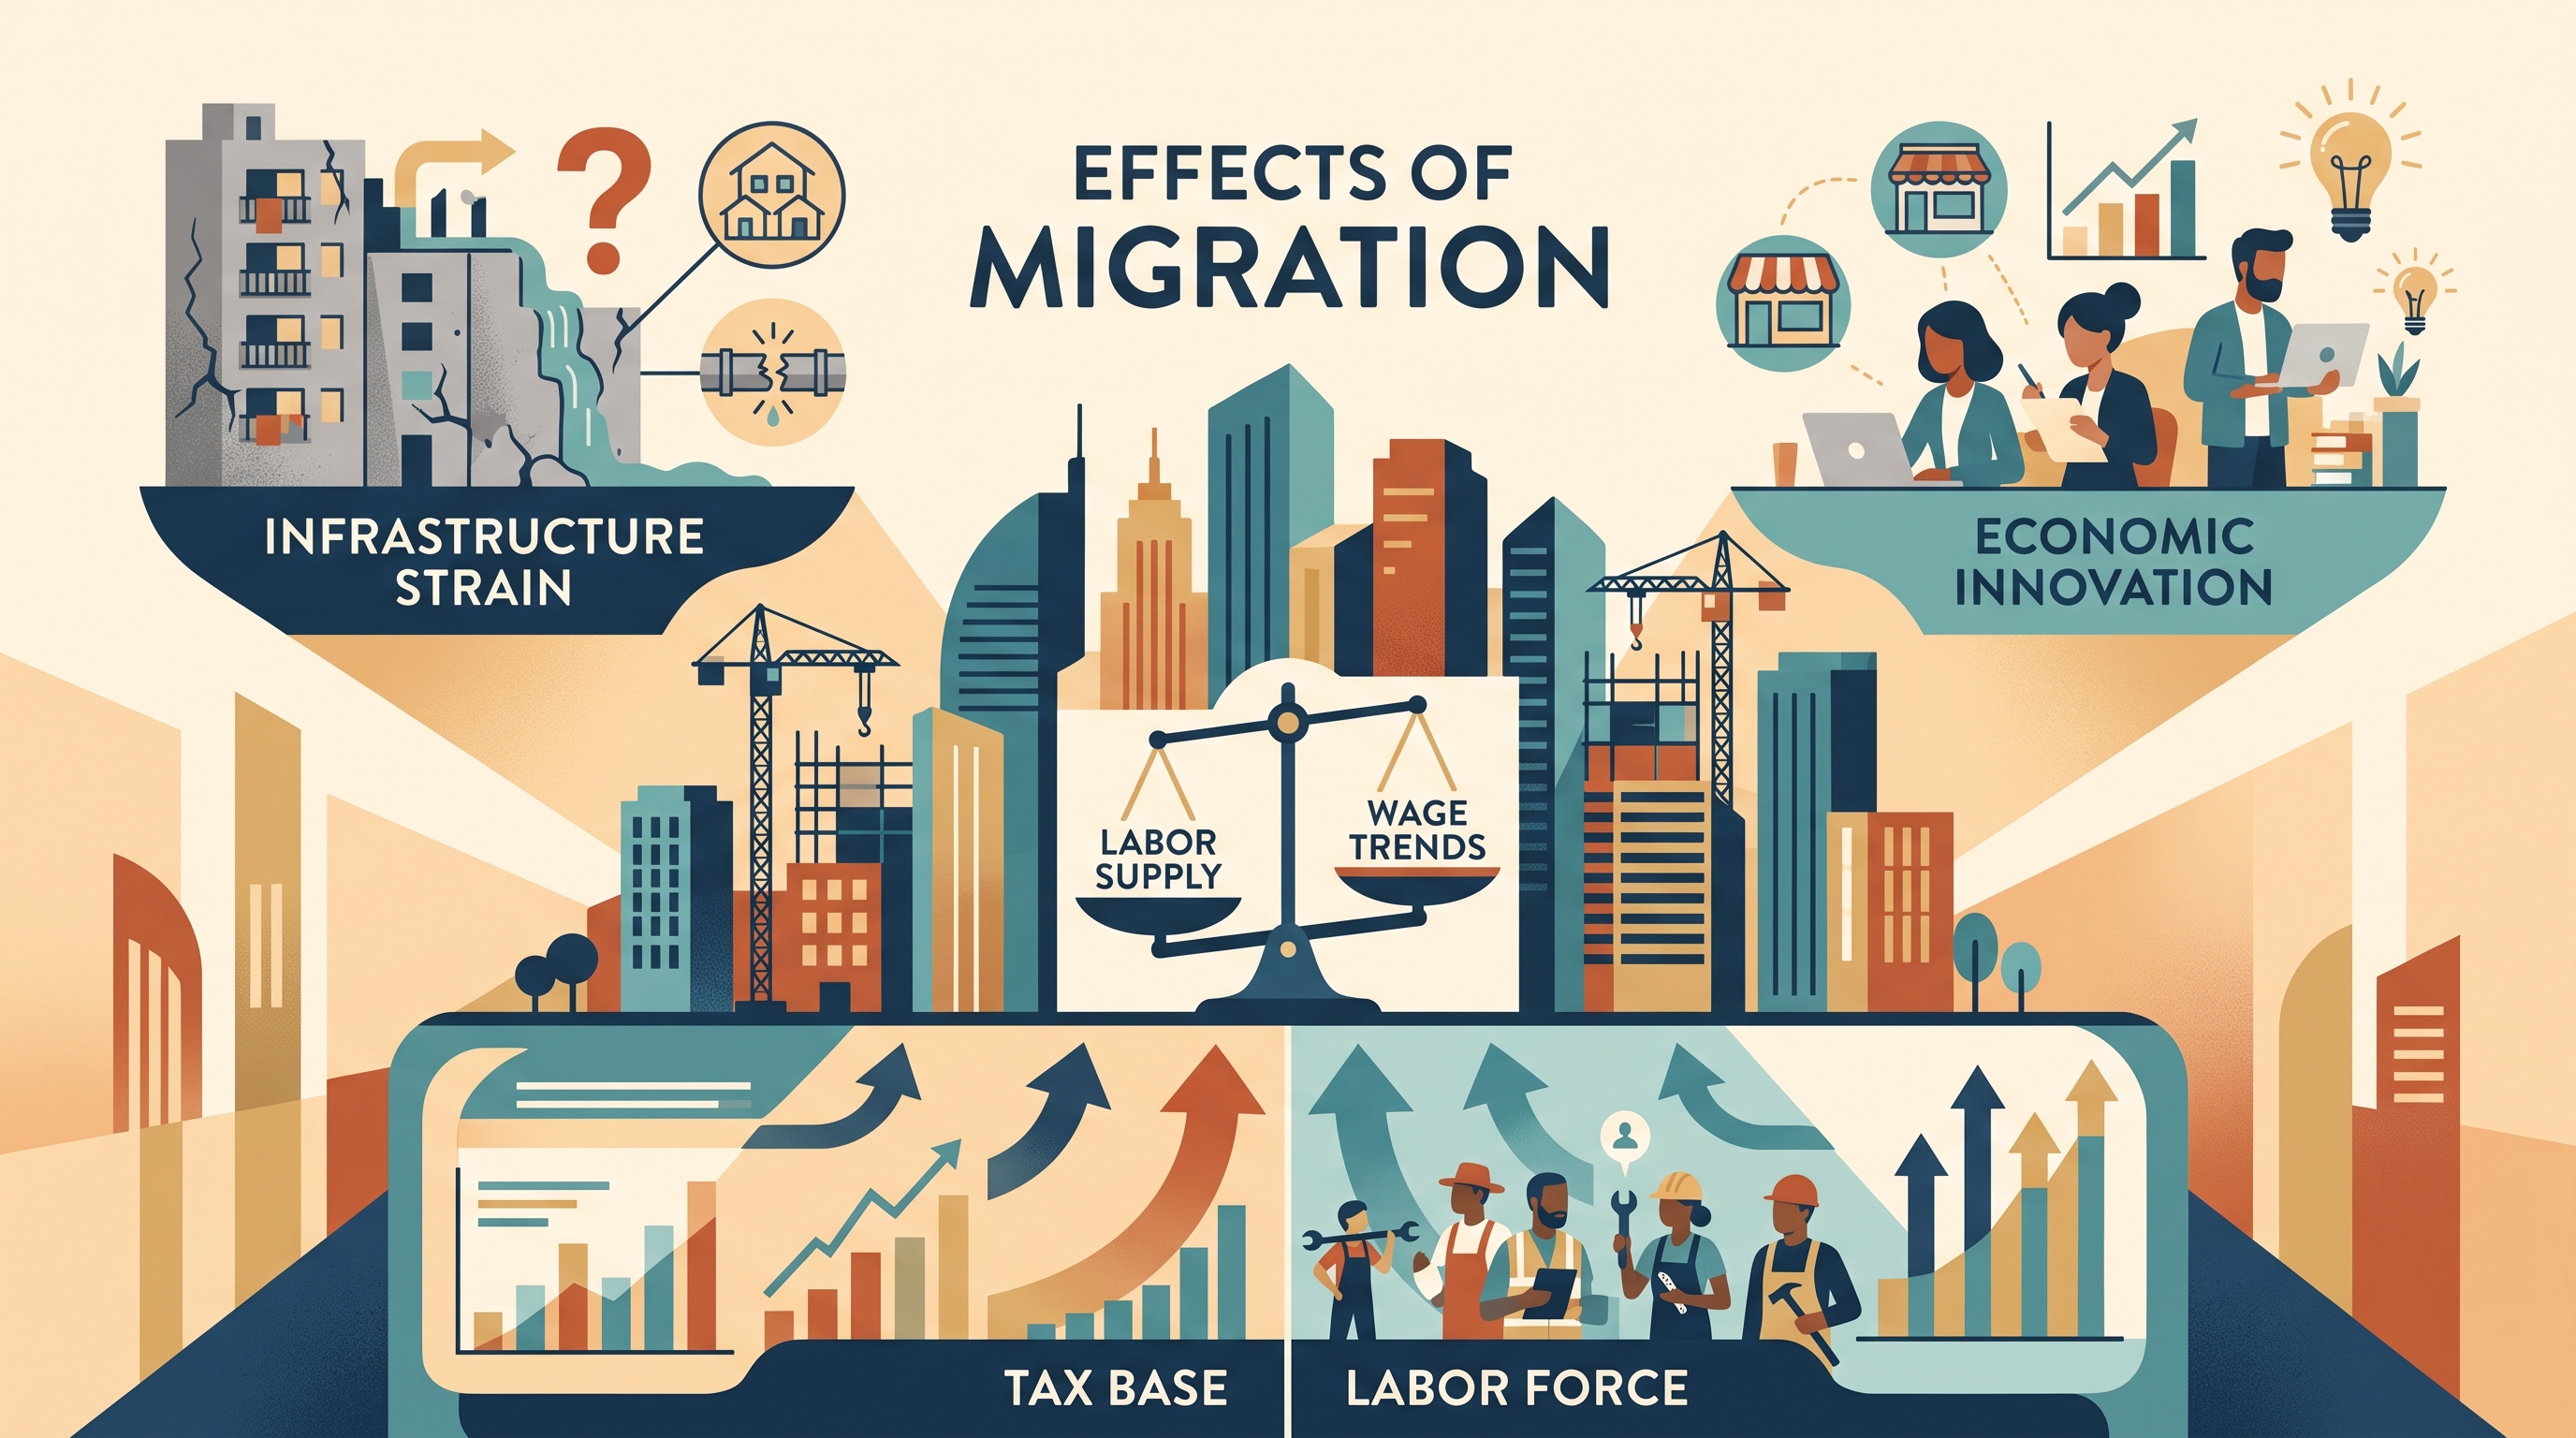
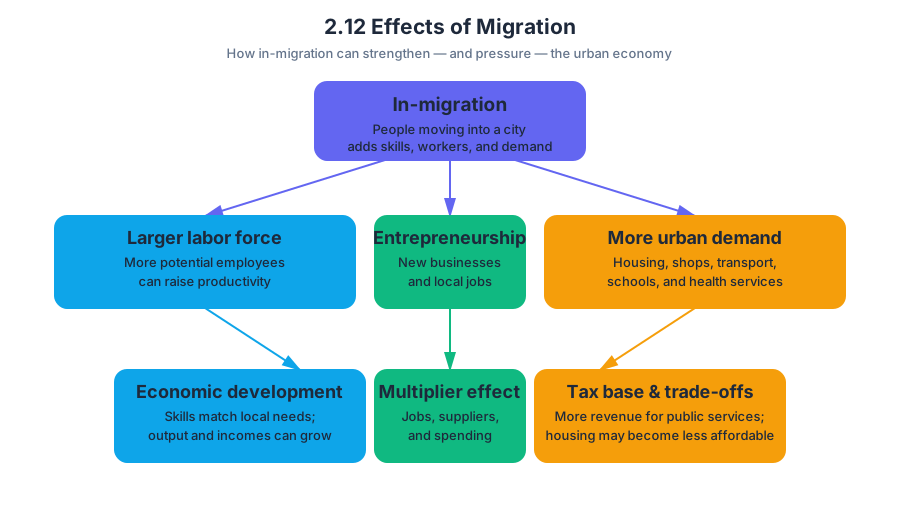
3.1 Introduction to Culture
Culture is the shared system of practices, technologies, attitudes, and behaviors that a society passes from one generation to another. It helps explain why people in different places eat different foods, organize family life differently, attach different meanings to clothing, or respond differently to the same…
3.1 Introduction to Culture
Culture is the shared system of practices, technologies, attitudes, and behaviors that a society passes from one generation to another. It helps explain why people in different places eat different foods, organize family life differently, attach different meanings to clothing, or respond differently to the same landscape.
A useful analogy is a society’s “operating system.” Individuals still make choices, but culture supplies familiar settings, expectations, and rules for interpreting the world. Unlike computer software, culture is not fixed: people adapt it, contest it, borrow from other societies, and combine it with new influences.
CED Learning Objective 3.A: Explain how culture is expressed in landscapes and how it influences the characteristics of places.
CED Essential Knowledge 3.A.1: Culture comprises the shared practices, technologies, attitudes, and behaviors transmitted by a society.
Culture is learned, shared, and changing
Culture is learned, rather than inherited biologically. A child learns a language, food preferences, religious practices, gestures, and ideas about appropriate behavior through family, schools, peers, media, and institutions. Culture is also shared: a practice becomes culturally meaningful when it is recognized and repeated by members of a group, even though individuals may participate in it with different levels of commitment.
Culture changes through innovation, migration, globalization, and cultural diffusion, the spread of cultural traits from one place or group to another. A food, technology, or fashion may enter a society from elsewhere and then be modified to fit local tastes. This means that cultures are neither perfectly isolated nor identical within their boundaries.
Cultural traits and cultural complexes
A cultural trait is a single element of culture. Examples include speaking Spanish, eating rice as a dietary staple, observing Ramadan, using a particular greeting, or wearing a religious symbol. Traits can be material, such as tools and clothing, or nonmaterial, such as beliefs, values, and language.
A cultural complex is a related group of cultural traits. For example, a religious cultural complex may include a belief system, a sacred calendar, dietary rules, architecture, forms of worship, and prescribed clothing. Looking at a complex prevents geographers from treating one isolated trait as if it explains an entire society.
CED Essential Knowledge 3.A.2: Cultural traits are the visible and measurable elements of culture, including artifacts, sociofacts, and mentifacts.
Artifacts are the material objects a culture creates or uses, such as houses, tools, clothing, and foods. Sociofacts are the structures and institutions that organize social life, such as family systems, schools, governments, and religious organizations. Mentifacts are the ideas and beliefs that shape behavior, including language, values, and religious principles.
Worked example: reading one everyday meal
Suppose a student eats a meal of rice, lentils, and vegetables with family members. The rice and cooking utensils are artifacts. The rule that everyone eats together, or that elders are served first, is a sociofact. The belief that certain foods are sacred, forbidden, or appropriate for a festival is a mentifact. The meal therefore represents a connected cultural system, not merely a personal preference.
Cultural differences and attitudes toward difference
Geographers compare cultures without assuming that one culture is the universal standard. Cultural relativism means evaluating a cultural practice within the context of the society that created it. Ethnocentrism is the tendency to judge another culture by the standards of one’s own culture, often treating one’s own practices as normal or superior.
CED Essential Knowledge 3.A.3: Cultural relativism and ethnocentrism influence how people view cultural differences.
These perspectives matter because cultural judgments can influence migration policy, political conflict, economic decisions, and the treatment of minority groups. Cultural relativism does not require approving every practice; it requires understanding its social context before evaluating it.
Named misconception — “Culture equals nationality.” A political boundary does not contain one uniform culture. A single state may include many ethnicities, languages, religions, and regional traditions, while the same cultural group may live across several states. Culture is spatial, but it does not automatically match country borders.
AP skill connection
This topic develops Skill 4.A: Identify and explain cultural patterns and processes. On a map, photograph, or written source, identify the cultural trait or pattern first; then explain the process producing it, such as migration, environmental adaptation, interaction, or diffusion. A strong explanation connects the evidence to a specific cultural practice rather than merely naming a group.
Retrieval check: A city contains multilingual signs, mosques, churches, restaurants serving foods from several regions, and schools teaching multiple languages. Name one artifact, one sociofact, and one mentifact that could be present. Then explain why the city should not be described as having only one culture.
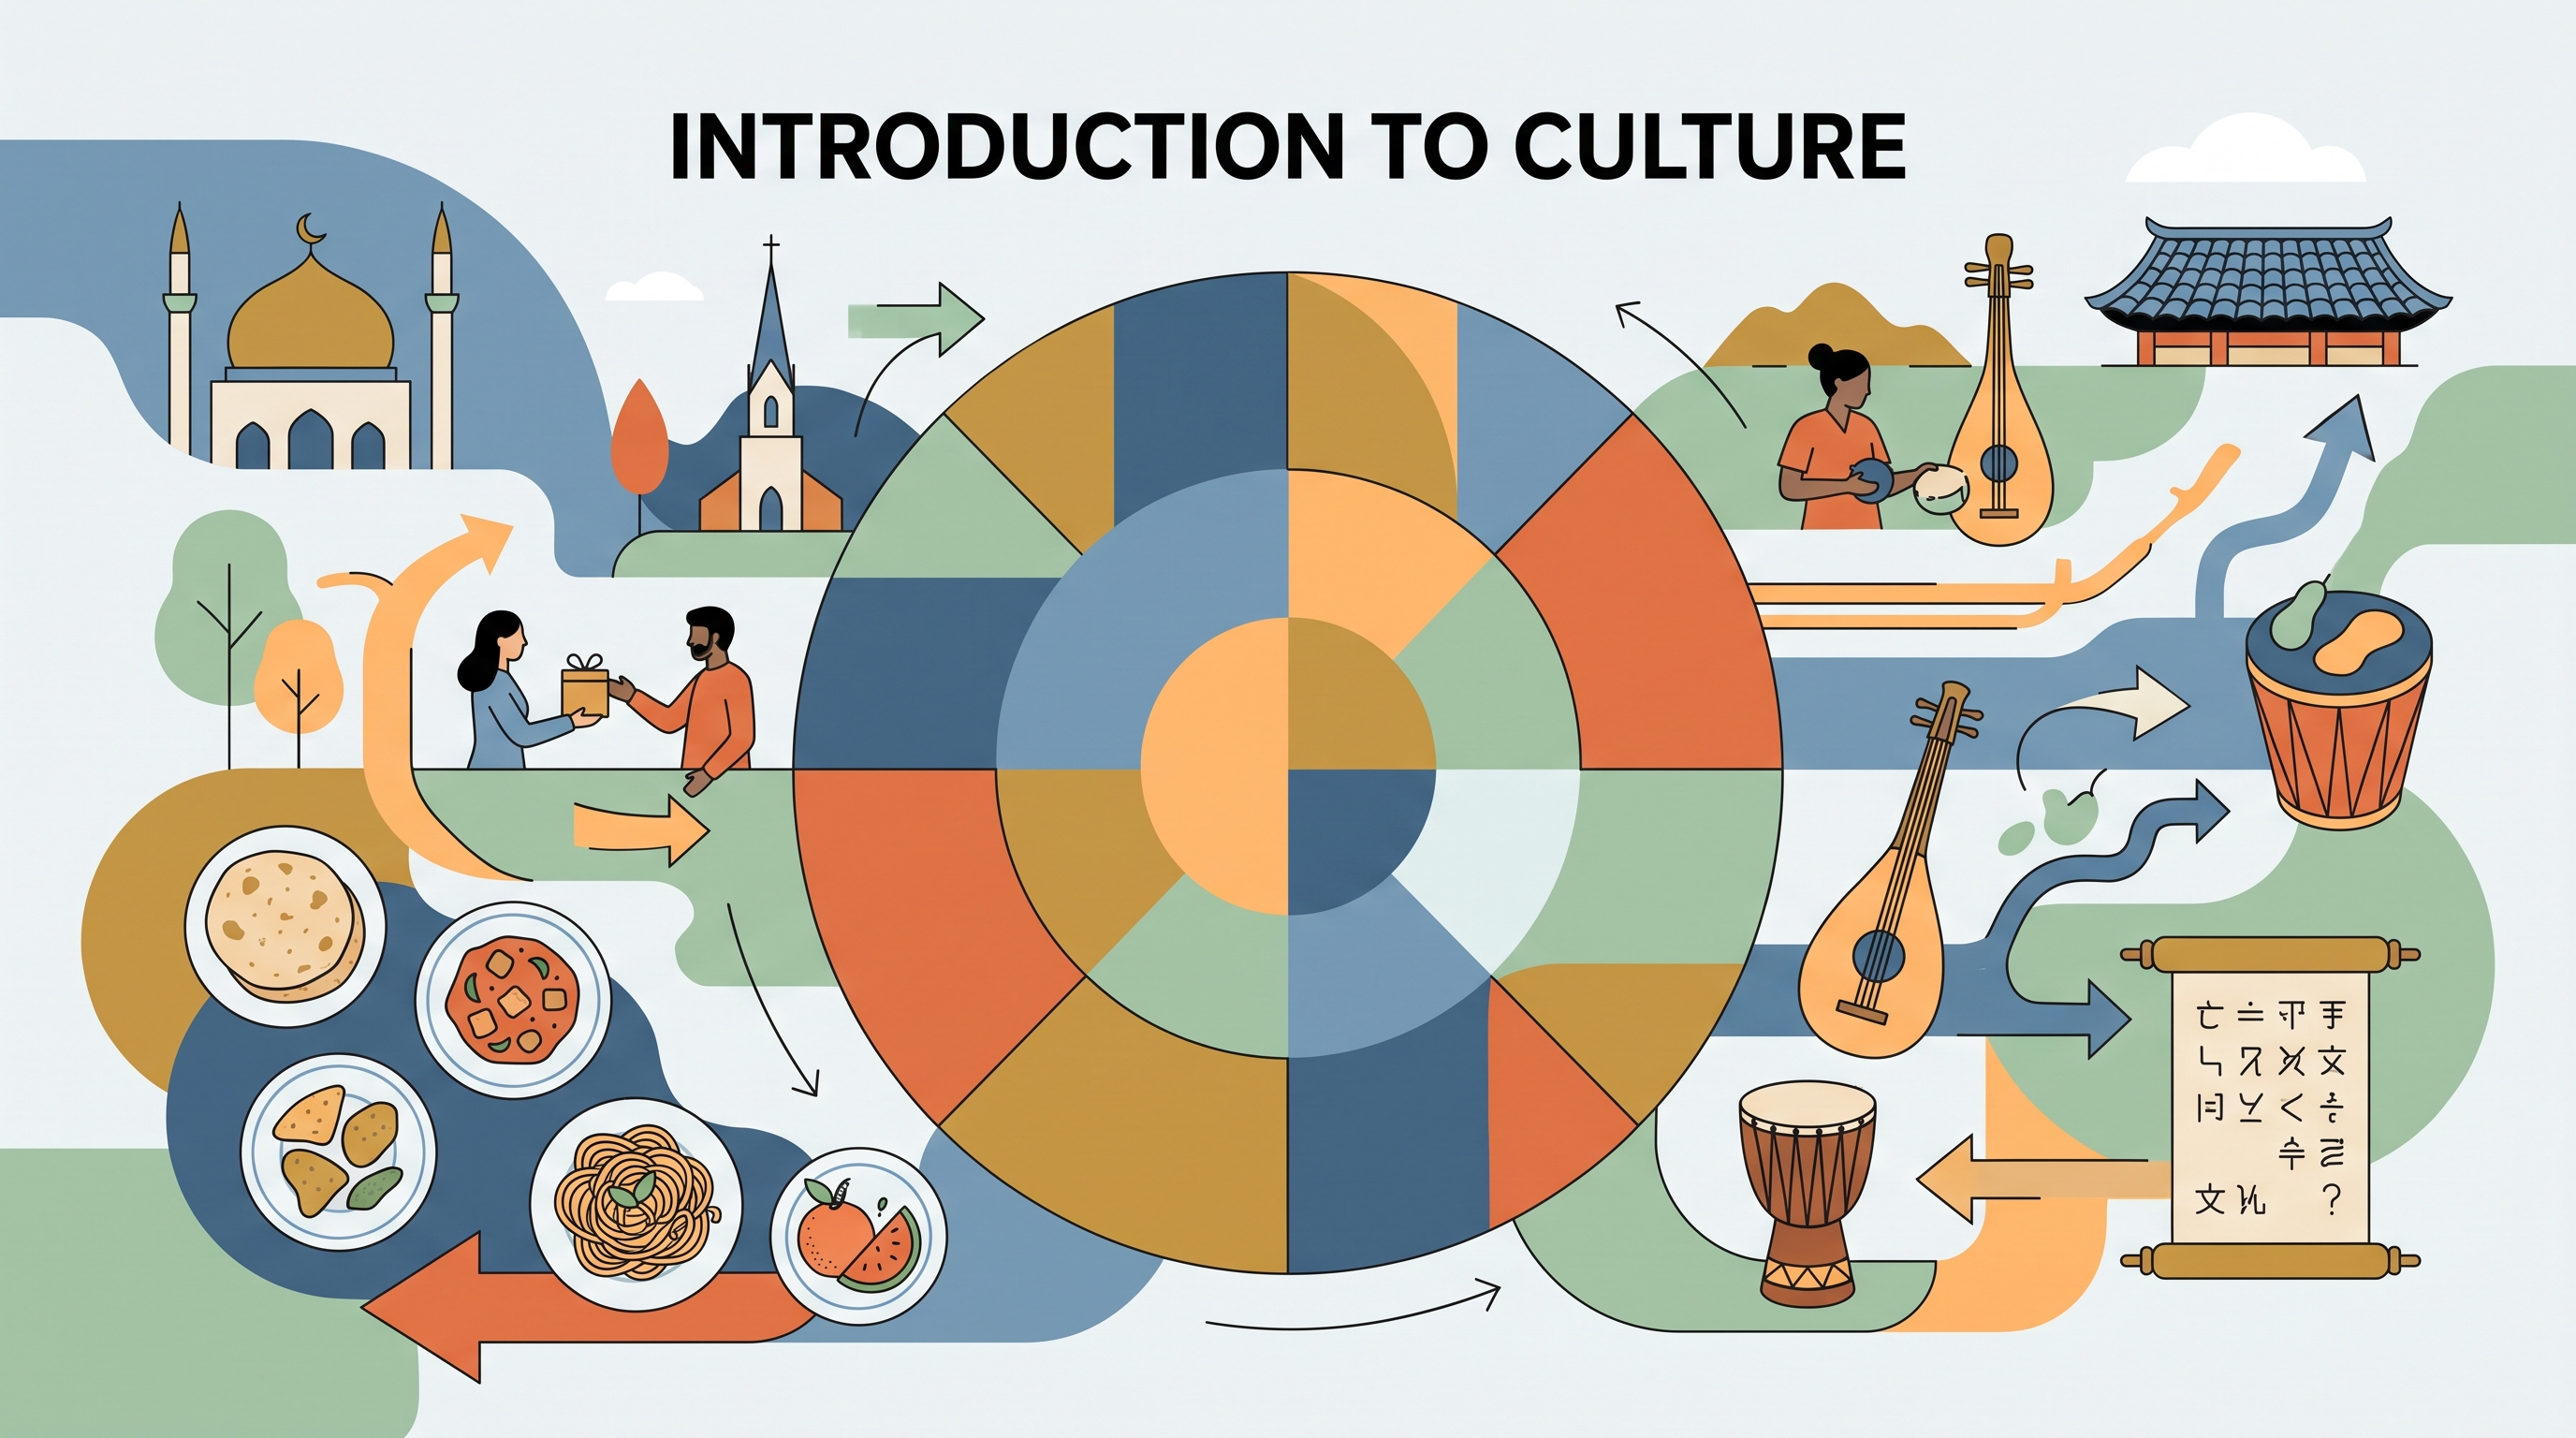
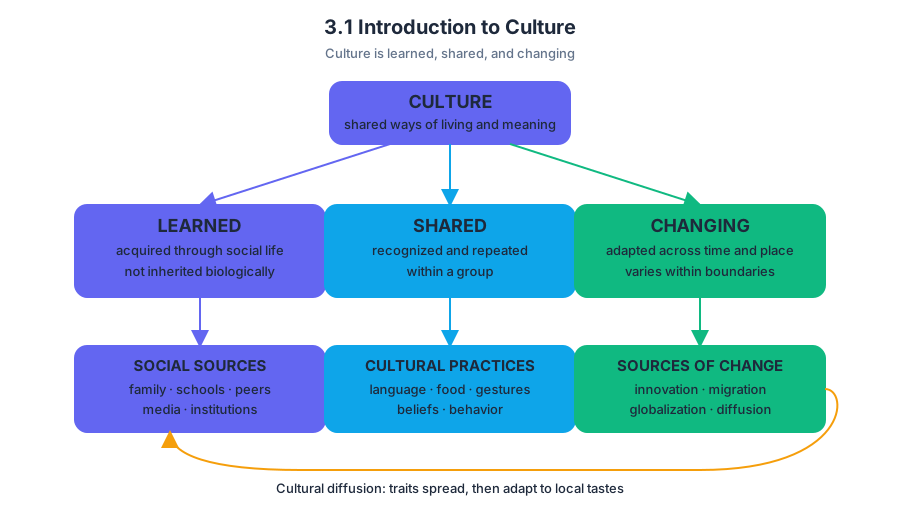
3.2 Cultural Landscapes
Key concepts: Cultural landscapes · Physical geography · Human cultural practices · Placemaking · Ethnic traditions · Sequent occupance · Visual landscape elements · Intangible cultural elements · Functional land-use patterns · Pastoral nomadism in the Sahel
A landscape is never only “natural.” A street sign in two languages, a mosque beside a market, seasonal grazing routes, traditional clothing, and the crops planted in nearby fields can all reveal who lives in a place, what they value, and how earlier groups occupied it.
3.2 Cultural Landscapes
A landscape is never only “natural.” A street sign in two languages, a mosque beside a market, seasonal grazing routes, traditional clothing, and the crops planted in nearby fields can all reveal who lives in a place, what they value, and how earlier groups occupied it. A cultural landscape is the visible and functional imprint of human activity on Earth’s surface.
Cultural landscape: The human-shaped landscape produced by cultural practices, beliefs, technologies, land uses, and historical occupation.
The key relationship is expressed by PSO-3: “Cultural practices vary across geographical locations because of physical geography and available resources.” Physical geography does not mechanically determine culture, but climate, terrain, soils, vegetation, and available resources influence the choices people can make. Human activities then modify those environments, creating landscapes that reflect both environmental conditions and cultural decisions.
Natural landscape versus cultural landscape
A physical or natural landscape consists primarily of environmental features such as mountains, rivers, climate, soils, and natural vegetation. A cultural landscape includes the changes people make to that setting: buildings, roads, farms, signs, religious structures, grazing routes, resource-management systems, and places named or shaped by human groups.
The distinction is analytical rather than absolute. A dry Sahelian environment is a physical landscape; wells, livestock corridors, seasonal settlements, corrals, markets, and communication towers created or used by pastoral groups are cultural-landscape elements within it.
| Landscape element | What it reveals | Examples |
|---|---|---|
| Visual | Identity and history made visible | Art, architecture, clothing, signs, place names, older buildings |
| Intangible | Beliefs and social organization | Religion, language, governance, gender or ethnic attitudes |
| Functional | How people use and manage space | Land-use patterns, agricultural styles, grazing systems |
| Historical | Earlier cultural layers | Abandoned settlements, reused buildings, older roads or toponyms |
Placemaking and ethnic traditions
Placemaking is the process through which people give a location meaning and make it express a shared identity. Regional patterns of language, religion, and ethnicity contribute to a sense of place, enhance placemaking, and shape the global cultural landscape (PSO-3.D.1). In other words, culture does not merely occupy space; it helps produce recognizable places.
Immigrants may preserve ethnic traditions through placemaking. Traditional architecture, bilingual or heritage-language signs, restaurants, religious buildings, festivals, and culturally meaningful toponyms can mark an ethnic neighborhood. These features do not prove that every resident shares the same identity, but they show how cultural practices remain visible after migration.
Misconception check: A cultural landscape is not limited to old or rural places. A recently developed immigrant neighborhood, a modern religious center, or a bilingual commercial district is also a cultural landscape.
Sequent occupance: landscapes as layered records
Sequent occupance means that successive groups occupy and modify the same place, leaving behind overlapping cultural layers. A city may contain an older Indigenous place name, a colonial street grid, a later religious building, industrial structures, and contemporary multilingual signs. The landscape becomes a historical record—not a frozen snapshot of one culture.
Worked example: pastoral nomadism in the Sahel
The Sahel is a semi-arid transition region south of the Sahara. Pastoral nomadism, a livelihood based on moving livestock between grazing areas, affects its cultural landscape through both land use and cultural identity.
Step 1 — Physical setting: Natural drought, increasingly dry conditions, and climate change can reduce vegetation and soil moisture. Runoff, wind, and erosion may remove fertile topsoil. Population growth, cultivation of arid land, demand for water, and the use of wood for fuel or building materials can place additional stress on scrub and shrub landscapes.
Step 2 — Cultural adaptation: Herders follow established migration routes to reach seasonal pasture and water. Their movement creates recognizable land-use patterns, including watering sites, market locations, animal pens, corrals, and temporary settlements.
Step 3 — Cultural meaning: Portable or seasonal dwellings, livestock practices, dairying traditions, celebrations, meeting places, and even communication infrastructure such as cell-phone towers reflect the identities and needs of mobile groups. Thus, pastoral nomadism leaves both functional and symbolic marks on the landscape.
Step 4 — Environmental interaction: Grazing can be sustainable when movement allows vegetation to recover, but concentrated grazing, wood removal, drought, and erosion can contribute to land degradation. The strongest explanation connects the activity to a landscape outcome: pastoral mobility shapes routes and settlements, while environmental stress can reduce the vegetation supporting that system.
AP skill connection
This topic most directly develops Skill Category 1: Concepts and Processes, especially 1.A Describe spatial patterns and processes and 1.B Explain spatial concepts. It also uses Skill Category 2: Spatial Relationships, including 2.A Describe spatial relationships across different scales and 2.B Explain spatial relationships across different scales, because cultural landscapes connect household practices, local places, regional environments, and global migration.
For source-based work, apply Skill Category 4: Source Analysis, especially 4.A Identify information from geographic sources and 4.B Explain spatial relationships in geographic sources. Under Skill Category 5: Scale Analysis, 5.A Identify the scales of analysis presented by geographic data helps distinguish a neighborhood’s cultural signs from a regional pattern of language or religion.
Retrieval check
A landscape contains bilingual signs, a heritage-style religious building, an older colonial street name, and a modern transit station. Identify one visual cultural element, one example of sequent occupance, and one way placemaking could strengthen ethnic identity. Then explain how the answer would differ if the question asked about the physical landscape rather than the cultural landscape.
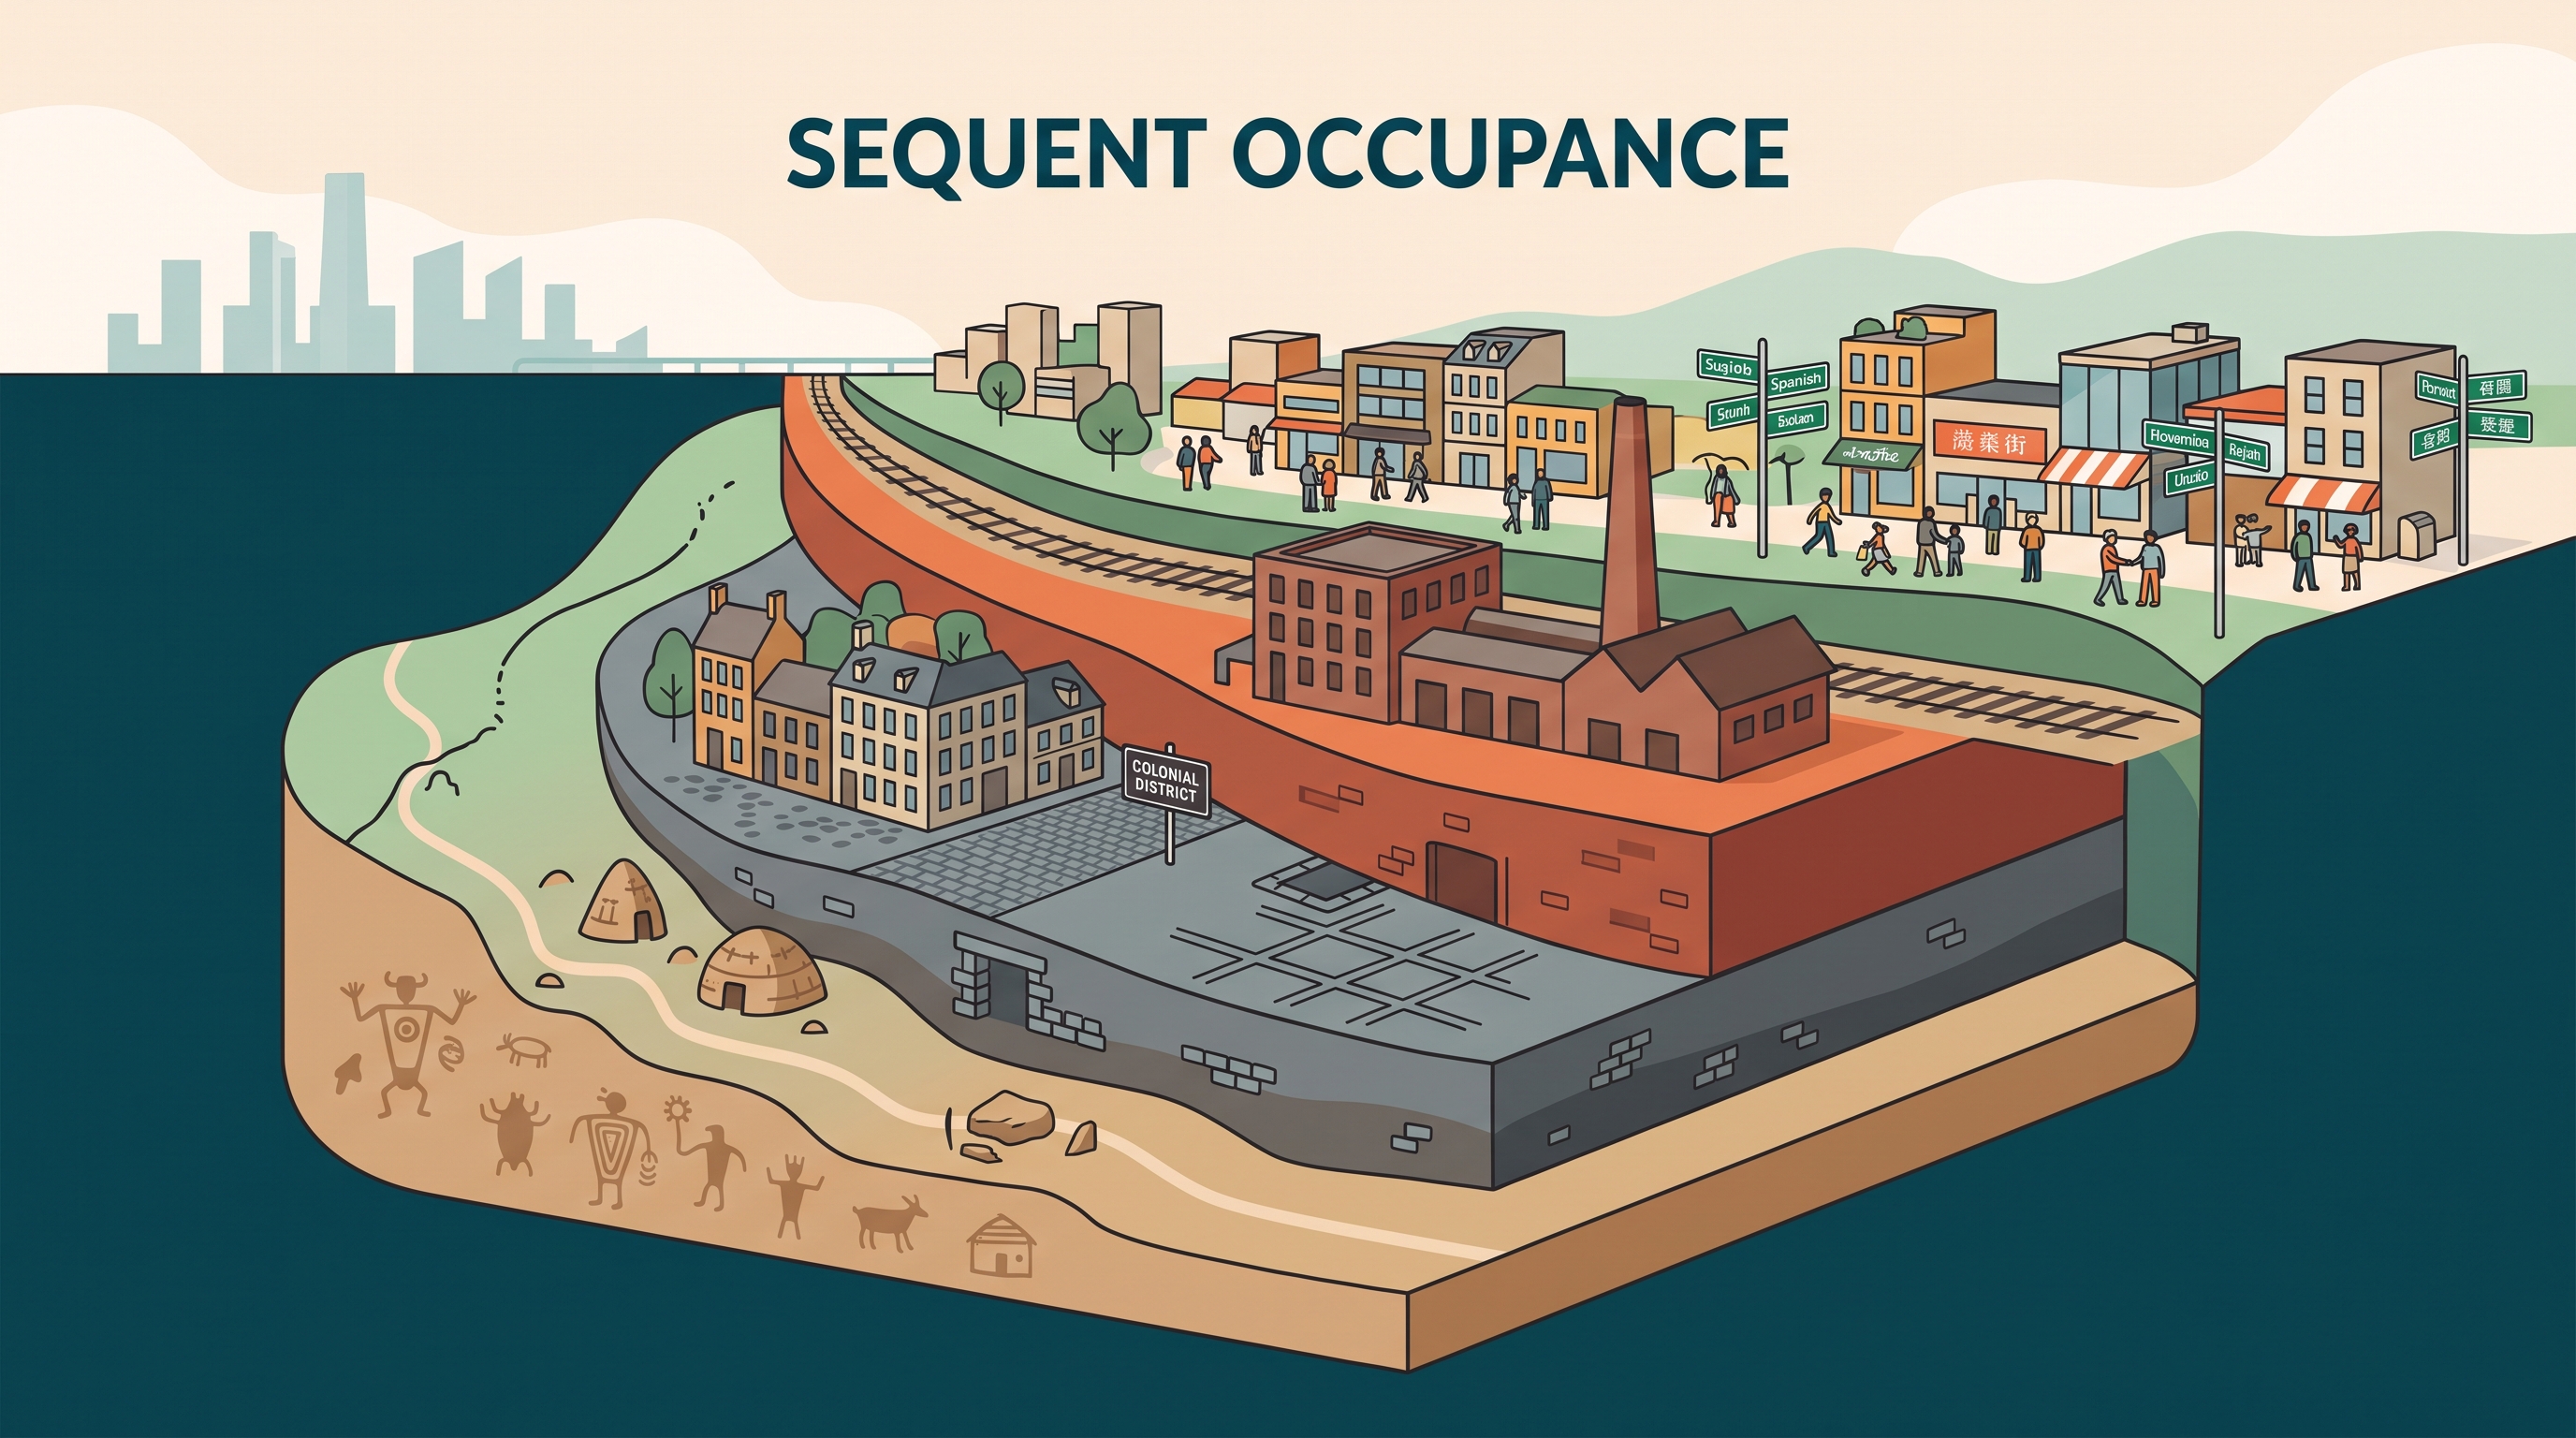
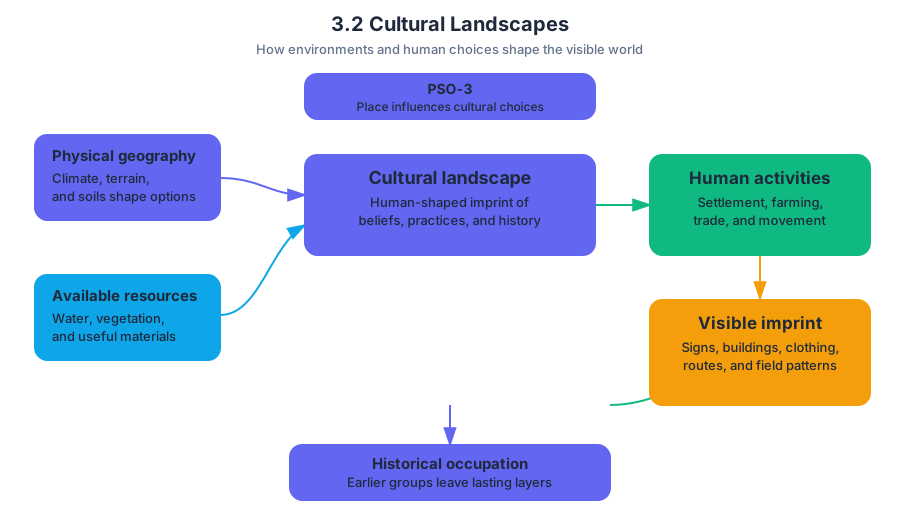
3.3 Cultural Patterns
Key concepts: Cultural convergence · Cultural divergence · Migration and cultural diffusion · Global agricultural patterns · Cultural, economic, and environmental influences on agriculture · Communication technology and cultural change · Indigenous language loss and preservation · Language replacement by dominant languages such as English · Religion expressed through regional architecture · Visual-source analysis of cultural patterns
Cultural patterns are never random: they reveal how people, places, environments, economies, and technologies shape one another. A language map, a religious building, or an agricultural map can therefore be read as evidence of cultural processes—not merely as a collection of locations.
3.3 Cultural Patterns
Cultural patterns are never random: they reveal how people, places, environments, economies, and technologies shape one another. A language map, a religious building, or an agricultural map can therefore be read as evidence of cultural processes—not merely as a collection of locations.
Learning Objective 3.3: Explain the regional distribution of cultural traits and cultural identity.
Essential Knowledge SPS-3.A: Contemporary cultural patterns and processes reflect interactions among migration, globalization, communication technology, and local cultural practices.
Essential Knowledge SPS-3.A.1–SPS-3.A.4: Cultural patterns may produce both cultural convergence, in which places become more alike, and cultural divergence, in which groups maintain or develop distinct identities.
Convergence and divergence
Cultural convergence occurs when different places or groups become more similar because they share cultural traits, technologies, institutions, products, or practices. The global use of English, international fast-food chains, and widely shared digital media can all contribute to convergence.
Cultural divergence occurs when cultural differences become stronger or remain distinct. A community may preserve its language, religion, foodways, architecture, or agricultural traditions even while participating in global networks. Convergence and divergence can occur simultaneously: a community may use global smartphones while revitalizing an indigenous language through those same devices.
| Process | Direction of cultural change | Geographic evidence |
|---|---|---|
| Cultural convergence | Places become more similar | Shared languages, brands, media, or technologies |
| Cultural divergence | Groups maintain or strengthen differences | Distinct religious landscapes, indigenous languages, or regional traditions |
| Migration | Traits move with people | Diaspora neighborhoods, multilingual regions, new religious structures |
| Communication technology | Connections intensify across distance | Global language use, online cultural communities, digital archives |
Migration as a cultural process
Migration can produce cultural convergence when migrants and host communities exchange traits. For example, migrants may bring a language, religion, cuisine, music, or clothing style to a destination, while also adopting some practices of the receiving society. Over time, a city may contain shared cultural institutions and blended practices that were previously associated with separate regions.
Migration can also produce cultural divergence. Migrants may establish places of worship, businesses, schools, media outlets, and neighborhoods that preserve a distinctive identity. This does not necessarily mean complete separation; it means that migration can maintain visible cultural differences within a larger society.
Key distinction: Migration does not automatically cause assimilation. It can create similarity through interaction, difference through cultural preservation, or both at once.
Reading cultural patterns from visual sources
A map showing religious architecture can reveal a regional religious pattern. The presence of mosques, churches, synagogues, temples, or other structures built for worship suggests that the associated religion is practiced in that region. If the structures are widespread and prominent, the religion may be practiced by a majority of the local population—but the buildings alone do not prove that every resident follows that faith.
To interpret a cultural map, move from pattern to process:
- Identify where the trait is concentrated.
- Identify where it is sparse or absent.
- Describe the pattern using geographic evidence.
- Connect the pattern to migration, environment, economics, history, or technology.
- Decide whether the process suggests convergence, divergence, or both.
Agriculture: culture meets environment
Agricultural production patterns differ across countries because agriculture is shaped by cultural, economic, and environmental factors. Cultural preferences influence which foods people grow and consume. Economic conditions influence access to land, labor, capital, markets, transportation, and technology. Environmental conditions—including climate, soils, water availability, and terrain—affect which crops and animals can be raised successfully.
Consider a comparison of agricultural production maps for the United States, China, Brazil, and Russia. A high-production area should not be explained by climate alone: dense populations and food preferences may increase production in parts of China; large-scale commercial farming and export markets may shape production in the United States and Brazil; and Russia’s production pattern is strongly constrained by its extensive cold environments, even though fertile areas support important agricultural regions.
Worked interpretation: If a map shows high soybean production concentrated in Brazil, a strong explanation combines several factors: suitable warm growing conditions, extensive land, commercial farming, investment, transportation networks, and international demand for animal feed and vegetable oil. Saying only “Brazil has a good climate” identifies one factor but does not explain the full cultural-economic-environmental pattern.
Communication technology and language change
The Internet and global communication can encourage cultural convergence by making widely used languages—especially English—more useful for education, employment, entertainment, science, and international communication. Members of indigenous-language communities may increasingly use a dominant global language, causing the indigenous language to be ignored, used less often, or lost across generations.
Technology can also support cultural divergence and preservation. Digital archives can record pronunciation, stories, and vocabulary; language-learning applications can make instruction widely available; and social media can connect speakers, teachers, elders, and younger learners. The same communication technology can therefore accelerate language loss or help revitalize a language, depending on how communities use it.
Named misconception: “Technology always destroys indigenous languages.”
The accurate explanation is conditional: technology may promote adoption of a dominant language through convergence, or provide resources for indigenous-language preservation.
AP skills in action
Skill 1.A: Define and explain geographic concepts, processes, models, and theories. Use precise definitions for convergence, divergence, cultural diffusion, and cultural identity rather than treating them as synonyms.
Skill 2.C: Explain spatial relationships. Connect the location of a religious structure, language region, or agricultural concentration to a process such as migration, globalization, environmental limitation, or market access.
Skill 3.A: Identify patterns and trends in maps and other visual sources. Describe concentrations, gaps, clusters, and contrasts before explaining why they occur.
Skill 5.B: Explain spatial relationships across different scales of analysis. A language may be declining globally but thriving in one local community; an agricultural pattern may be national in scale but vary sharply among subnational regions.
Retrieval check
A region contains new temples built by migrants, widespread English-language media, and a growing online archive of an indigenous language. What conclusion is best supported? The region shows both cultural convergence through migration and global communication and cultural divergence through religious distinctiveness and indigenous-language preservation. A strong answer identifies the visible pattern and explains the process connecting it to the evidence.
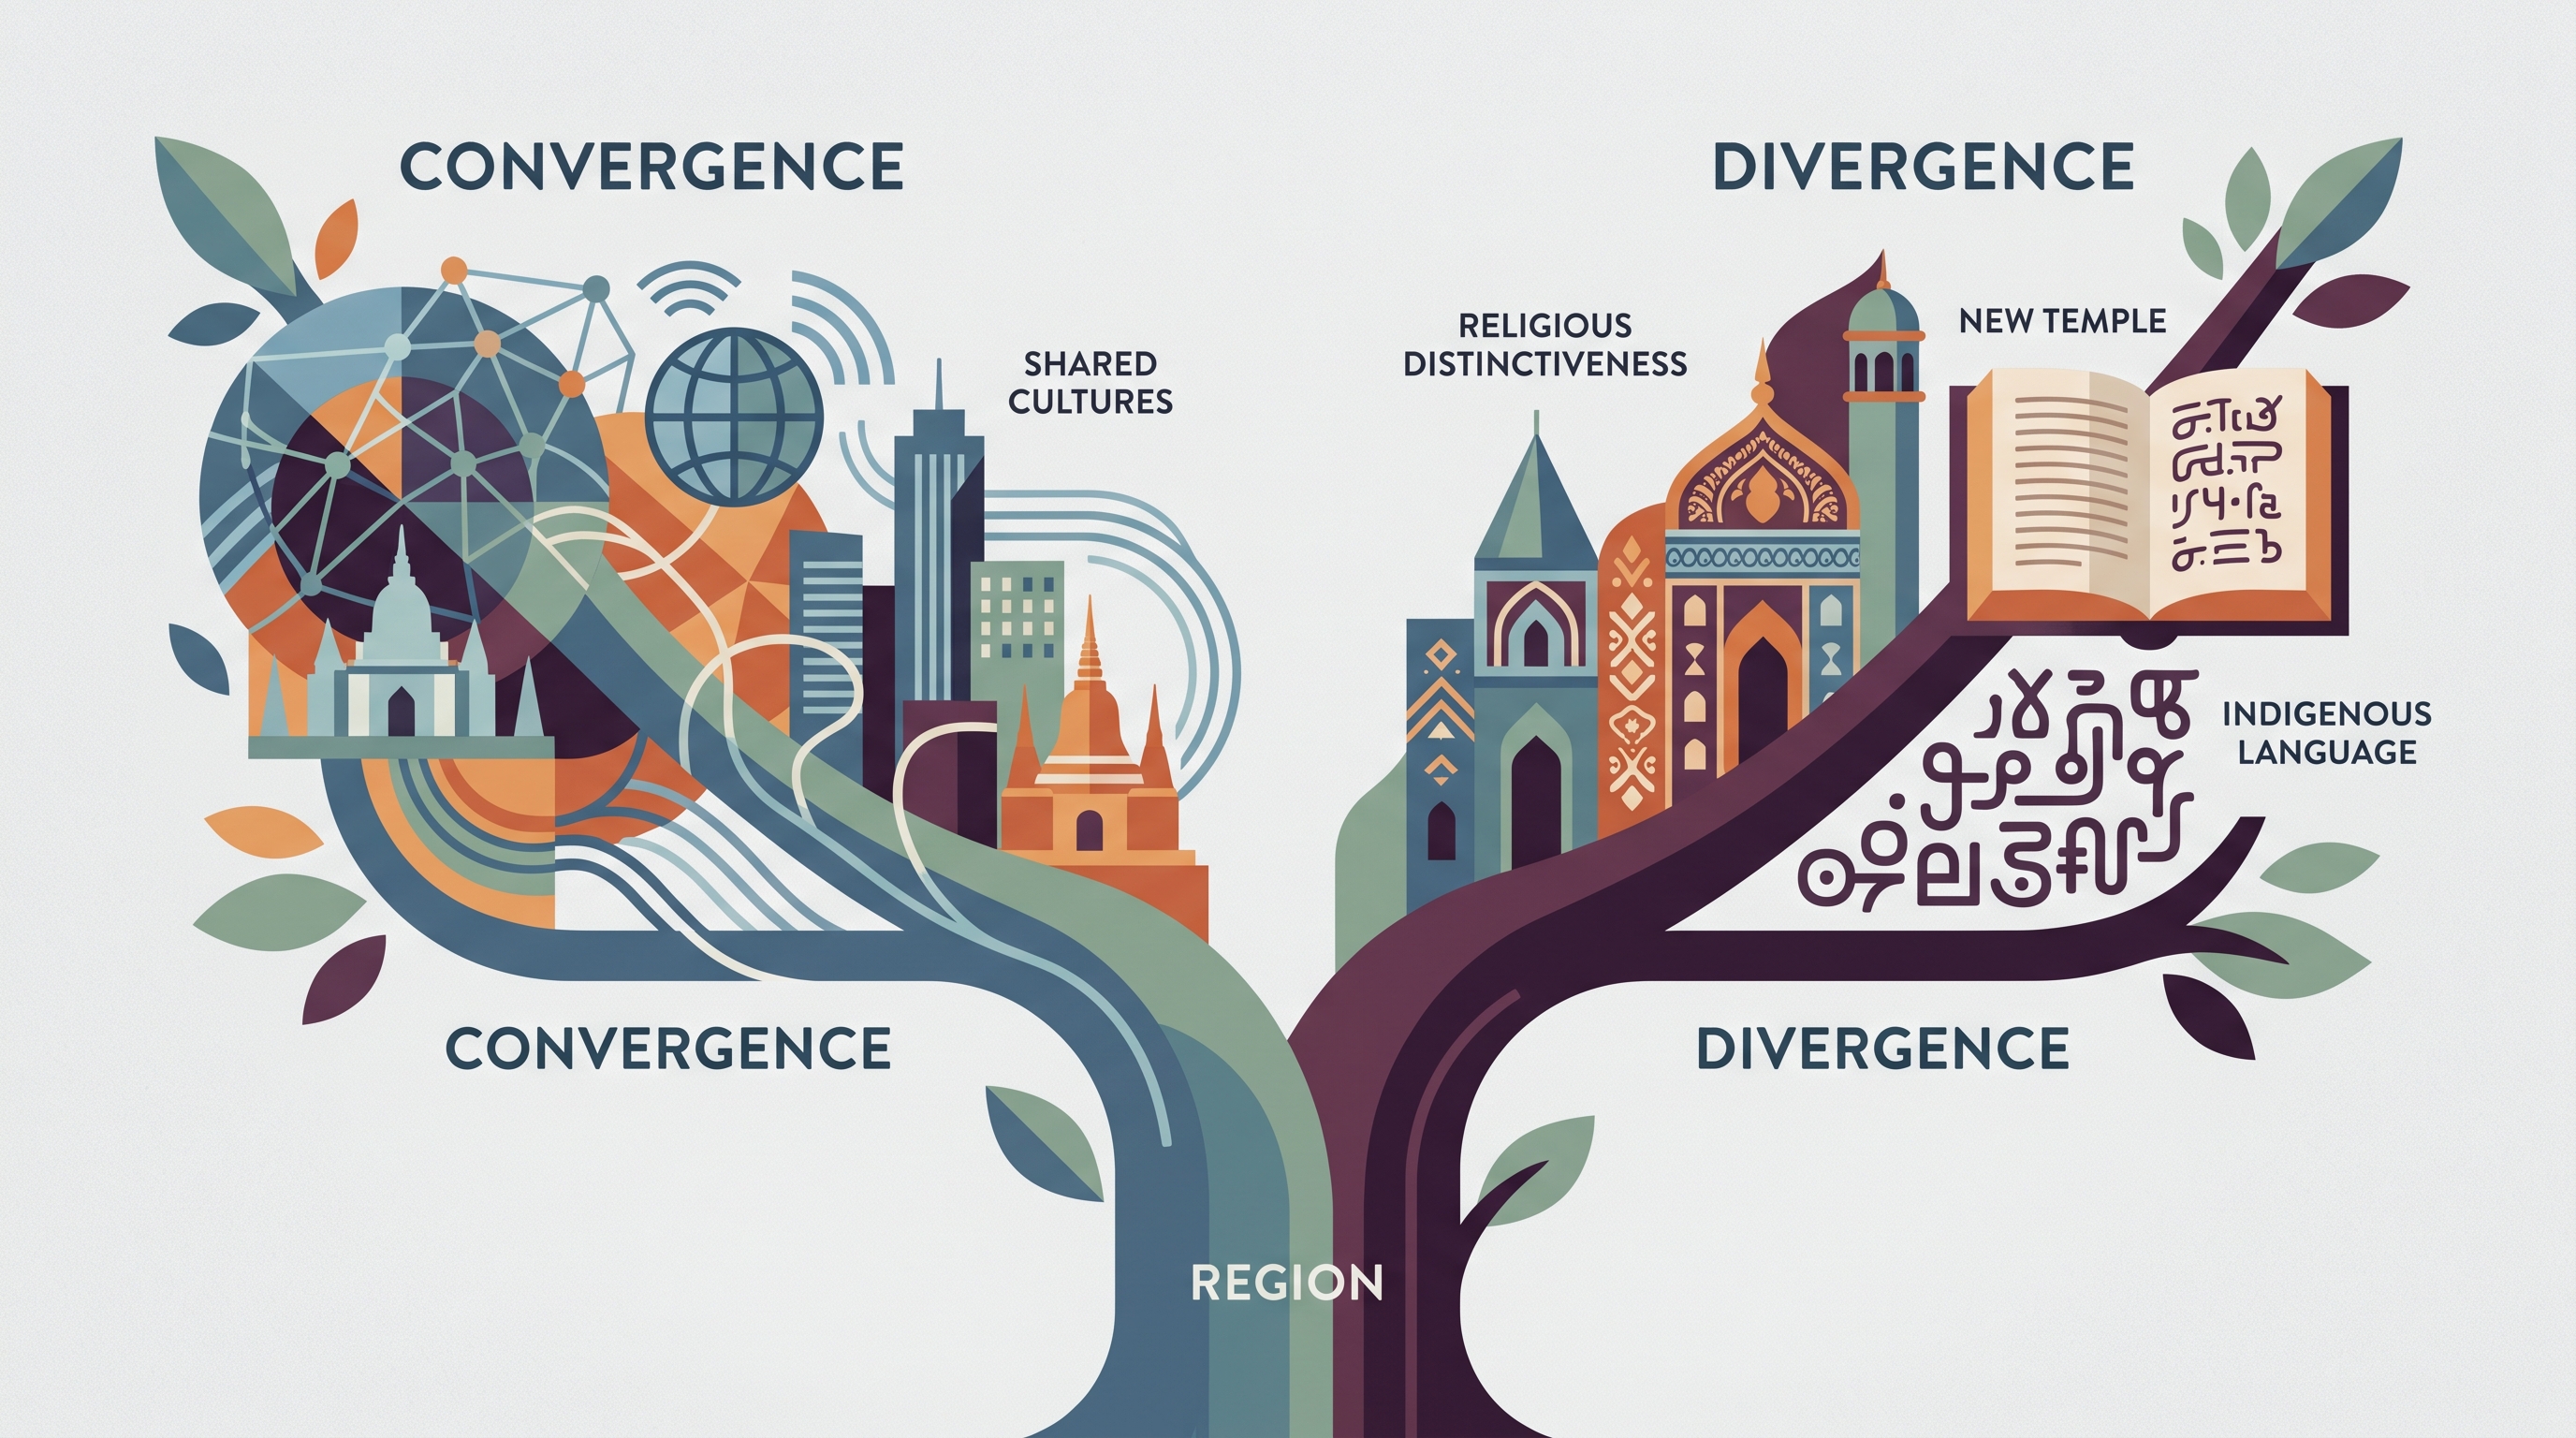
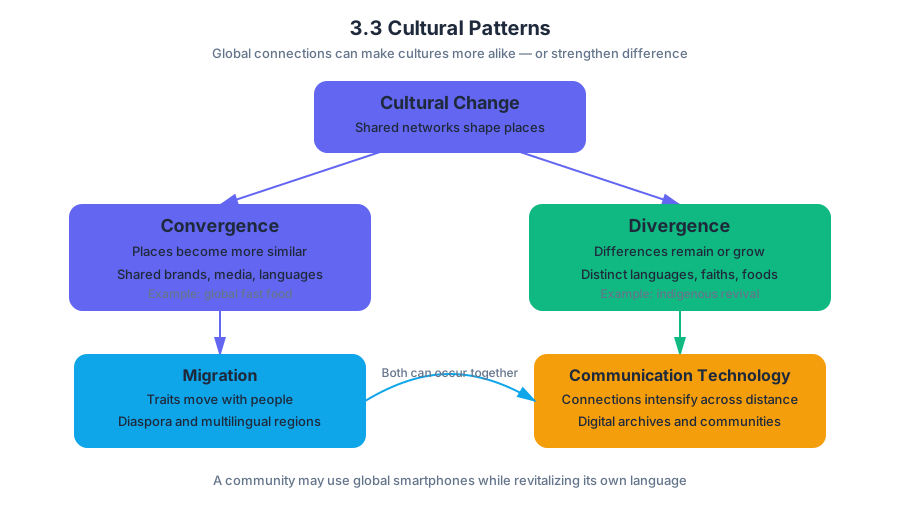
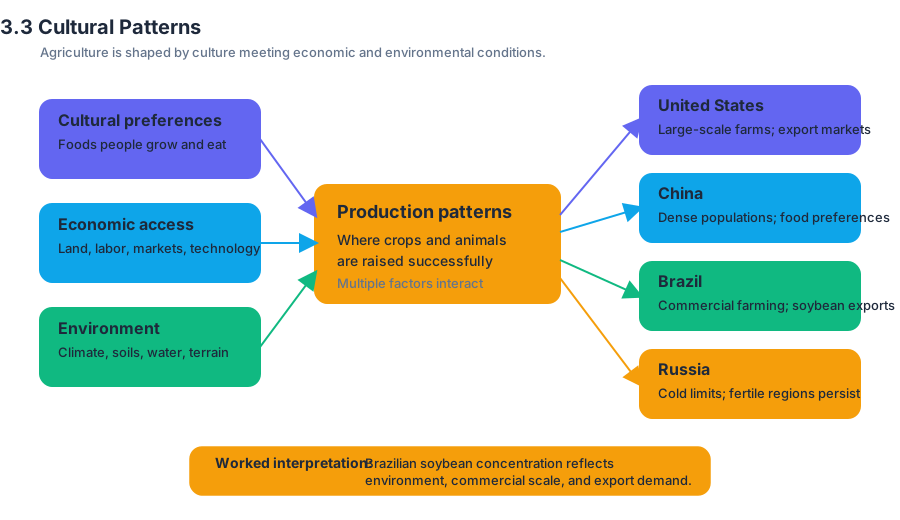
3.4 Types of Diffusion
Key concepts: Types of diffusion · Relocation diffusion · Hierarchical diffusion · Contagious diffusion · Stimulus diffusion · Blending of languages
A cultural idea can cross space in several different ways: people may carry it with them, influential places may pass it onward, neighbors may imitate one another, or another culture may borrow and modify it.
3.4 Types of Diffusion
A cultural idea can cross space in several different ways: people may carry it with them, influential places may pass it onward, neighbors may imitate one another, or another culture may borrow and modify it. Cultural diffusion is the spread of ideas, practices, technologies, languages, or other cultural traits from one location or group to another.
The crucial question is not simply whether a trait spreads, but how its spatial pattern is produced. A map showing a trait’s distribution is the visible result; the type of diffusion identifies the process behind that pattern.
The five diffusion pathways
| Type of diffusion | How the spread occurs | Spatial clue |
|---|---|---|
| Relocation diffusion | People move and carry an idea or practice to a new location, often across a geographic barrier. | A new outpost appears far from the source |
| Expansion diffusion | A cultural trait spreads outward from its source area while remaining strong in the source area. | The original area and surrounding areas both show the trait |
| Hierarchical diffusion | An idea spreads from one important or significant city, community, and/or person to another. | Major centers or influential people adopt it first |
| Contagious diffusion | An idea spreads from person to person or along a transportation line. | A continuous, neighbor-to-neighbor pattern |
| Stimulus diffusion | An idea is borrowed from one culture and altered by the receiving culture. | The general concept spreads, but its form changes |
These categories can overlap. For example, a music style might reach a distant city through relocation diffusion, become popular among celebrities through hierarchical diffusion, and then spread through neighborhoods by contagious diffusion. If local musicians alter the rhythm or lyrics, the result also demonstrates stimulus diffusion.
Worked example: tracing a food trend
Imagine a vegetable-based street-food recipe developed in one coastal city.
- A chef moves to another country and opens a restaurant, carrying the recipe across a geographic barrier. This is relocation diffusion.
- Well-known chefs in several major cities feature the dish. Its movement between influential cities and people is hierarchical diffusion.
- Customers imitate the dish, and nearby restaurants begin selling it. This person-to-person and business-to-business spread is contagious diffusion.
- A local culture replaces one ingredient and changes the preparation method while retaining the basic idea. This is stimulus diffusion.
- The original city continues producing and consuming the dish while surrounding places adopt it. That outward spread is expansion diffusion.
The same cultural trait can therefore experience several diffusion processes at different moments. Exam questions often reward the explanation of the mechanism—not merely naming a popular example.
Language blending and creolization
Creolization is the development of a new language or form of communication through sustained contact between groups speaking different languages. It is a form of cultural blending: two or more languages converge, and the resulting language includes features from the original languages.
For example, when speakers of mutually unintelligible languages interact over time, they may combine vocabulary, pronunciation, grammar, and sentence patterns. A temporary contact language may develop first; with continued community use and transmission to new generations, a more stable language or dialect can emerge.
Key insight: Creolization does not mean that one language simply replaces another. It describes the creation of a new linguistic form containing selected features from multiple languages.
This process can be understood as stimulus diffusion because a cultural element—in this case, language—is borrowed and then altered by the receiving or interacting culture. It also reflects syncretism, the combination of cultural traits into a new form.
Misconception check: diffusion is not cultural copying
A common misconception is that diffusion always produces an identical cultural trait everywhere. In reality, stimulus diffusion specifically involves adaptation. A borrowed idea may retain its central function while changing its ingredients, design, vocabulary, meaning, or social use.
A second misconception is confusing relocation and expansion diffusion. If migrants carry a practice to a distant place, the defining mechanism is relocation diffusion. If the practice spreads outward while remaining established in its source area, the pattern is expansion diffusion.
AP skill connection
Topic 3.4 Types of Diffusion is anchored in the learning objective 3.4.A: Explain how culture spreads through diffusion. It most directly develops Skill 1.B: Explain geographic concepts, Skill 2.B: Explain spatial patterns, Skill 3.B: Explain spatial relationships, and Skill 6.B: Explain the spatial relationships at different scales. A strong response connects the named diffusion type to a visible pattern, the movement or interaction producing it, and the scale at which the process operates.
Retrieval check: A language spreads when migrants move across an ocean, local speakers modify its grammar, celebrities popularize it, and neighbors begin using it. Identify the diffusion type most clearly shown by each event: migrants carrying it, local modification, celebrity adoption, and neighbor-to-neighbor spread. The sequence is relocation, stimulus, hierarchical, and contagious diffusion.
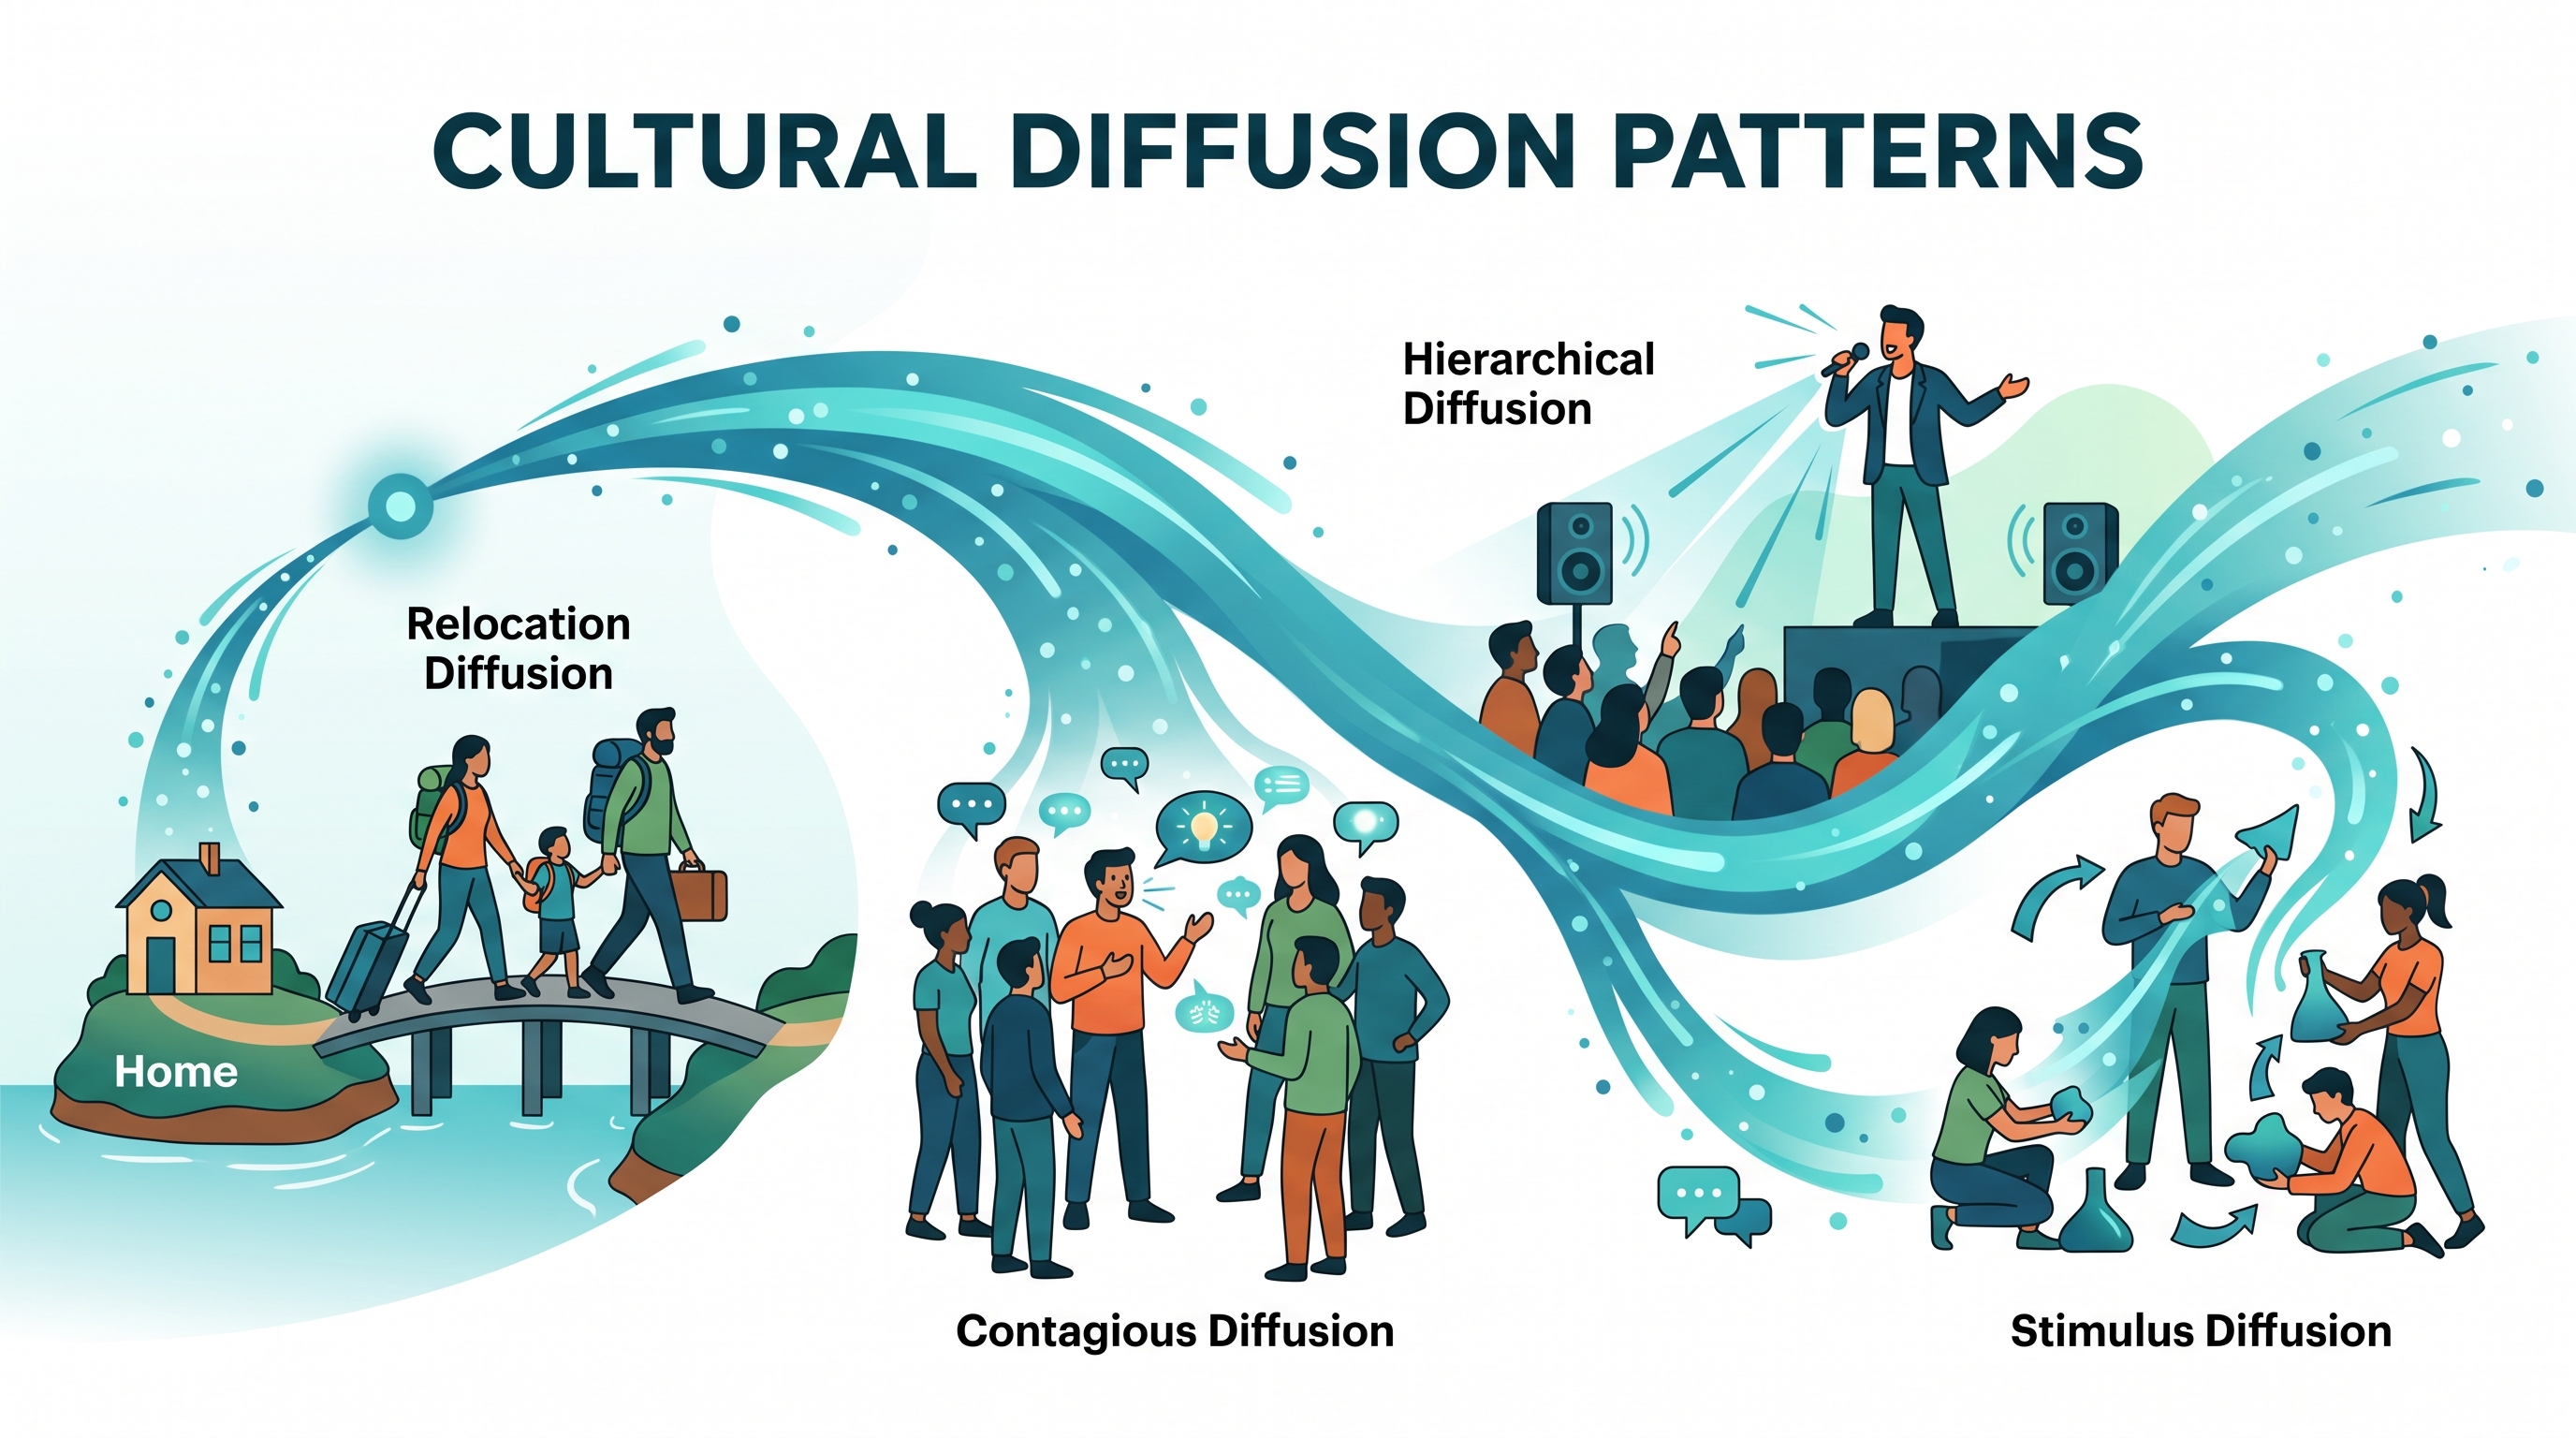
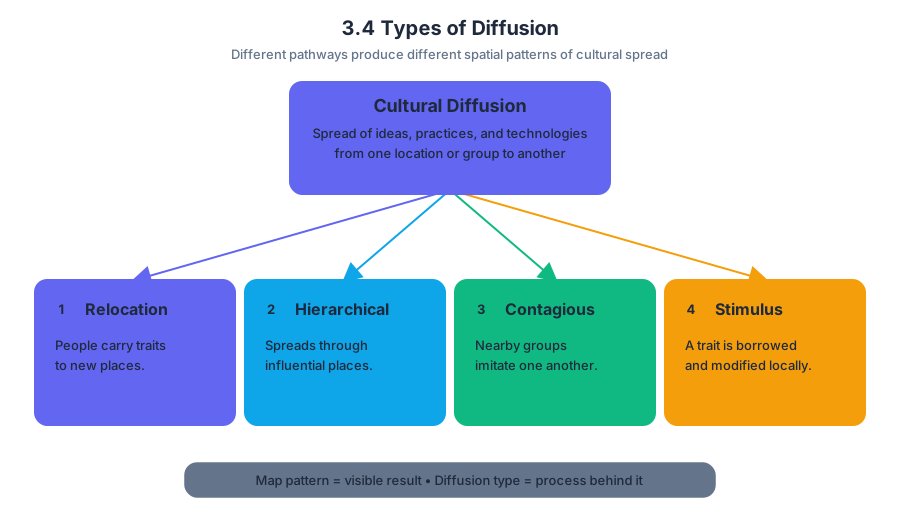
3.5 Historical Causes of Diffusion
Key concepts: Spatial diffusion · Hearths of domestication · Columbian Exchange · Crop diffusion · Colonialism · Indigenous languages · Immigration · Types of diffusion · Historical causes of diffusion · Spatial relationships
A potato domesticated in the Andes became a staple in Ireland, while maize from the Americas transformed diets in Africa and Europe. These changes were not random: historical spatial diffusion is the spread of a cultural trait, crop, language, or practice through time because of migration, trade, conquest,…
3.5 Historical Causes of Diffusion
A potato domesticated in the Andes became a staple in Ireland, while maize from the Americas transformed diets in Africa and Europe. These changes were not random: historical spatial diffusion is the spread of a cultural trait, crop, language, or practice through time because of migration, trade, conquest, colonization, or other connections between places.
SPS-3.A.1 — Historical causes of diffusion: Cultural traits and agricultural products often diffuse from their original hearths because historical processes connect distant places.
From hearths of domestication to global crops
A hearth of domestication is a place where humans first developed the sustained cultivation of a plant or the controlled breeding of an animal. From that hearth, the crop may spread outward through relocation diffusion, trade, conquest, colonization, changing food preferences, or changing agricultural practices.
Historical diffusion often follows a sequence:
- A crop is domesticated in a particular environmental and cultural setting.
- People carry, trade, or impose the crop elsewhere.
- Farmers adapt the crop to new environments and production systems.
- Consumers adopt it because of taste, cost, policy, necessity, or cultural change.
- The crop becomes part of a new agricultural landscape and may later diffuse again.
Worked example: the Columbian Exchange
The Columbian Exchange was the large-scale transfer of plants, animals, people, diseases, and cultural practices between the Americas and Afro-Eurasia after sustained contact began in the late fifteenth century. It is a classic example of historical spatial diffusion because ships, colonial networks, conquest, and trade connected previously separated regions.
Consider the potato. Its hearth of domestication was in the Andes of South America. European colonial and trade networks transported it across the Atlantic; farmers then cultivated it in European environments, and changing agricultural practices and food preferences encouraged wider adoption. The potato therefore diffused far beyond its original hearth.
A strong geographic explanation identifies both the process and the outcome: the Columbian Exchange moved crops through colonization and trade, while new agricultural practices and changing diets allowed those crops to become established in distant regions.
Crop movement could also be accidental. Seeds might travel as “stow-aways” in soil, cargo, animal feed, or shipping containers. Thus, diffusion does not always require a government or farmer to intentionally introduce a crop.
Historical mechanisms that move culture
The major diffusion types provide a useful vocabulary for explaining historical outcomes. The definition must match the mechanism, not merely the fact that something spread.
| Type of diffusion | What spreads and how | Historical example |
|---|---|---|
| Relocation diffusion | People physically move and carry a cultural trait | Immigrants establish restaurants, religious practices, or language communities in a new country |
| Expansion diffusion | A trait spreads outward while remaining strong in its hearth | A crop spreads from a domestication hearth as neighboring farmers adopt it |
| Hierarchical diffusion | A trait moves from influential people or places to others | A colonial capital introduces an administrative language to surrounding territories |
| Contagious diffusion | A trait spreads through direct contact across nearby populations | A food crop passes from one farming community to adjacent communities |
| Stimulus diffusion | The underlying idea spreads but is modified locally | A colonized society adopts an introduced crop but prepares it using local techniques |
For Skill 4.C: 1D Describe a relevant geographic concept, process, model, or theory in a specified context, name the type of diffusion and then connect it to a concrete historical mechanism. “The crop spread” is incomplete; “the crop spread through relocation diffusion as colonial ships transported it from its hearth” explains both the concept and the context.
Colonialism and Indigenous languages
Colonialism is the control of a territory and its people by an external power. Colonial governments frequently imposed their languages through schools, courts, religious institutions, administration, and economic systems. As a result, an Indigenous language might lose speakers, become restricted to private or local settings, or be replaced in government and education by the colonizer’s language.
This pattern must be analyzed at more than one scale. At the local scale, families may continue using an Indigenous language at home. At the national or regional scale, the language may decline if schooling and employment reward use of the colonial language. This connection between scale and language change is central to Skill 5.D: Scale Analysis.
Important distinction: Language change under colonialism is not simply “natural cultural mixing.” It can reflect unequal political power, forced schooling, land dispossession, religious conversion, and economic pressure.
Immigrants, however, may make different choices after relocation. Some adopt the dominant language or cultural patterns to gain access to education, employment, or social acceptance. Others preserve their heritage language, create ethnic institutions, or use both languages. Adoption, maintenance, and blending are possible outcomes; none should be assumed automatically.
Reading a diffusion pattern as evidence
For Skill 2.C: Spatial Relationships, connect the observed pattern to relationships among places. If a crop appears in former colonies linked by one empire, colonial trade routes are a plausible cause. If an Indigenous language declines most sharply near colonial schools and administrative centers, political and economic institutions may explain the spatial pattern.
For Skill 4.B: Source Analysis, examine what a map, passage, or dataset actually shows before explaining it. Identify the geographic pattern, locate the likely hearth, compare connected regions, and then infer the historical process. A map of present-day distribution alone cannot prove whether diffusion occurred through trade, migration, conquest, or accidental transport; additional historical evidence is needed.
Misconception check
Misconception: “A crop’s current center of production must be its hearth of domestication.” Modern production reflects later diffusion, market demand, colonial history, technology, and environmental adaptation. The Andes remain the potato’s domestication hearth even though major potato production also occurs far beyond South America.
Retrieval check: A map shows a crop concentrated in several regions formerly connected by European colonial trade. Explain, in one sentence, how the Columbian Exchange could account for the pattern, naming the crop’s hearth of domestication and one intentional or accidental diffusion mechanism.
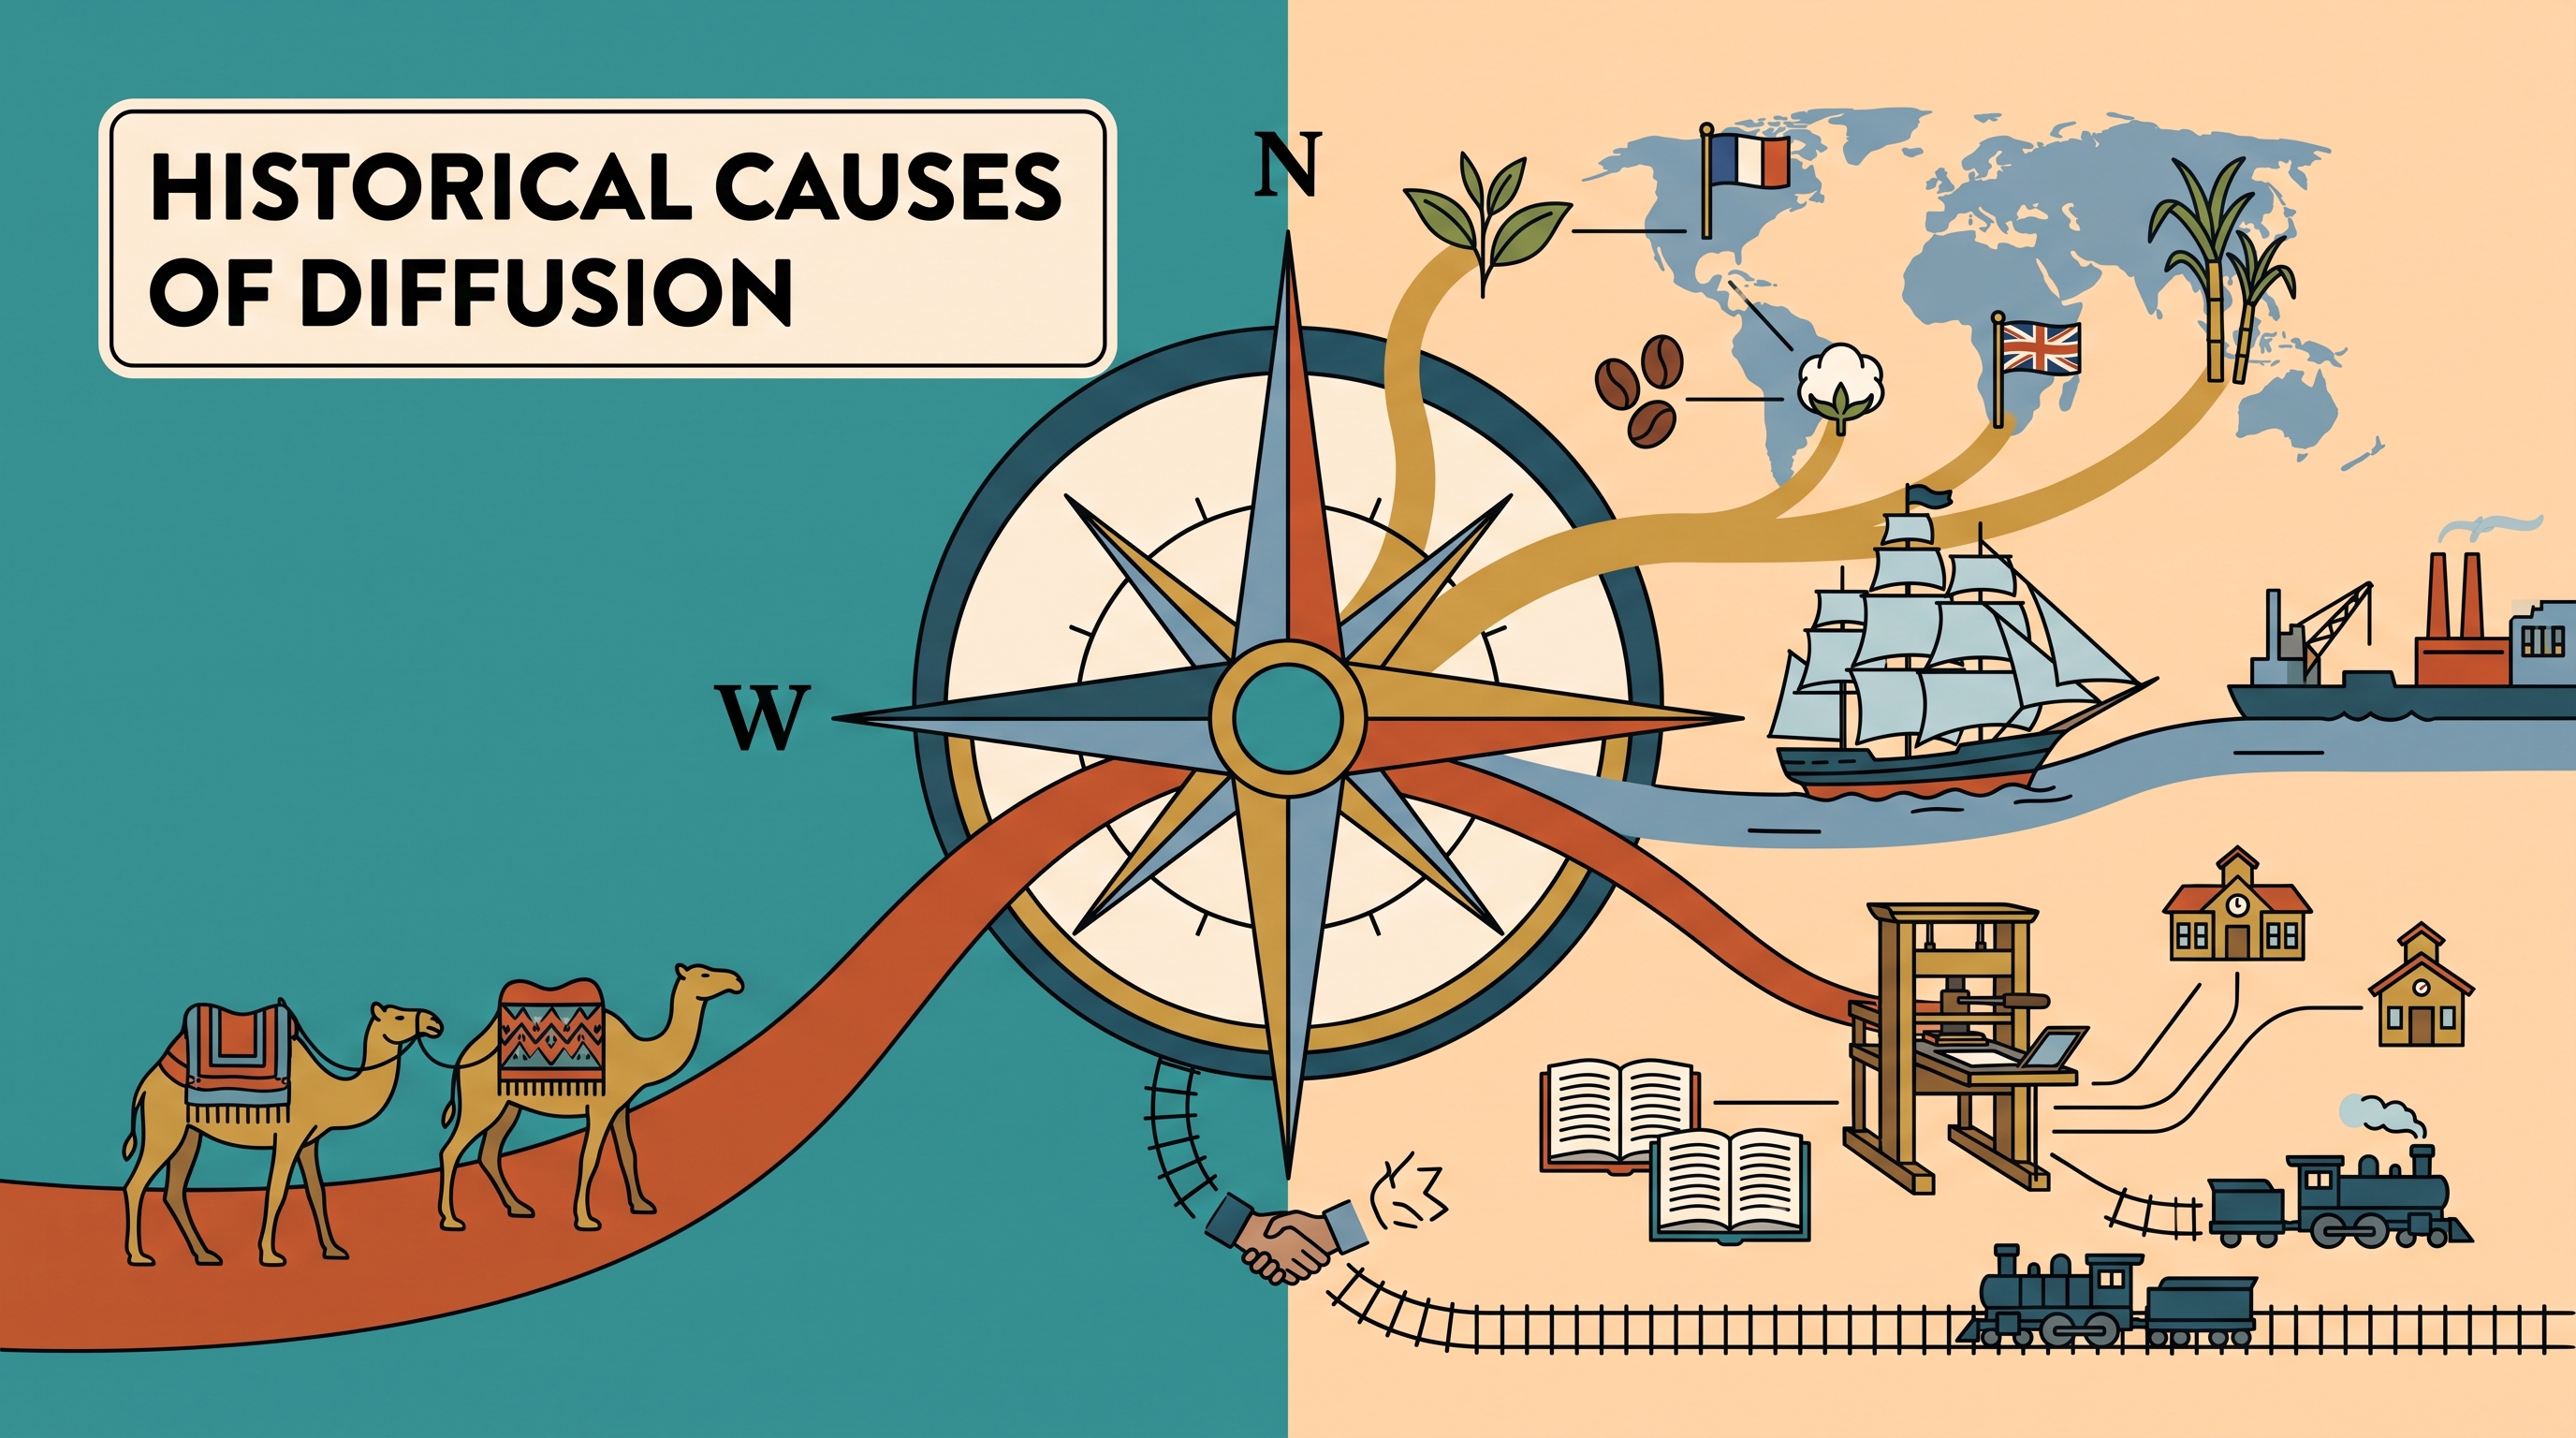
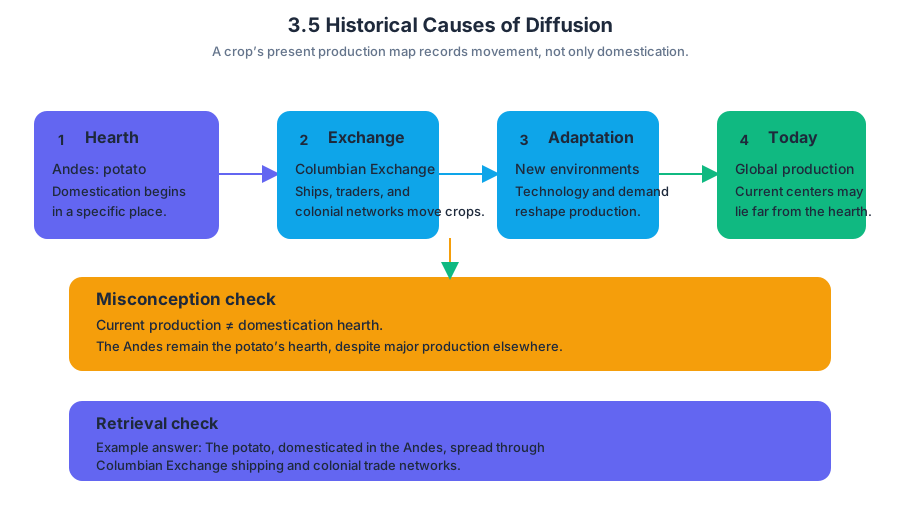
3.6 Contemporary Causes of Diffusion
Key concepts: Contemporary causes of diffusion · Cultural landscapes · Asian ethnic-group neighborhoods · Toponyms and religious diffusion · Agricultural practices and environmental effects · Chemical inputs and pollution · Mechanized farming · Irrigation and water competition · Conflicts between farmers and nomadic herders · Spatial relationships and source analysis
Contemporary causes of diffusion are modern forces that move cultural traits, practices, ideas, and technologies across space. Communication technologies, migration, transportation, globalization, and economic connections can make cultural contact faster and more extensive—but diffusion does not produce identical…
3.6 Contemporary Causes of Diffusion
Contemporary causes of diffusion are modern forces that move cultural traits, practices, ideas, and technologies across space. Communication technologies, migration, transportation, globalization, and economic connections can make cultural contact faster and more extensive—but diffusion does not produce identical places everywhere.
Core idea: Contemporary diffusion changes cultural landscapes by increasing contact among people and places.
Reading a Cultural Landscape Through Diffusion
A cultural landscape is the visible imprint of culture on the environment. Neighborhood names, restaurants, religious buildings, languages on signs, agricultural fields, and patterns of land use can all reveal where cultural traits have diffused.
For example, a map of Los Angeles County may show neighborhoods associated with Chinese, Korean, Japanese, Filipino, or other Asian ethnic groups. If two or more ethnic-group neighborhoods overlap or occur near one another, the map shows a zone of cultural interaction rather than a single isolated cultural region.
When analyzing a map stimulus, do not stop at “the neighborhoods are clustered.” A complete spatial description identifies what is clustered and where it is clustered—for example, Chinese ethnic neighborhoods may be concentrated inland, away from the coast, or in the eastern and northeastern portions of Los Angeles County.
Worked map analysis
Suppose a map uses different colors for Asian ethnic-group neighborhoods. Three colors overlap in an inland portion of the county, while coastal areas show few or no marked neighborhoods.
Step 1 — Identify the pattern: The neighborhoods are clustered rather than randomly distributed.
Step 2 — Locate the pattern: The cluster is inland and toward the eastern or northeastern part of the county.
Step 3 — Interpret the pattern: The overlap indicates that multiple Asian ethnic groups reside in the same broad area, creating opportunities for cultural exchange, shared services, and the development of a multicultural landscape.
This reasoning demonstrates Skill 4.A: Source Analysis and applies PSO-3.C.1 from Topic 3.2, Cultural Landscapes, together with SPS-3.A.3 from Topic 3.6. The map is evidence; the answer must use its locations, not merely repeat a general geography term.
Misconception check — “Clustered” is enough: It is not. Without a directional or locational phrase tied to the map, “clustered” fails to describe the stimulus precisely.
Communication Technologies and Cultural Convergence
Modern communication technologies can accelerate diffusion by connecting people who are separated by great distances. Mobile phones, internet access, social media, and digital broadcasting can allow cultural information to circulate among groups that previously interacted less frequently.
This process may produce cultural convergence, meaning that different groups adopt increasingly similar cultural traits. However, the degree of convergence matters. Greater access to communication technology may create some convergence among nomadic herders by spreading music, clothing styles, language expressions, or consumer preferences, but it does not automatically erase local identity or make all groups culturally identical.
A strong explanation of degree uses a qualifier such as limited, moderate, or substantial, followed by evidence and reasoning:
Increased access to communication technologies may create moderate cultural convergence because nomadic herders can exchange media and consumer practices more easily, although distance, local traditions, and uneven access to technology can preserve cultural differences.
This applies SPS-3.A.4 and Skill 2.E: Scale Analysis when the response connects technology at the individual or community scale to broader cultural change.
Toponyms and Religious Diffusion
A toponym is a place name. Toponyms can preserve evidence of cultural diffusion because religious groups may name settlements, streets, rivers, or regions after sacred figures, religious events, or places associated with their faith.
The name becomes part of the cultural landscape even when the population later changes. Therefore, to identify the relationship, connect the chain explicitly:
$$ \text{religious diffusion} \rightarrow \text{settlement or cultural influence} \rightarrow \text{religious toponym} $$
Misconception check — “Toponym means religious place”: A toponym is any place name, not specifically a religious name. Religion is one possible cause of a toponym’s origin.
Agricultural Practices, Irrigation, and Environmental Effects
Contemporary diffusion also spreads agricultural practices and technologies. Irrigation, chemical inputs, and mechanized farming can raise production, but they may create environmental or social consequences.
Chemical inputs such as fertilizers and pesticides can increase pollution when runoff enters soil and waterways. Mechanized farming can produce negative environmental effects through soil compaction, habitat disruption, fuel use, or increased erosion. An AP explanation must connect the effect to the specific practice:
| Agricultural practice | Negative environmental effect | Causal connection |
|---|---|---|
| Chemical inputs | Increased pollution | Fertilizer or pesticide runoff contaminates soil and water |
| Mechanized farming | Soil degradation or habitat disruption | Heavy machinery compacts soil or clears larger areas rapidly |
| Increased irrigation | Water competition | More water is diverted to farms, reducing availability for other users |
This applies Skill 2.B: Spatial Relationships and IMP-5.A.1 and IMP-5.A.2 from Topic 5.10, Consequences of Agricultural Practices. Naming pollution alone is incomplete; the response must explain how chemical inputs caused it.
Irrigation and Conflict With Nomadic Herders
Increased irrigation can create competition for water between farmers and nomadic herders. Farmers may divert more water to crops, while nomadic herders depend on the same water sources for livestock and seasonal movement.
Consider this original chart:
| Area | Irrigated farmland | Water available for grazing routes | Reported tension |
|---|---|---|---|
| A | Low | High | Low |
| B | Moderate | Moderate | Moderate |
| C | High | Low | High |
The pattern supports a causal explanation: as irrigation increases, less water remains available for nomadic herders, increasing competition and potentially producing tension or conflict between the two groups. This uses Skill 4.F: Source Analysis, PSO-5.A.3, and IMP-5.A.2.
Exam-ready distinction: Farmers and nomadic herders are different groups with competing water needs. Do not treat them as interchangeable, and do not cite unrelated chart information as the cause of conflict.
Retrieval Check
A map shows several Asian ethnic-group neighborhoods clustered inland in the eastern portion of a county. A table shows that areas with increased irrigation have less water available for grazing and more conflict. Identify one spatial pattern and explain one causal relationship shown by the table.
A complete response would state that the neighborhoods are clustered inland and eastward, then explain that increased irrigation diverts water toward farms, intensifying competition with nomadic herders and increasing tension.

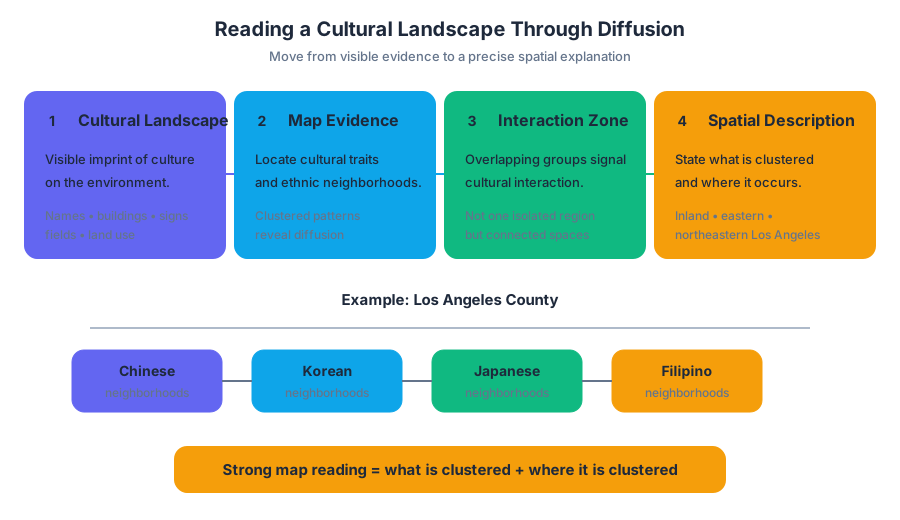
3.7 Diffusion of Religion and Language
Key concepts: Culture traits and the cultural landscape · Placemaking and sense of place · Centripetal and centrifugal cultural forces · Relocation diffusion · Hierarchical diffusion · Contagious diffusion · Stimulus diffusion · Language creolization · Diffusion of religion and religious toponyms · Cultural diffusion and musical syncretism
Language and religion do more than communicate ideas or express belief: they leave visible patterns across Earth’s surface. A place-name, mosque, church, bilingual road sign, festival, restaurant, or musical tradition can reveal how cultural traits moved, mixed, and became attached to place.
3.7 Diffusion of Religion and Language
Language and religion do more than communicate ideas or express belief: they leave visible patterns across Earth’s surface. A place-name, mosque, church, bilingual road sign, festival, restaurant, or musical tradition can reveal how cultural traits moved, mixed, and became attached to place.
Learning Objective 3.7: Explain how language and religion influence cultural patterns.
Essential Knowledge 3.7.A: Language and religion are key elements of culture.
Essential Knowledge 3.7.B: Language and religion diffuse from cultural hearths through relocation and expansion processes.
Essential Knowledge 3.7.C: Language and religion influence cultural patterns and cultural landscapes.
Culture becomes visible in the landscape
A culture trait is a particular practice, technology, belief, or material expression transmitted by a society. Culture traits include food preferences, art, architecture, language, religion, music, clothing, media, technology, and land use.
A cultural landscape is the visible imprint of human culture on the environment. For example, a landscape containing Hindu temples, vegetarian restaurants, sari shops, cricket fields, and signs written in several languages reflects overlapping cultural traits rather than a single isolated tradition.
Placemaking is the process through which people create meaningful places, while sense of place is the emotional and cultural meaning people attach to a location. Language and religion strengthen both: a neighborhood’s religious buildings, murals, street names, foods, and public celebrations can make it recognizable to insiders and outsiders.
Religious diffusion can also produce toponyms, or place-names. A name such as San Francisco reflects the historical diffusion of Christianity and Spanish influence; names associated with local Indigenous languages may preserve earlier cultural landscapes even after political control changes.
Cultural forces: unity and division
A cultural trait can operate as a centripetal force, a force that unifies people, or a centrifugal force, a force that divides them. A shared language may help residents communicate across a state and build collective identity. However, language or religious differences may produce political tension when one group receives greater recognition, resources, or authority than another.
| Cultural pattern | Likely geographic effect |
|---|---|
| Shared language in public institutions | Greater communication and cohesion |
| Common religious celebrations | Shared identity and placemaking |
| Several languages without equal recognition | Possible political or social division |
| Religious or linguistic boundary | Distinct cultural regions or conflict zones |
Misconception check: A cultural difference is not automatically a centrifugal force. It becomes divisive when it is connected to unequal power, exclusion, territorial claims, or competing identities.
Four pathways of diffusion
Relocation diffusion occurs when ideas or practices move with people to a new or distant location, including across a geographic barrier. Migrants may carry language, food, clothing, religion, music, or sport to a destination. Immigrants may also adopt culture traits from the majority population, producing a landscape with both retained and adopted traditions.
Hierarchical diffusion spreads an idea or practice from one important city, community, or person to another. A religious movement may spread through influential institutions, while a language may gain users when governments, schools, media companies, or major cities promote it.
Contagious diffusion spreads ideas or practices from person to person or along a transportation line. Face-to-face interaction, pilgrimage routes, migration corridors, and expanding networks can move a cultural trait outward through connected communities.
Stimulus diffusion occurs when one culture borrows an idea or practice but alters it. The receiving society accepts the underlying concept while adapting its form to local beliefs, resources, tastes, or rules.
Worked example: animals and cultural exchange
Domesticated pigs diffused from a Eurasian hearth through Asia and Europe with nomadic herders. This is primarily relocation diffusion because people transported the animal and the associated practice of raising it.
The Columbian Exchange later introduced domesticated animals to the Americas. The geographic result was not simply “one culture replacing another”: animals, farming practices, diets, labor systems, and land uses interacted with existing societies. The resulting cultural landscapes depended on local environments, beliefs, and economic systems.
Language creolization
Creolization is the process by which contact between groups speaking different or mutually unintelligible languages produces a new language or dialect. The new language blends selected features from two or more original languages and becomes a new form of communication.
For a one-point response, the essential chain is:
$$ \text{language contact} \rightarrow \text{mixing or syncretism} \rightarrow \text{new language or dialect} $$
For example, when speakers of different languages interact over time, the resulting creole may incorporate vocabulary from one language, grammatical structures from another, and pronunciation patterns shaped by both communities.
Music as cultural mixing
When different musical styles come into contact, their elements may combine to create a new style, tradition, instrument, dance, or genre. This is a cultural expression of stimulus diffusion and, in some cases, syncretism: the receiving culture does not merely copy a tradition but reshapes it.
AP Skill connection: 1.A: Identify geographic concepts, processes, models, and theories and 1.B: Describe geographic concepts, processes, models, and theories are used when distinguishing relocation, hierarchical, contagious, and stimulus diffusion. 2.A: Describe spatial patterns and 2.B: Explain spatial patterns are used when interpreting the distribution of languages, religions, toponyms, or cultural landscapes. 4.A: Identify relevant information from geographic data supports analysis of maps and photographs showing cultural patterns. 5.A: Identify the scales of analysis matters because a language can be dominant nationally but minority-language neighborhoods may remain visible locally.
Retrieval check: A language spreads from migrants to a distant city, is promoted by a national government, and is then blended with a local language. Identify the diffusion process most directly shown in each stage: migration, government promotion through major institutions, and language mixing.
Answer: relocation diffusion; hierarchical diffusion; and creolization through language contact.
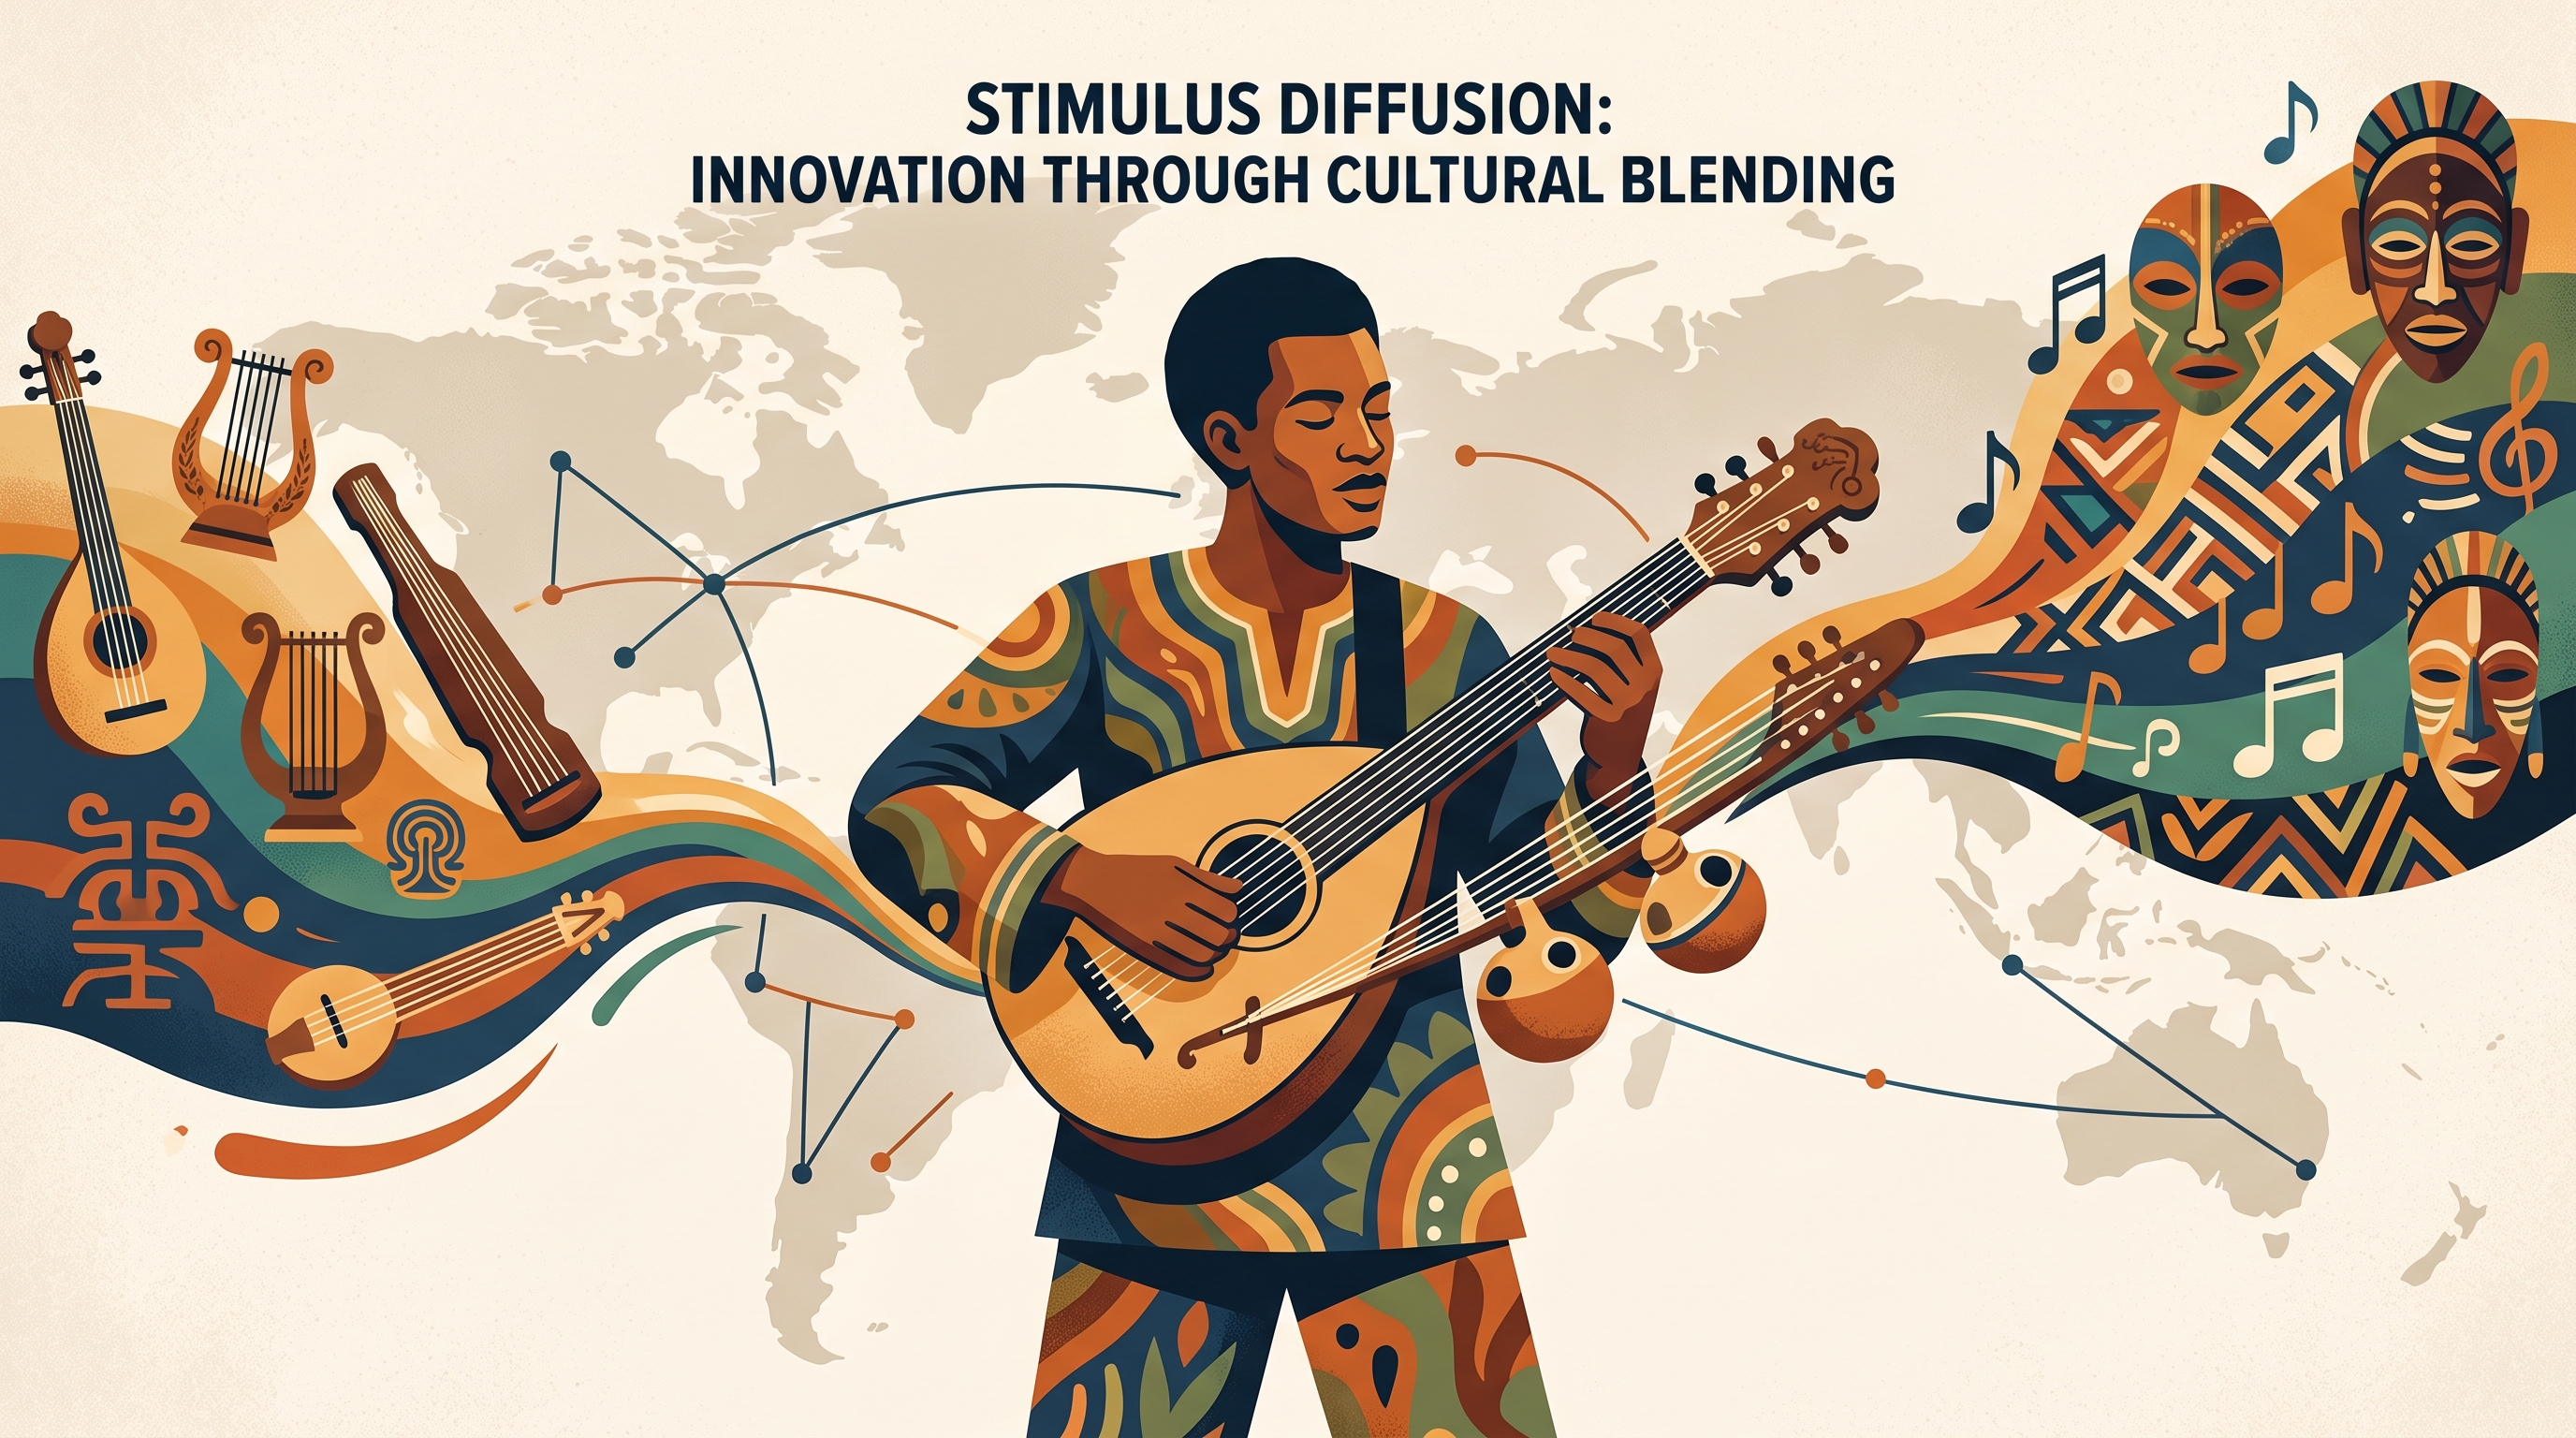
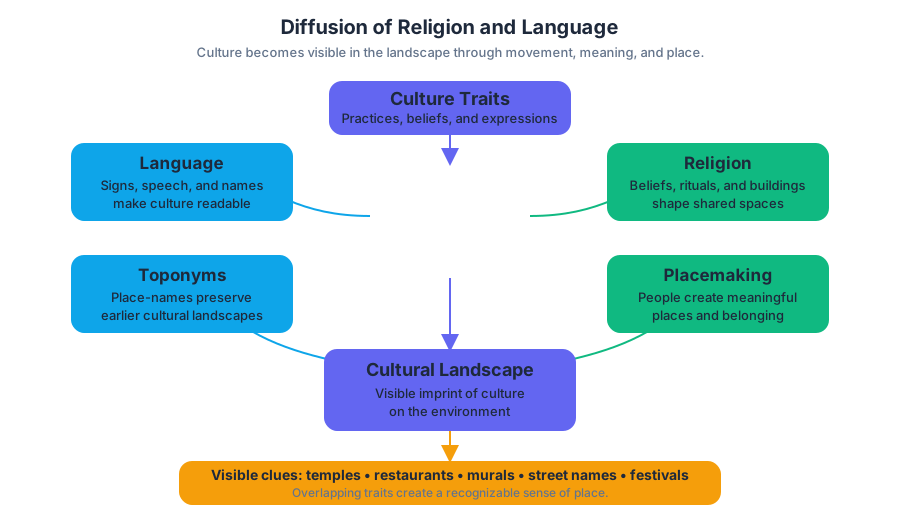
3.8 Effects of Diffusion
Key concepts: Diffusion · Effects of diffusion · Agriculture · Learning objectives · SPS-3.B · Enduring Understanding
Diffusion changes a cultural landscape when an idea, practice, technology, language, religion, or material object spreads from one place to another and is adopted, adapted, blended, or resisted.
3.8 Effects of Diffusion
Diffusion changes a cultural landscape when an idea, practice, technology, language, religion, or material object spreads from one place to another and is adopted, adapted, blended, or resisted. A crop introduced into a new region, for example, can alter not only diets but also farm fields, markets, irrigation systems, settlement patterns, and the appearance of the landscape.
The key question is not simply where did a cultural trait spread? It is: What changed because the trait spread, and did the receiving society replace, combine, or preserve its existing practices?
From diffusion to landscape change
The cultural landscape is the visible imprint of human culture on Earth’s surface. It includes buildings, road patterns, religious structures, agricultural fields, clothing, signs, languages displayed in public, and land-use patterns. Diffusion affects this landscape when a cultural trait becomes visible in everyday spaces or changes how people organize and use places.
A useful cause-and-effect chain is:
- A cultural trait originates or becomes established in a source area.
- The trait spreads through relocation or expansion diffusion.
- People in the receiving area encounter the trait.
- The receiving society adopts, modifies, combines, or rejects it.
- The cultural landscape changes in response.
The result is not always cultural replacement. Diffusion can produce several different outcomes, and the same diffusion process may create different outcomes in different places.
Four effects of cultural diffusion
| Effect | Plain-language meaning | What may appear in the cultural landscape |
|---|---|---|
| Acculturation | The adoption of some traits from another culture while important elements of the original culture remain | New foods, clothing, technologies, or architectural styles alongside older traditions |
| Assimilation | The process by which a cultural group becomes absorbed into another culture, often losing many original traits | Reduced visibility of the original language, customs, or institutions |
| Syncretism | The blending of elements from different cultures into a new cultural practice | Hybrid religious practices, foods, music, art, or architectural forms |
| Multiculturalism | The coexistence of multiple cultural traditions within the same society or place | Multiple languages, religions, cuisines, festivals, and building styles existing together |
Acculturation is selective. A community may adopt a new agricultural technology but retain its traditional food preferences and social institutions. Assimilation is more extensive: the receiving or minority group adopts the dominant culture to such an extent that distinct cultural traits may become less visible.
Syncretism differs from simple borrowing because the result is a combination that creates something meaningfully new. Multiculturalism differs from assimilation because cultural differences remain visible and socially recognized rather than being absorbed into one dominant pattern.
Worked example: agricultural diffusion
Imagine that farmers in a region begin cultivating a crop introduced from another cultural hearth. At first, the crop may be added to existing fields without eliminating local crops. This is an example of acculturation: farmers adopt one useful trait while preserving much of the original agricultural system.
If the new crop becomes dominant, local food traditions and farming practices may decline. The landscape could shift toward larger areas planted with the introduced crop, new storage facilities, specialized markets, and transportation routes. If farmers combine the introduced crop with local cultivation methods, the result demonstrates syncretism rather than complete replacement.
A region may also maintain several agricultural traditions at once. Different communities could grow the introduced crop, preserve older crops, and use distinct farming techniques in nearby areas. That visible coexistence illustrates multiculturalism.
Misconception check: diffusion is not automatic assimilation
Common misconception: Every cultural trait that spreads causes the receiving culture to become like the source culture.
Correction: Diffusion produces changes, but the changes may involve selective adoption, blending, coexistence, or loss. To identify the effect, examine what happened to the original cultural traits: did they remain, combine with incoming traits, coexist with them, or largely disappear?
CED alignment
The broader Enduring Understanding connects cultural patterns to spatial processes and societal change. Under Learning Objective SPS-3.B, students must “Explain how the process of diffusion results in changes to the cultural landscape.” The required knowledge is identified as Essential Knowledge SPS-3.B.1: “Acculturation, assimilation, syncretism, and multiculturalism are effects of the diffusion of culture.”
For an AP-style explanation, name the diffusion-related change, identify the cultural trait involved, and connect that change to a visible or organized feature of the cultural landscape. “A crop spread” is incomplete; “the introduced crop changed field patterns, markets, and food practices while local methods remained” explains the effect.
Retrieval check
A language, food, or farming practice spreads into a new region. Residents adopt it but retain many original traditions, while some communities blend it with local practices. Which two effects are most directly represented, and what evidence would distinguish them?
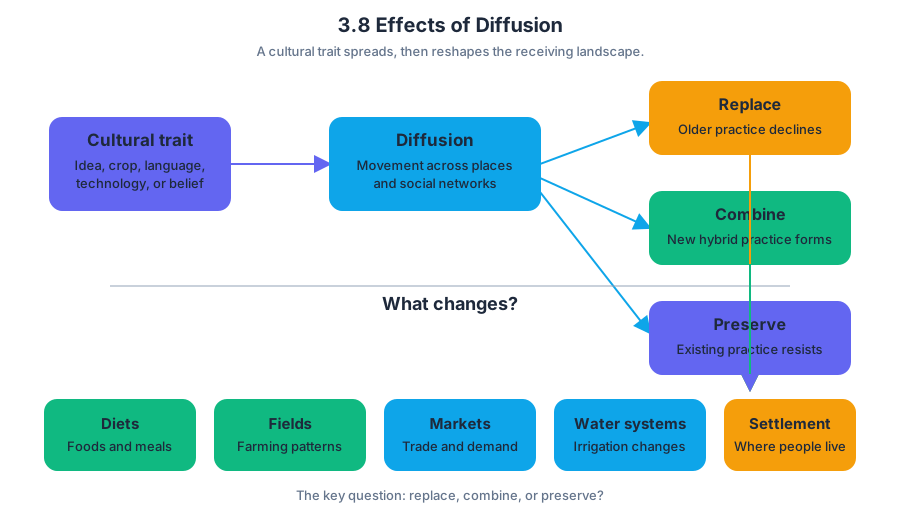
4.1 Introduction to Political Geography
Key concepts: Political organization of space · Historical and current political processes and events · State sovereignty · Supranational organizations · Challenges to state sovereignty · EU and ASEAN · Communication technologies and sovereignty · Resource disputes on land and at sea · Gerrymandering
Political geography asks a deceptively powerful question: who controls which space, and how did that arrangement come to exist? The political organization of space results from historical and current processes, events, and ideas, so a political map is not simply a picture of borders—it is a record of conflict,…
4.1 Introduction to Political Geography
Political geography asks a deceptively powerful question: who controls which space, and how did that arrangement come to exist? The political organization of space results from historical and current processes, events, and ideas, so a political map is not simply a picture of borders—it is a record of conflict, cooperation, empire, independence, identity, and power.
PSO-4: The political organization of space results from historical and current processes, events, and ideas.
Political entities: the building blocks of the map
An independent state is a sovereign political entity with its own autonomous government. Sovereignty means the authority to control a territory, make and enforce laws, and conduct internal and external affairs without being controlled by another state. Independent states are the primary building blocks of the world political map.
A nation is a group of people who share a common identity, often based on language, religion, ethnicity, history, or cultural traditions. A nation-state exists when the boundaries of a sovereign state largely correspond to the territory of one nation. A stateless nation is a nation that does not control an independent state of its own. A multinational state contains two or more nations within one sovereign territory, while a multistate nation is a nation whose members live across the boundaries of several states. Autonomous and semiautonomous regions, such as Native American reservations, possess some degree of self-government but do not have complete sovereignty.
A useful diagnostic is to separate identity from political authority: a nation describes a people, while a state describes a sovereign territorial-political organization. A nation may seek self-determination—the right of a people to choose its political status—without already being a state.
PSO-4.A: For world political maps, define the different types of political entities and identify a contemporary example of political entities.
PSO-4.A.1: Independent states are the primary building blocks of the world political map.
PSO-4.A.2: Types of political entities include nations, nation-states, stateless nations, multinational states, multistate nations, and autonomous and semiautonomous regions, such as Native American reservations.
Why political boundaries change
Contemporary boundaries reflect both older and ongoing processes. Colonialism established external control over territories; imperialism expanded political or economic influence; independence movements later challenged those arrangements. Devolution along national lines transfers power from a central government to a regional group seeking greater autonomy, and sometimes produces new political boundaries.
For example, a boundary may divide a culturally connected nation, while a state may contain several nations because earlier colonial or diplomatic processes grouped them together. The resulting map can therefore produce political tensions when the boundaries of government do not match the geography of identity, resources, or historical claims.
Supranational organizations and sovereignty
A supranational organization is an institution in which states cooperate around shared goals and may accept rules or monitoring that operate above the individual state. Such organizations can address transnational challenges, coordinate trade or security, reduce regulatory and transaction costs, and increase regional economic power.
The European Union (EU) illustrates deeper supranational cooperation through shared economic, legal, and political arrangements. The Association of Southeast Asian Nations (ASEAN) promotes regional cooperation among Southeast Asian states. Both can challenge sovereignty because member states may coordinate policies, follow common agreements, or accept oversight that limits completely independent decision-making in particular areas.
Key distinction: Supranational cooperation does not mean that member states cease to exist. It means that states voluntarily share some authority to achieve goals that may be difficult to accomplish separately.
Technology, resources, and contested control
Advances in communication technology may affect state sovereignty by allowing people, social movements, corporations, and governments to communicate political claims rapidly and to much larger audiences. Digital communication can strengthen a state, encourage democratization, support devolutionary movements, or increase a supranational organization’s ability to monitor whether member states follow shared agreements.
Political disputes over resources may occur on land or at sea. States can contest territory because control over a location may provide access to valuable minerals, energy reserves, fisheries, transportation routes, or freshwater. A boundary dispute is therefore not only a disagreement about lines on a map; it can also be a struggle over political authority and economic opportunity.
Gerrymandering: boundaries inside a state
Gerrymandering is the deliberate redrawing of electoral-district boundaries to give an advantage to a political party or group. It is a political-geography concept because it shows how the organization of space can influence political representation without changing the state’s international borders.
Misconception check — “A nation and a state are the same thing.”
They are not. A nation is a people with a shared identity; a state is a sovereign political territory. A stateless nation demonstrates why the distinction matters.
Skill connection and retrieval check
This topic is assessed through Skill 1.A: Concepts and Processes, especially when defining an independent state, distinguishing political entities, or explaining how sovereignty is affected. A strong response names the concept precisely and connects it to political authority over territory rather than offering only a vague description of “a country.”
Quick check: A culturally unified people lives across three countries, has no sovereign government of its own, and seeks political independence. Is it best described as a nation-state, multinational state, multistate nation, or stateless nation? Answer: stateless nation. Its shared identity exists, but it lacks an independent state exercising sovereignty over its own territory.
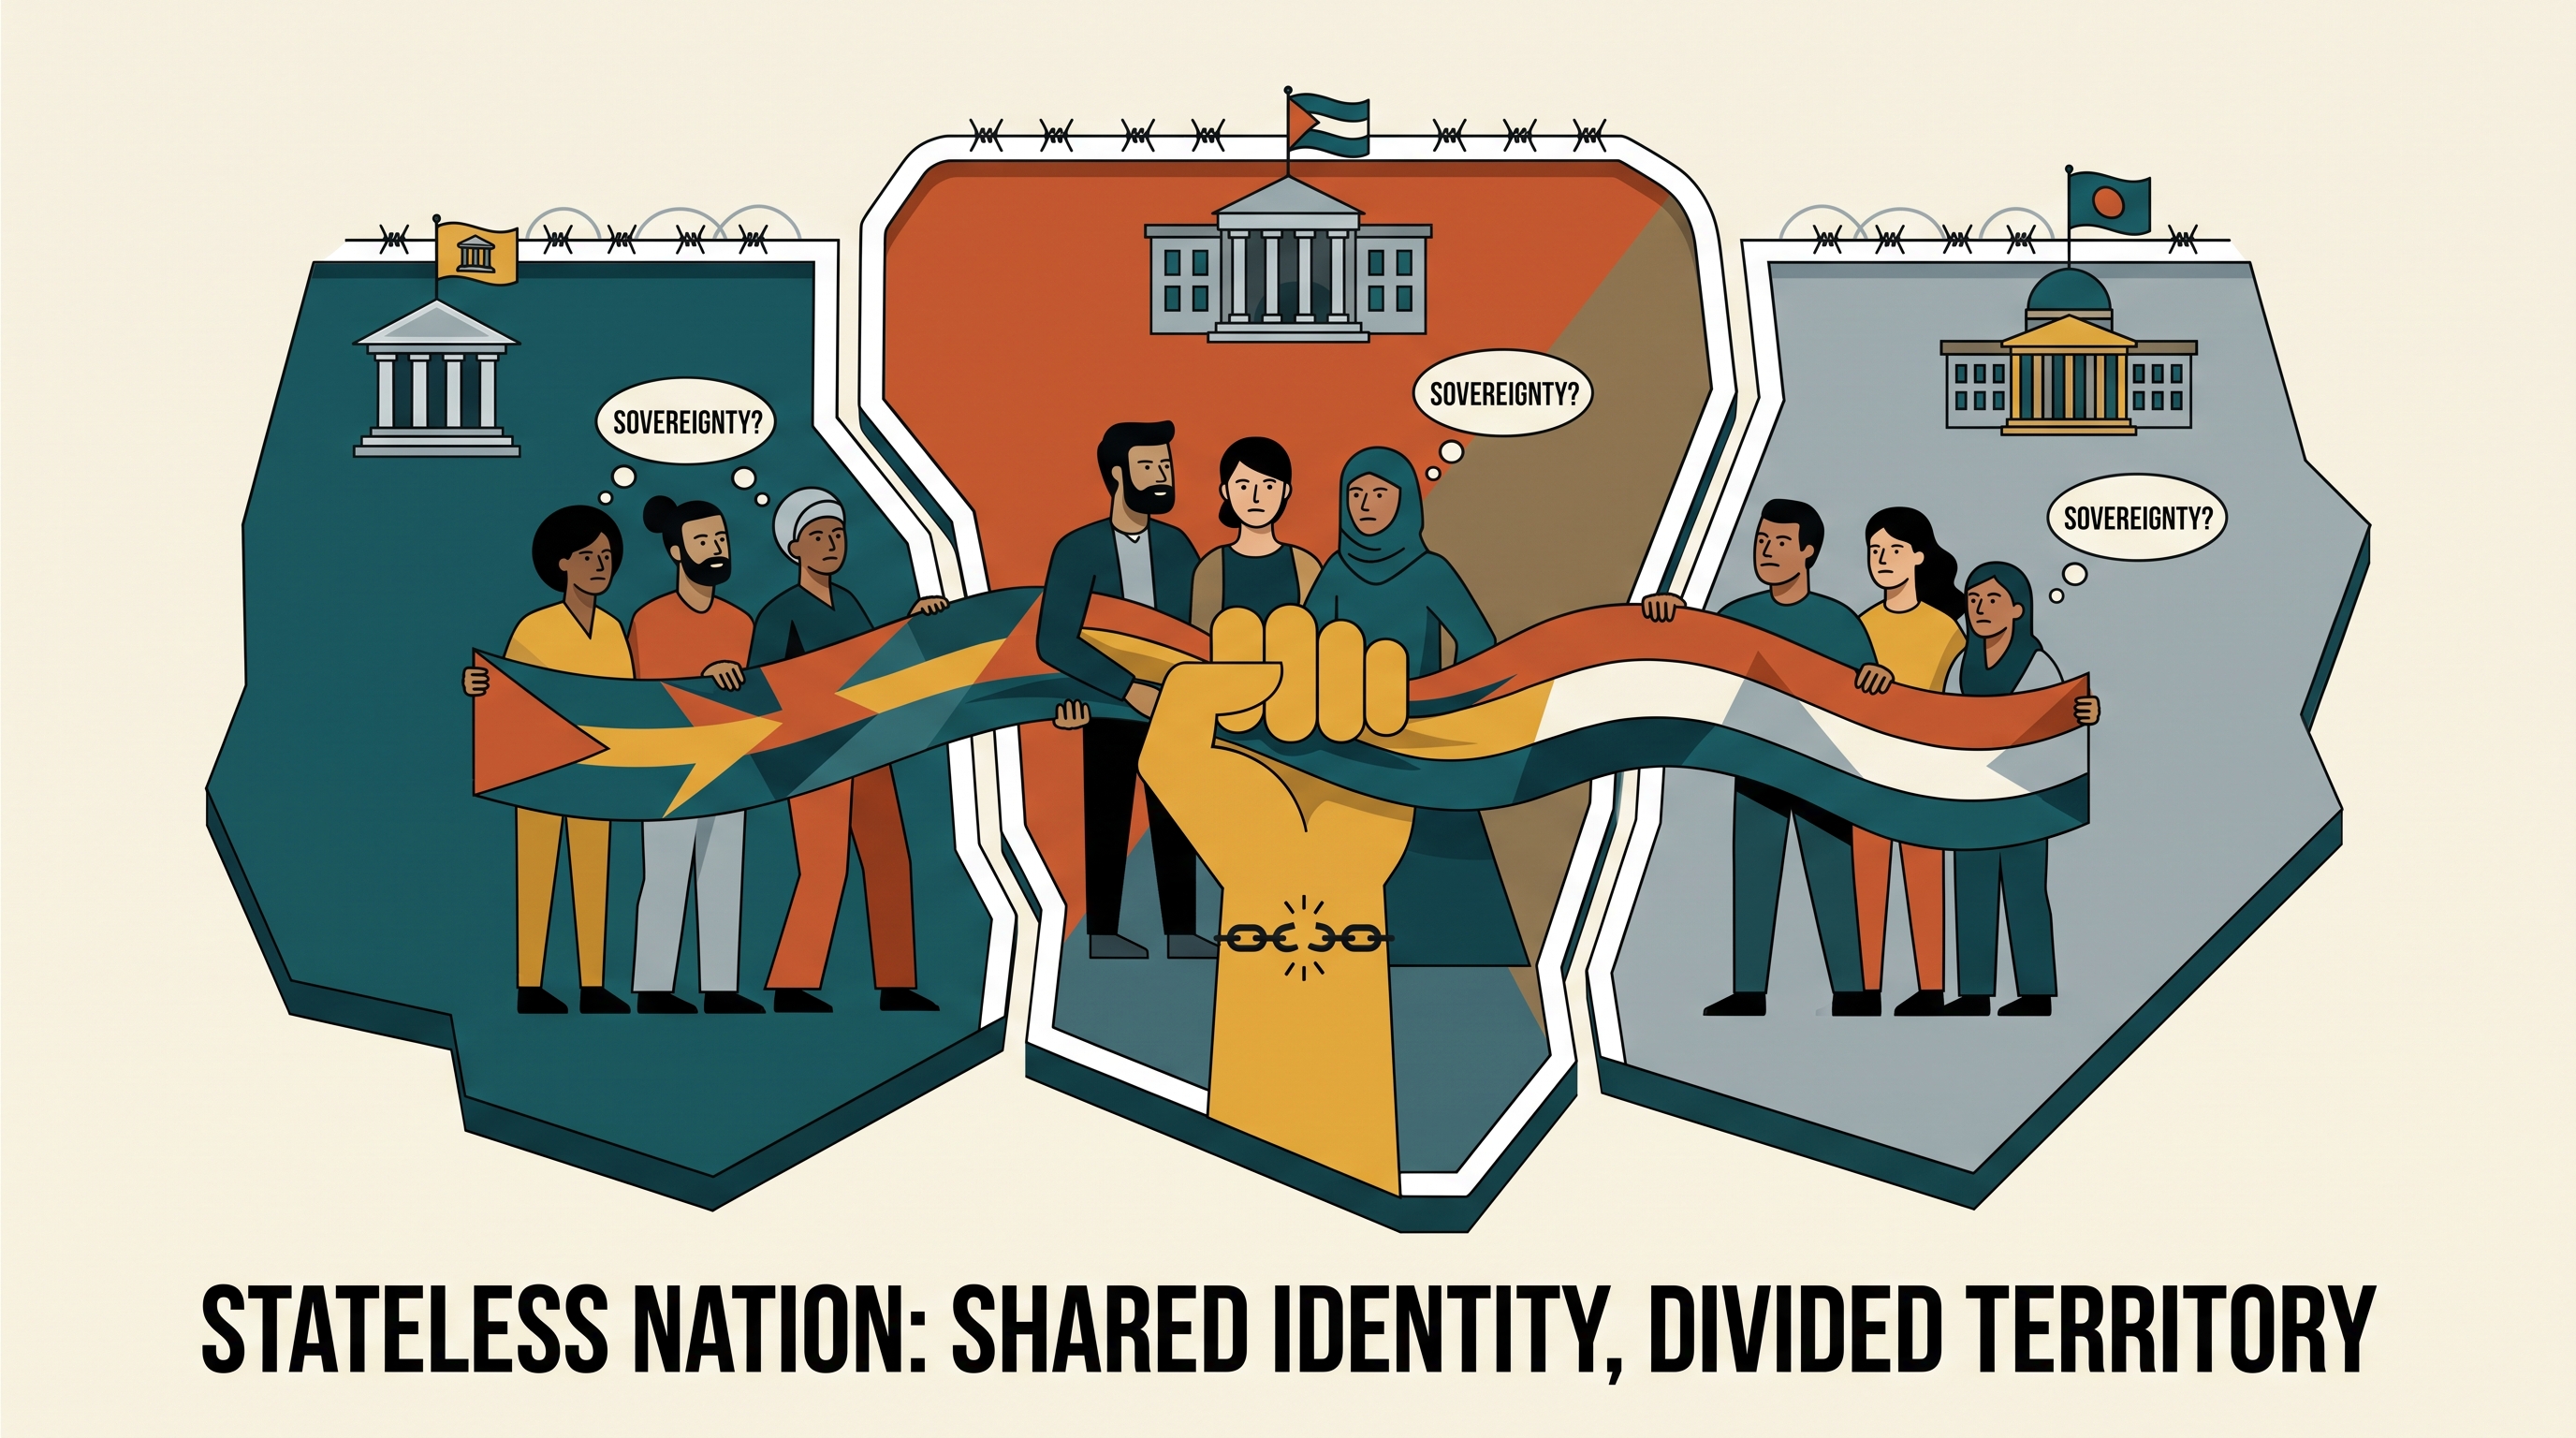
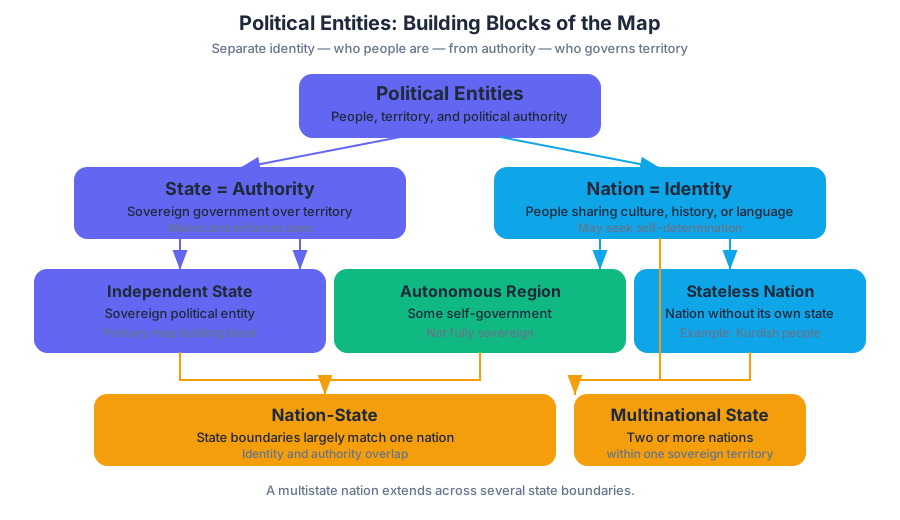
4.2 Political Processes
A boundary may look like a line on a map, but political processes determine who draws it, who votes within it, and whose interests receive attention afterward.
4.2 Political Processes
A boundary may look like a line on a map, but political processes determine who draws it, who votes within it, and whose interests receive attention afterward. Political processes are the actions and institutions through which people and governments make collective decisions, including elections, representation, policymaking, and the organization of voting districts.
Learning Objective 4.2.A: Explain how political processes impact the spatial organization of society.
Political decisions are never purely “nonspatial.” They organize territory by deciding which people belong to the same district, which communities share a government, where public resources are invested, and how political power is distributed across space. This makes Topic 4.2 a direct application of the course’s recurring ideas of Patterns and Spatial Organization (PSO) and Spatial Process and Societal Change (SPS).
Elections turn space into political representation
An election connects a population to a territory. Voters are grouped into geographic units—precincts, wards, constituencies, or districts—and those units determine how votes become seats or political authority. Because the design of these units affects outcomes, the same population can produce different political results under different spatial arrangements.
Representation means acting politically on behalf of a population. Ideally, districts contain roughly equal populations so that each person’s vote has comparable influence. In practice, representation can be shaped by uneven population growth, territorial boundaries, voting rules, and decisions about which communities are grouped together.
Worked example: redistricting after population change
Imagine a region with three districts, each intended to contain approximately $100{,}000$ residents. Over a decade, one urban area grows to $160{,}000$ people while a rural area declines to $60{,}000$. If the boundaries remain unchanged, an urban resident and a rural resident no longer have equal representational weight: one elected official represents many more people in the urban district than in the rural district.
A redistricting process redraws the district boundaries to reflect the new population distribution. That process may improve political equality, but the exact map still matters. If urban neighborhoods are divided among several districts, their shared interests may be diluted; if they remain concentrated in one district, they may gain stronger collective representation.
Redistricting and gerrymandering
Redistricting is the redrawing of electoral boundaries, usually after a census or other population count. Redistricting is necessary when population distributions change, but it can also become a struggle over political power. Gerrymandering is the deliberate manipulation of electoral district boundaries to advantage a political party or another group.
Two common techniques explain how a map can change political outcomes without changing the voters:
- Packing concentrates members of an opposing group into a small number of districts, allowing them to win those districts by large margins but reducing their influence elsewhere.
- Cracking divides members of an opposing group among many districts, preventing them from forming a majority in any of them.
A useful way to visualize the difference is to imagine $40$ voters from Group A and $60$ voters from Group B distributed across four districts. If Group A voters are packed into one district, they may win that district with $100%$ of the vote but lose the other three. If they are cracked into four groups of $10$, Group B can form a majority in every district. The population has not changed; the spatial organization of voting power has.
Political processes distribute resources
Political processes also shape the geography of public investment. Elected officials and governments decide where to place schools, roads, hospitals, transit lines, public housing, military facilities, and environmental protections. These choices can reinforce existing inequalities when well-connected communities receive more resources or when marginalized communities are excluded from decision-making.
The process operates at multiple scales. A national government may distribute funding among regions, a state or province may allocate money among municipalities, and a city council may decide which neighborhoods receive infrastructure improvements. A pattern visible at one scale can look different at another, so Scale Analysis is essential when interpreting political outcomes.
Misconception check: “A map is neutral”
Misconception: Electoral maps merely reflect where people live.
Correction: Maps both reflect and shape political geography. Population distribution constrains the available choices, but boundary-makers decide how populations are grouped. A district map can therefore influence representation, policy priorities, and future political power.
AP skills in action
Topic 4.2 most directly develops Skill 1: Concepts and Processes, especially the analysis of political processes in applied contexts; Skill 2: Spatial Relationships, by connecting district patterns to political outcomes; Skill 3: Data Analysis, when interpreting population counts, election results, maps, or charts; Skill 4: Source Analysis, when evaluating electoral maps and other geographic representations; and Skill 5: Scale Analysis, when comparing local, regional, and national political effects.
On an exam, a strong explanation does more than identify gerrymandering or redistricting. It links a spatial arrangement to a political consequence: dividing a concentrated urban population among multiple districts can reduce its ability to elect a preferred representative because each district contains a larger opposing majority.
Retrieval check
A population group forms $55%$ of a city but wins only one of five electoral districts. What spatial process could explain this pattern, and how might it have affected political representation? A complete answer should identify cracking or another form of boundary manipulation and explain that dispersing the group across districts can prevent it from forming a majority in enough districts to gain proportional representation.
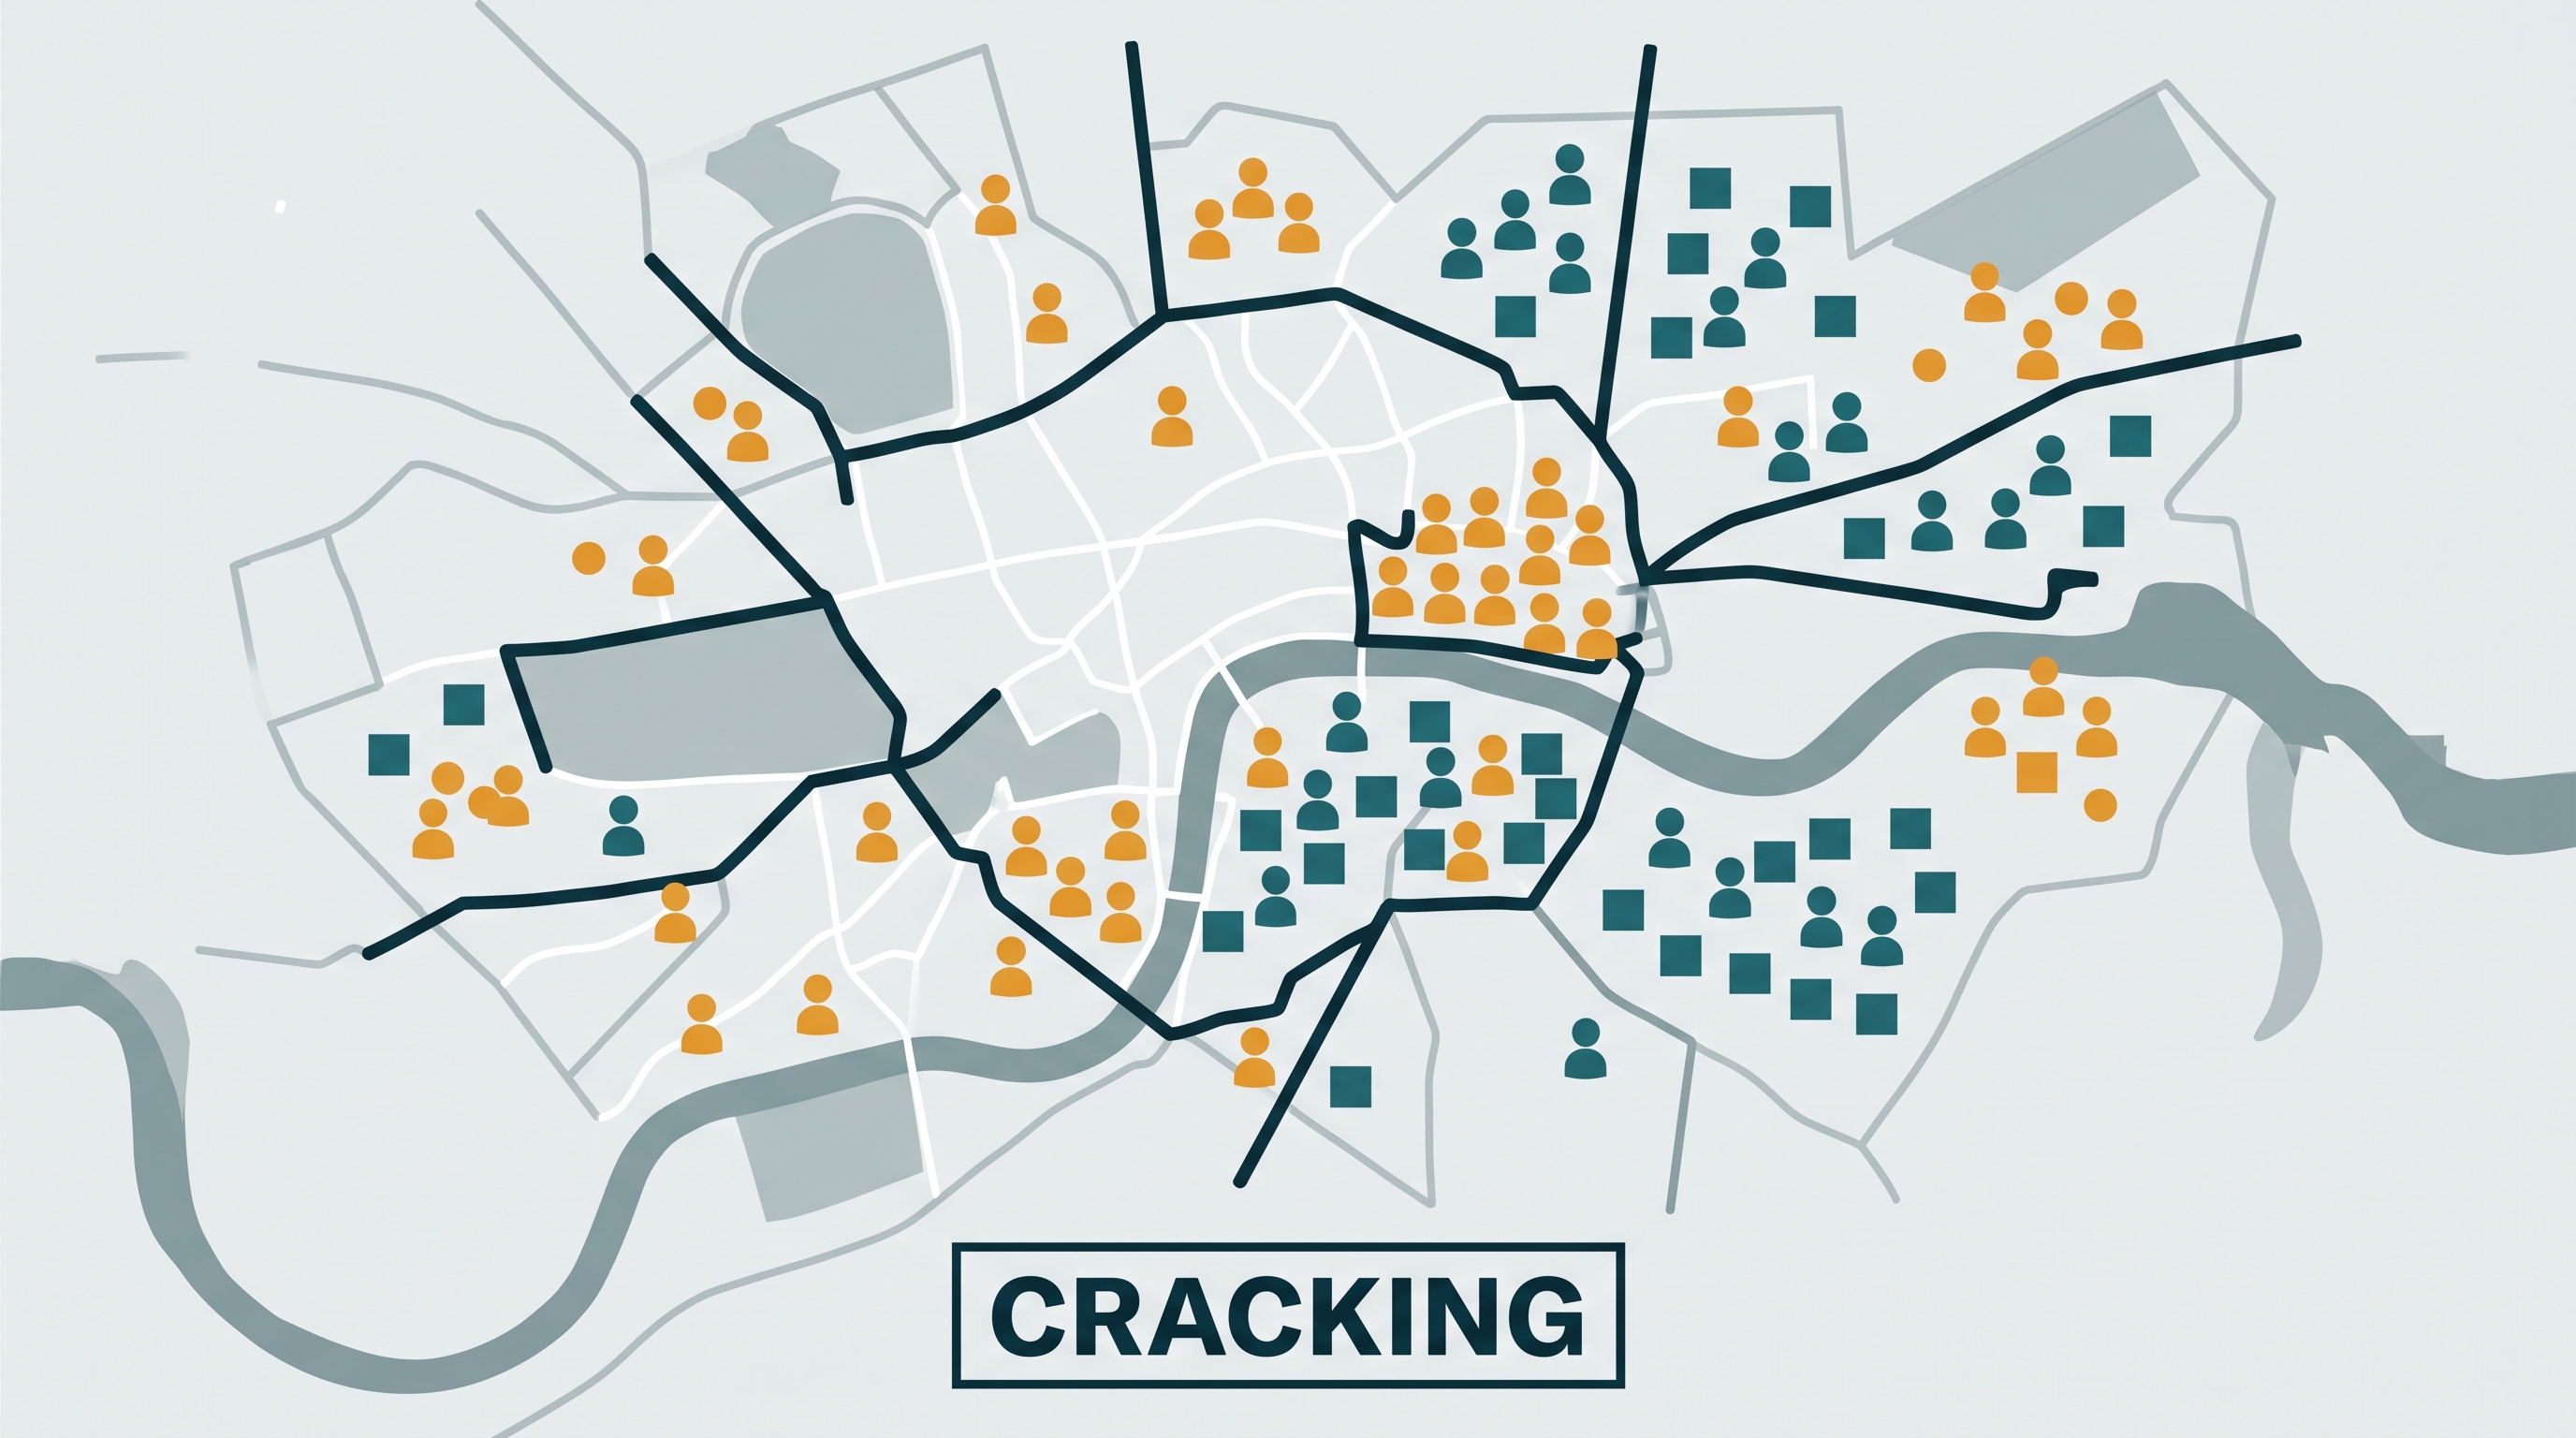
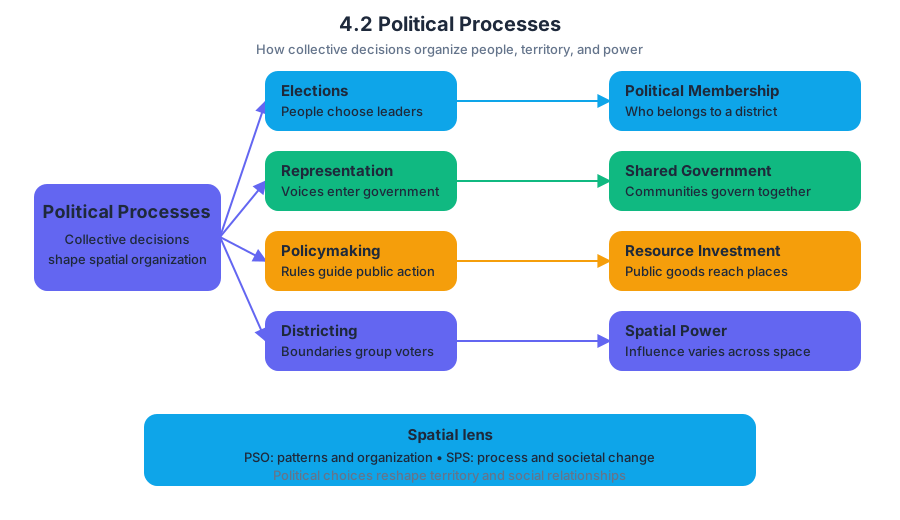
4.3 Political Power and Territoriality
Key concepts: State · Nation · Nation-state · Stateless nation · Sovereignty and independent government · Nations aspiring to become states · Ethnic neighborhoods and spatial patterns · Assimilation and preservation of ethnic traditions · Redistricting and gerrymandering · Federal systems and the spatial distribution of political power
A state is a sovereign political entity with its own independent government. Because it controls territory, makes and enforces laws, and conducts relations with other states, the state is a primary building block of the world political map.
4.3 Political Power and Territoriality
A state is a sovereign political entity with its own independent government. Because it controls territory, makes and enforces laws, and conducts relations with other states, the state is a primary building block of the world political map.
Sovereignty is a state’s authority to govern itself and control its territory without being subordinate to another state.
Territory, power, and political identity
Territoriality is the connection of people, their culture, and their economic systems to the land they occupy. Political power becomes geographic when a government or group uses territory to organize resources, enforce rules, express identity, or claim the right to make decisions there.
The key distinction is between a political entity and a cultural group:
| Term | Meaning | Example |
|---|---|---|
| State | A sovereign political unit with an independent government and territory | Finland |
| Nation | A group of people who share cultural traits, history, beliefs, or a sense of common identity | The Finnish nation |
| Nation-state | A state whose political boundaries closely correspond to one nation | Japan is often used as an approximate example |
| Stateless nation | A nation that does not possess its own sovereign state | The Kurds or Palestinians |
A state therefore describes political authority, while a nation describes shared identity. These categories sometimes overlap, but they are not synonyms. A nation-state is an alignment between the two; a stateless nation experiences the opposite condition, because its shared identity extends across territory without an independent government of its own.
Nations aspiring to become states
Some nations aspire to become independent states because they believe self-government would allow them to protect their culture, control their territory, manage their economy, or make political decisions without an outside government. Scotland’s independence movement illustrates this possibility: many people identify strongly with Scotland as a nation while Scotland remains part of the United Kingdom, a sovereign state.
This aspiration does not automatically produce a new state. Creating a state requires effective government, control of territory, and—often—recognition by other states. The resulting conflict is fundamentally territorial: a nation’s cultural claim to a homeland may challenge the existing state’s sovereignty.
Ethnic neighborhoods: identity made visible
An ethnic neighborhood is an urban area where people who share ethnic traditions live, work, worship, and conduct commerce. In a large metropolitan area such as Los Angeles, these neighborhoods connect residents through shared language, food, religion, festivals, and institutions while creating a distinctive sense of place, meaning the feeling that a location has a recognizable cultural character.
Cultural landscapes preserve identity in visible form. Traditional architecture, religious buildings, restaurants, markets, and signs written in the group’s language can mark a neighborhood as connected to a particular ethnic tradition. At the same time, immigrants may assimilate by adopting the language, customs, or social practices of the dominant culture, sometimes reducing the visibility of their original cultural traits.
Important distinction: Assimilation changes cultural practices; it does not necessarily erase a group’s identity or eliminate ethnic neighborhoods.
Territorial organization and political power
Political power is not distributed only by international borders. In a federal system, authority is shared among central, subnational, and local governments. This arrangement allows different regions or communities to exercise some control over policies affecting their own territory rather than receiving every decision from the national government.
Territorial organization can also affect representation. Redistricting may divide an ethnic community among several voting districts—a process called cracking—making the group a minority in each district and reducing its political influence. The geographic arrangement of territory can therefore strengthen or weaken a nation’s or ethnic community’s ability to convert population into political power.
Reading political power at different scales
A political map must be interpreted at a stated scale of analysis, the level at which a geographic pattern is examined. At the country scale, Finland appears as a sovereign state with its own government; at a finer scale, the analysis might examine Finnish regions, municipalities, or ethnic neighborhoods.
A map may also provide geographic clues about political organization. Washington, D.C., for example, is located along the Potomac and Anacostia Rivers, near their confluence. Recognizing that physical setting helps connect the capital’s political importance to its territorial location without confusing the location of a capital with the extent of a state’s sovereignty.
Misconception check
Misconception: “Every nation is a state.” A nation is defined by shared identity; a state is defined by sovereign political authority. The Kurds can be a nation without possessing a Kurdish sovereign state, while Finland can be both a state and, in many contexts, a nation-state.
Retrieval check
- Which term means a sovereign political entity with an independent government?
- Why might an ethnic neighborhood create a sense of place?
- How can a federal system disperse political power?
- What is the difference between a nation-state and a stateless nation?
Answers: 1. State. 2. Shared traditions become visible through institutions, architecture, religious buildings, businesses, and language. 3. It shares authority among central, subnational, and local governments. 4. A nation-state combines national identity with sovereign statehood; a stateless nation has national identity without its own sovereign state.
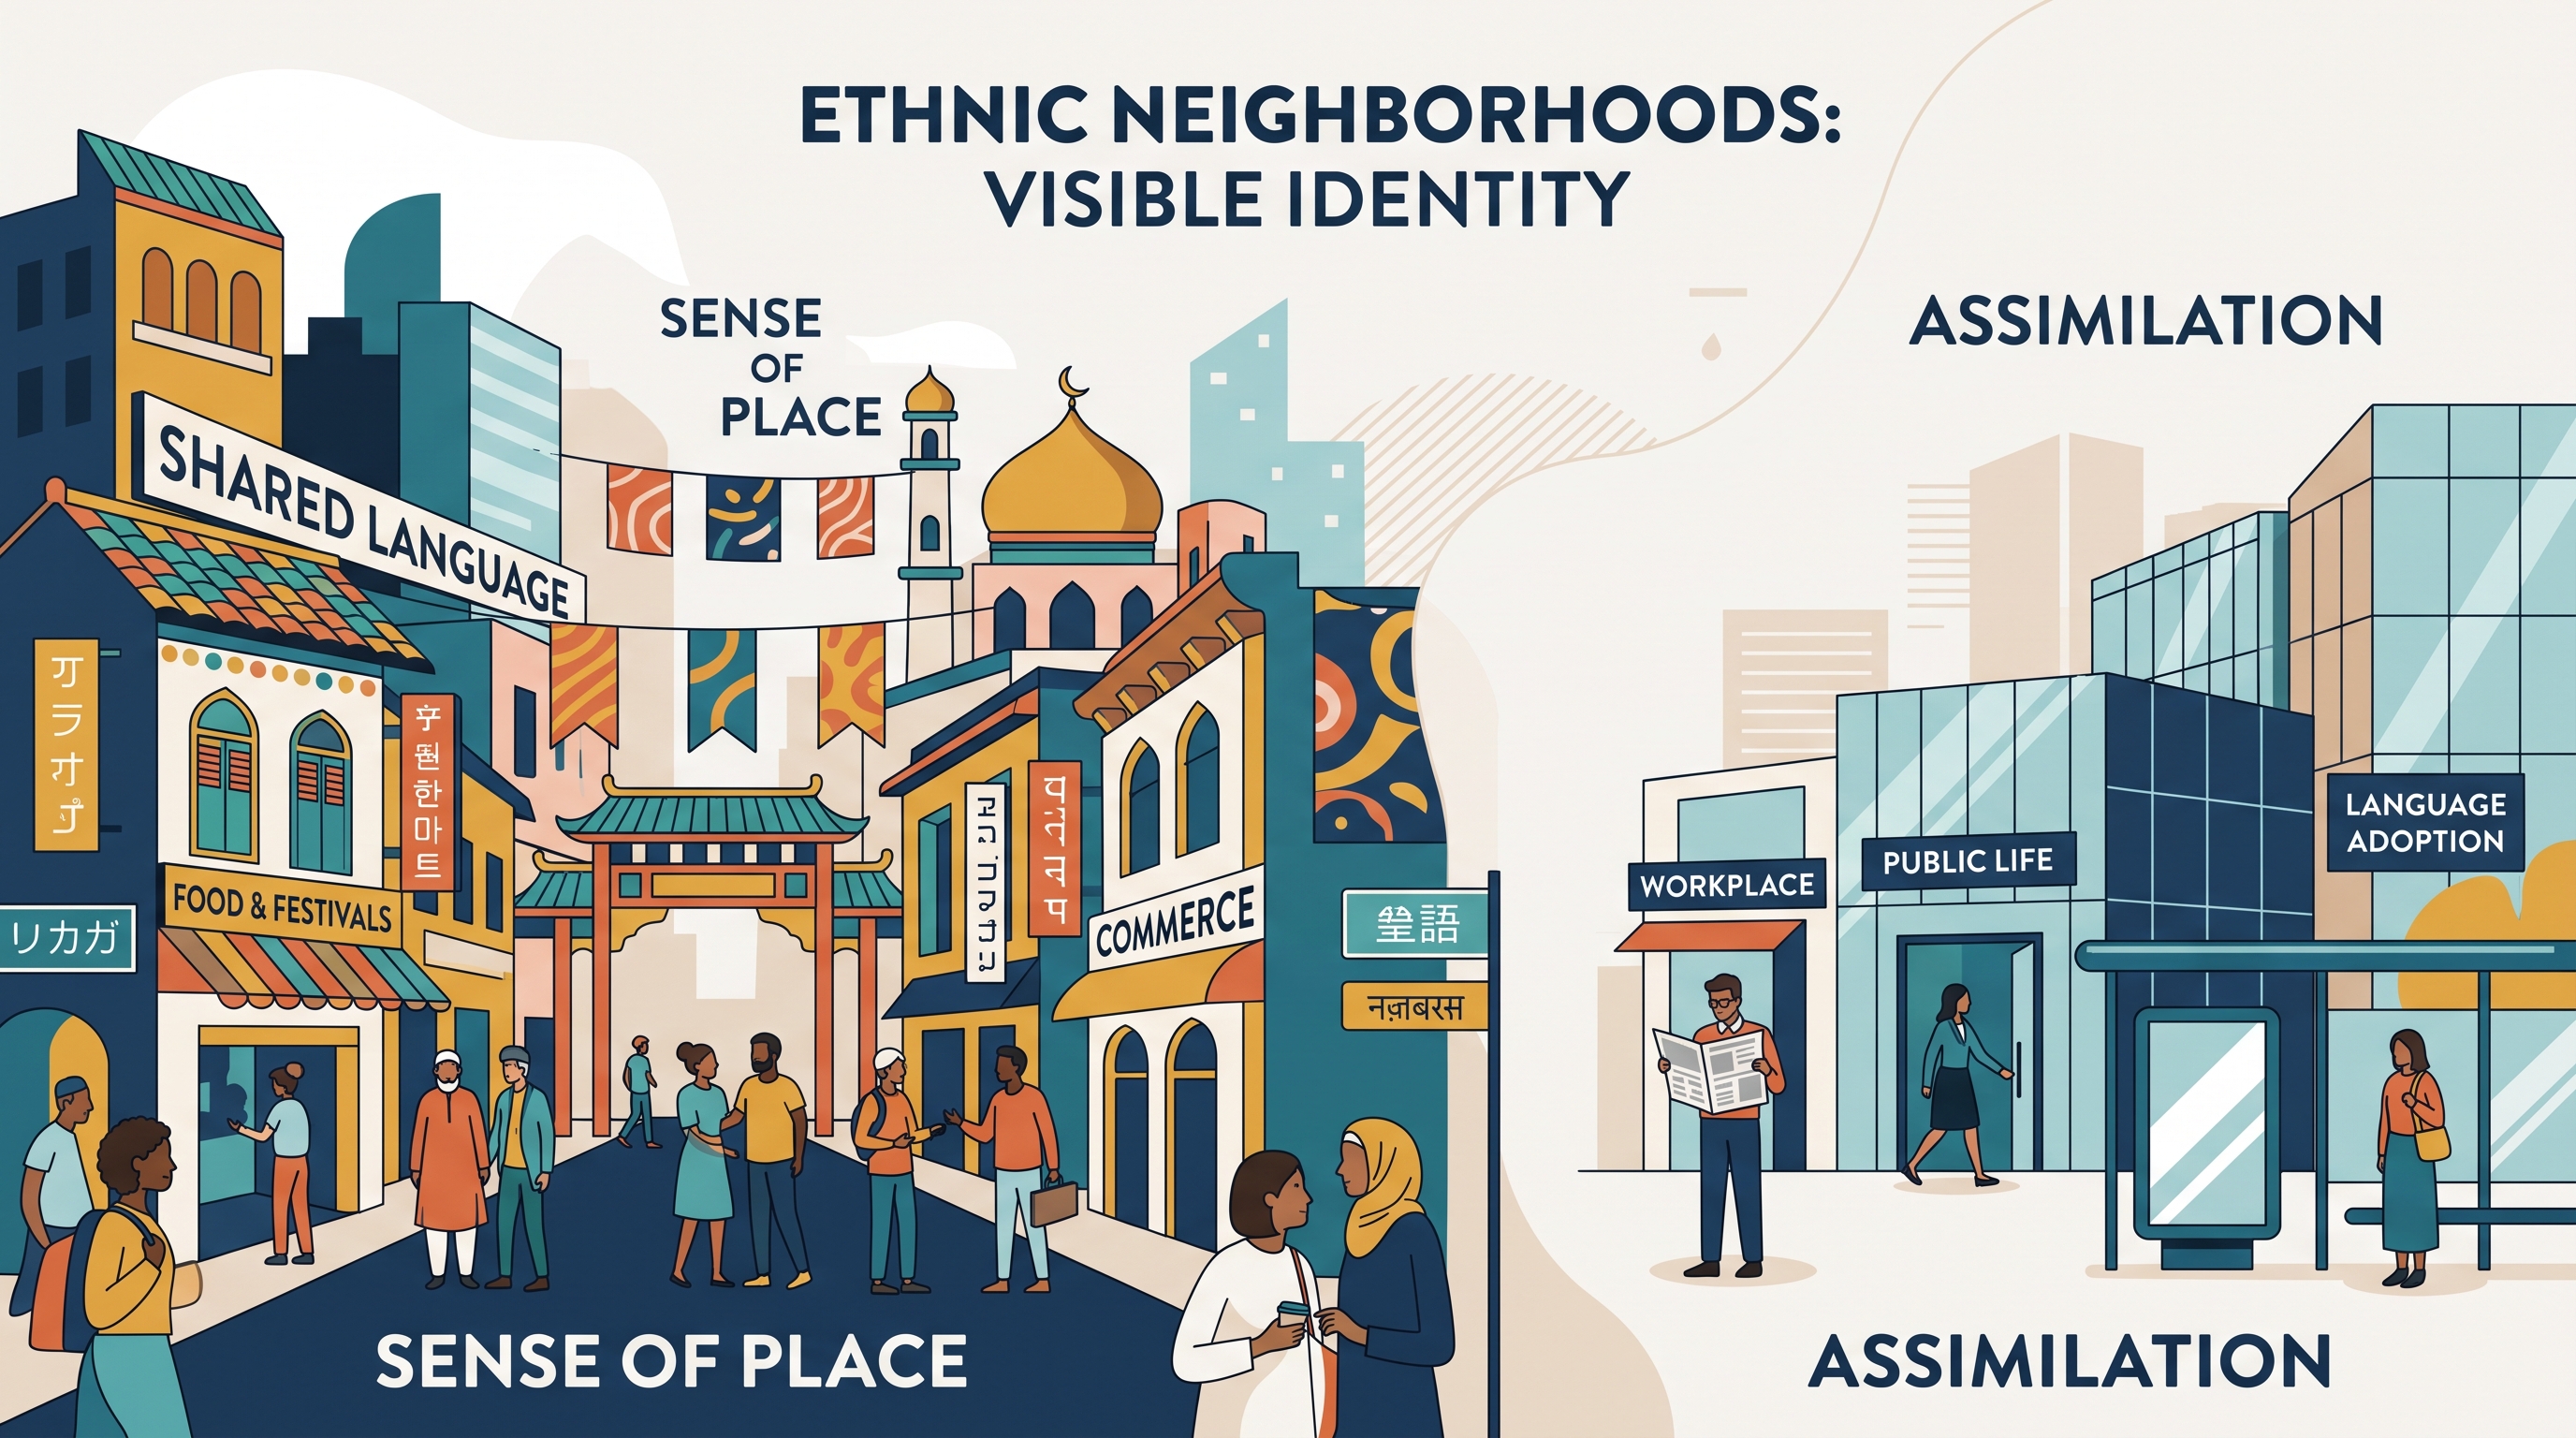
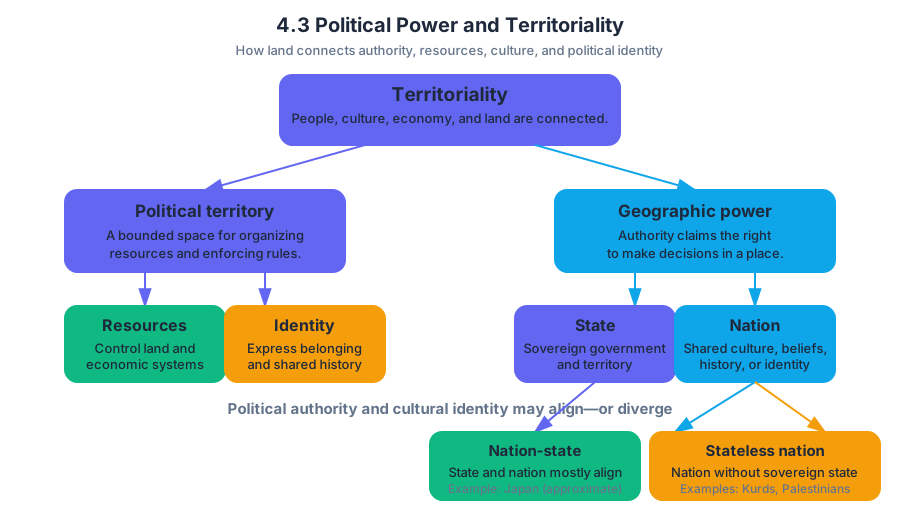
4.4 Defining Political Boundaries
Key concepts: Territoriality · Political geography · Political boundaries · Administrative control · Sovereignty · Internal boundaries · Natural-resource management · Ecosystem protection · International recognition · Foreign policy
Political boundaries are lines or zones that delimit where a government’s administrative authority applies. They turn territorial control into a visible political arrangement: a state, province, district, or other governing unit can claim jurisdiction over a defined area.
4.4 Defining Political Boundaries
Political boundaries are lines or zones that delimit where a government’s administrative authority applies. They turn territorial control into a visible political arrangement: a state, province, district, or other governing unit can claim jurisdiction over a defined area.
From territoriality to boundaries
Territoriality connects people, culture, and economic systems to particular places and can operate at multiple scales. Political boundaries formalize that place-based organization by marking the space in which a political unit claims control.
Territoriality becomes administratively legible through boundaries.
A boundary does not merely describe where one place ends; it establishes a jurisdiction, meaning a recognized area of legal and administrative control. The boundary might be an international border between states or an internal boundary dividing provinces, states, districts, territories, or autonomous regions.
Sovereignty: authority inside and recognition outside
Sovereignty is a state’s authority to govern its territory without outside interference. Internally, sovereignty includes the legal power to create and enforce laws, manage land and resources, establish governmental institutions, and control activity within the state’s borders.
Externally, sovereignty involves recognition by other states and foreign entities. A state’s authority is therefore both practical and international: it governs within its territory, while other states acknowledge its right to do so.
| Dimension of sovereignty | What it means |
|---|---|
| Internal control | The state governs people, land, and resources within its territory. |
| Legal authority | The state creates and enforces laws inside its borders. |
| Border defense | The state may defend its territory against invasion. |
| Border control | The state may regulate immigration and other cross-border movement. |
| Foreign policy | The state may conduct diplomacy, form alliances, and recognize other states. |
| International recognition | Other states and foreign entities acknowledge the state’s authority. |
For example, a sovereign state can defend its border against an invading army, regulate entry by immigrants, establish its own criminal laws, and negotiate treaties with other states. These powers are different expressions of the same underlying principle: the state claims final political authority over its territory.
A precise exam definition
A strong description of sovereignty must connect the concept to the state. An answer earns conceptual precision by explaining that a sovereign state has the right to control what happens inside its borders without interference from outside states or entities, is recognized by the international community, or can defend its borders against invasion.
Exam-ready idea: Sovereignty is the state’s recognized right to exercise internal control over its territory and conduct its external affairs.
Internal boundaries and resource management
Internal boundaries divide a state into subnational units such as provinces, states, districts, territories, special administrative regions, or autonomous zones. Their importance here is administrative: they can make it easier or harder for governments to manage resources and ecosystems that cross political divisions.
Consider a river basin shared by two provinces. If the internal boundary is supported by coordinated rules, each province can contribute data and funding to protect the watershed. If the provinces use conflicting regulations, the same boundary may hinder ecosystem protection because the river’s ecological system does not stop where the administrative line does.
The same issue applies to the distribution of natural resources. A forest, aquifer, mineral deposit, or grazing region may extend across several internal jurisdictions. Boundaries can clarify which government is responsible, but they can also fragment management when each unit pursues separate priorities.
Skills and reasoning processes
This topic most directly develops 1.B Define geographic concepts, processes, models, and theories: define territoriality, political boundaries, and sovereignty precisely rather than using vague words such as “ownership.” It also uses 1.C Explain geographic concepts, processes, models, and theories when connecting sovereignty to internal control, international recognition, and border defense.
A boundary example also engages 2.A Identify spatial patterns and processes, 2.B Explain spatial patterns and processes, and 2.C Explain spatial relationships. The key spatial relationship is that internal administrative lines may align poorly with the physical distribution of ecosystems or resources. 5.A Identify the scales of analysis and 5.B Explain patterns and processes at different scales apply when comparing state sovereignty with provincial or district authority.
Misconception check
Misconception: sovereignty means unlimited power. Sovereignty means a state claims final authority over its territory, but that authority is shaped by international recognition, treaties, political agreements, and the practical ability to enforce decisions. A boundary can mark legal jurisdiction without guaranteeing perfect control on the ground.
Retrieval check
A country’s government creates laws inside its territory, defends its borders, and sends diplomats abroad. Which concept unifies these actions, and why can an internal boundary either help or hinder ecosystem protection?
Answer: The unifying concept is sovereignty, because the state exercises legal authority internally, defends its territory, and conducts foreign policy. An internal boundary can help ecosystem protection by assigning administrative responsibility, but it can hinder protection when separate jurisdictions manage one connected ecosystem inconsistently.
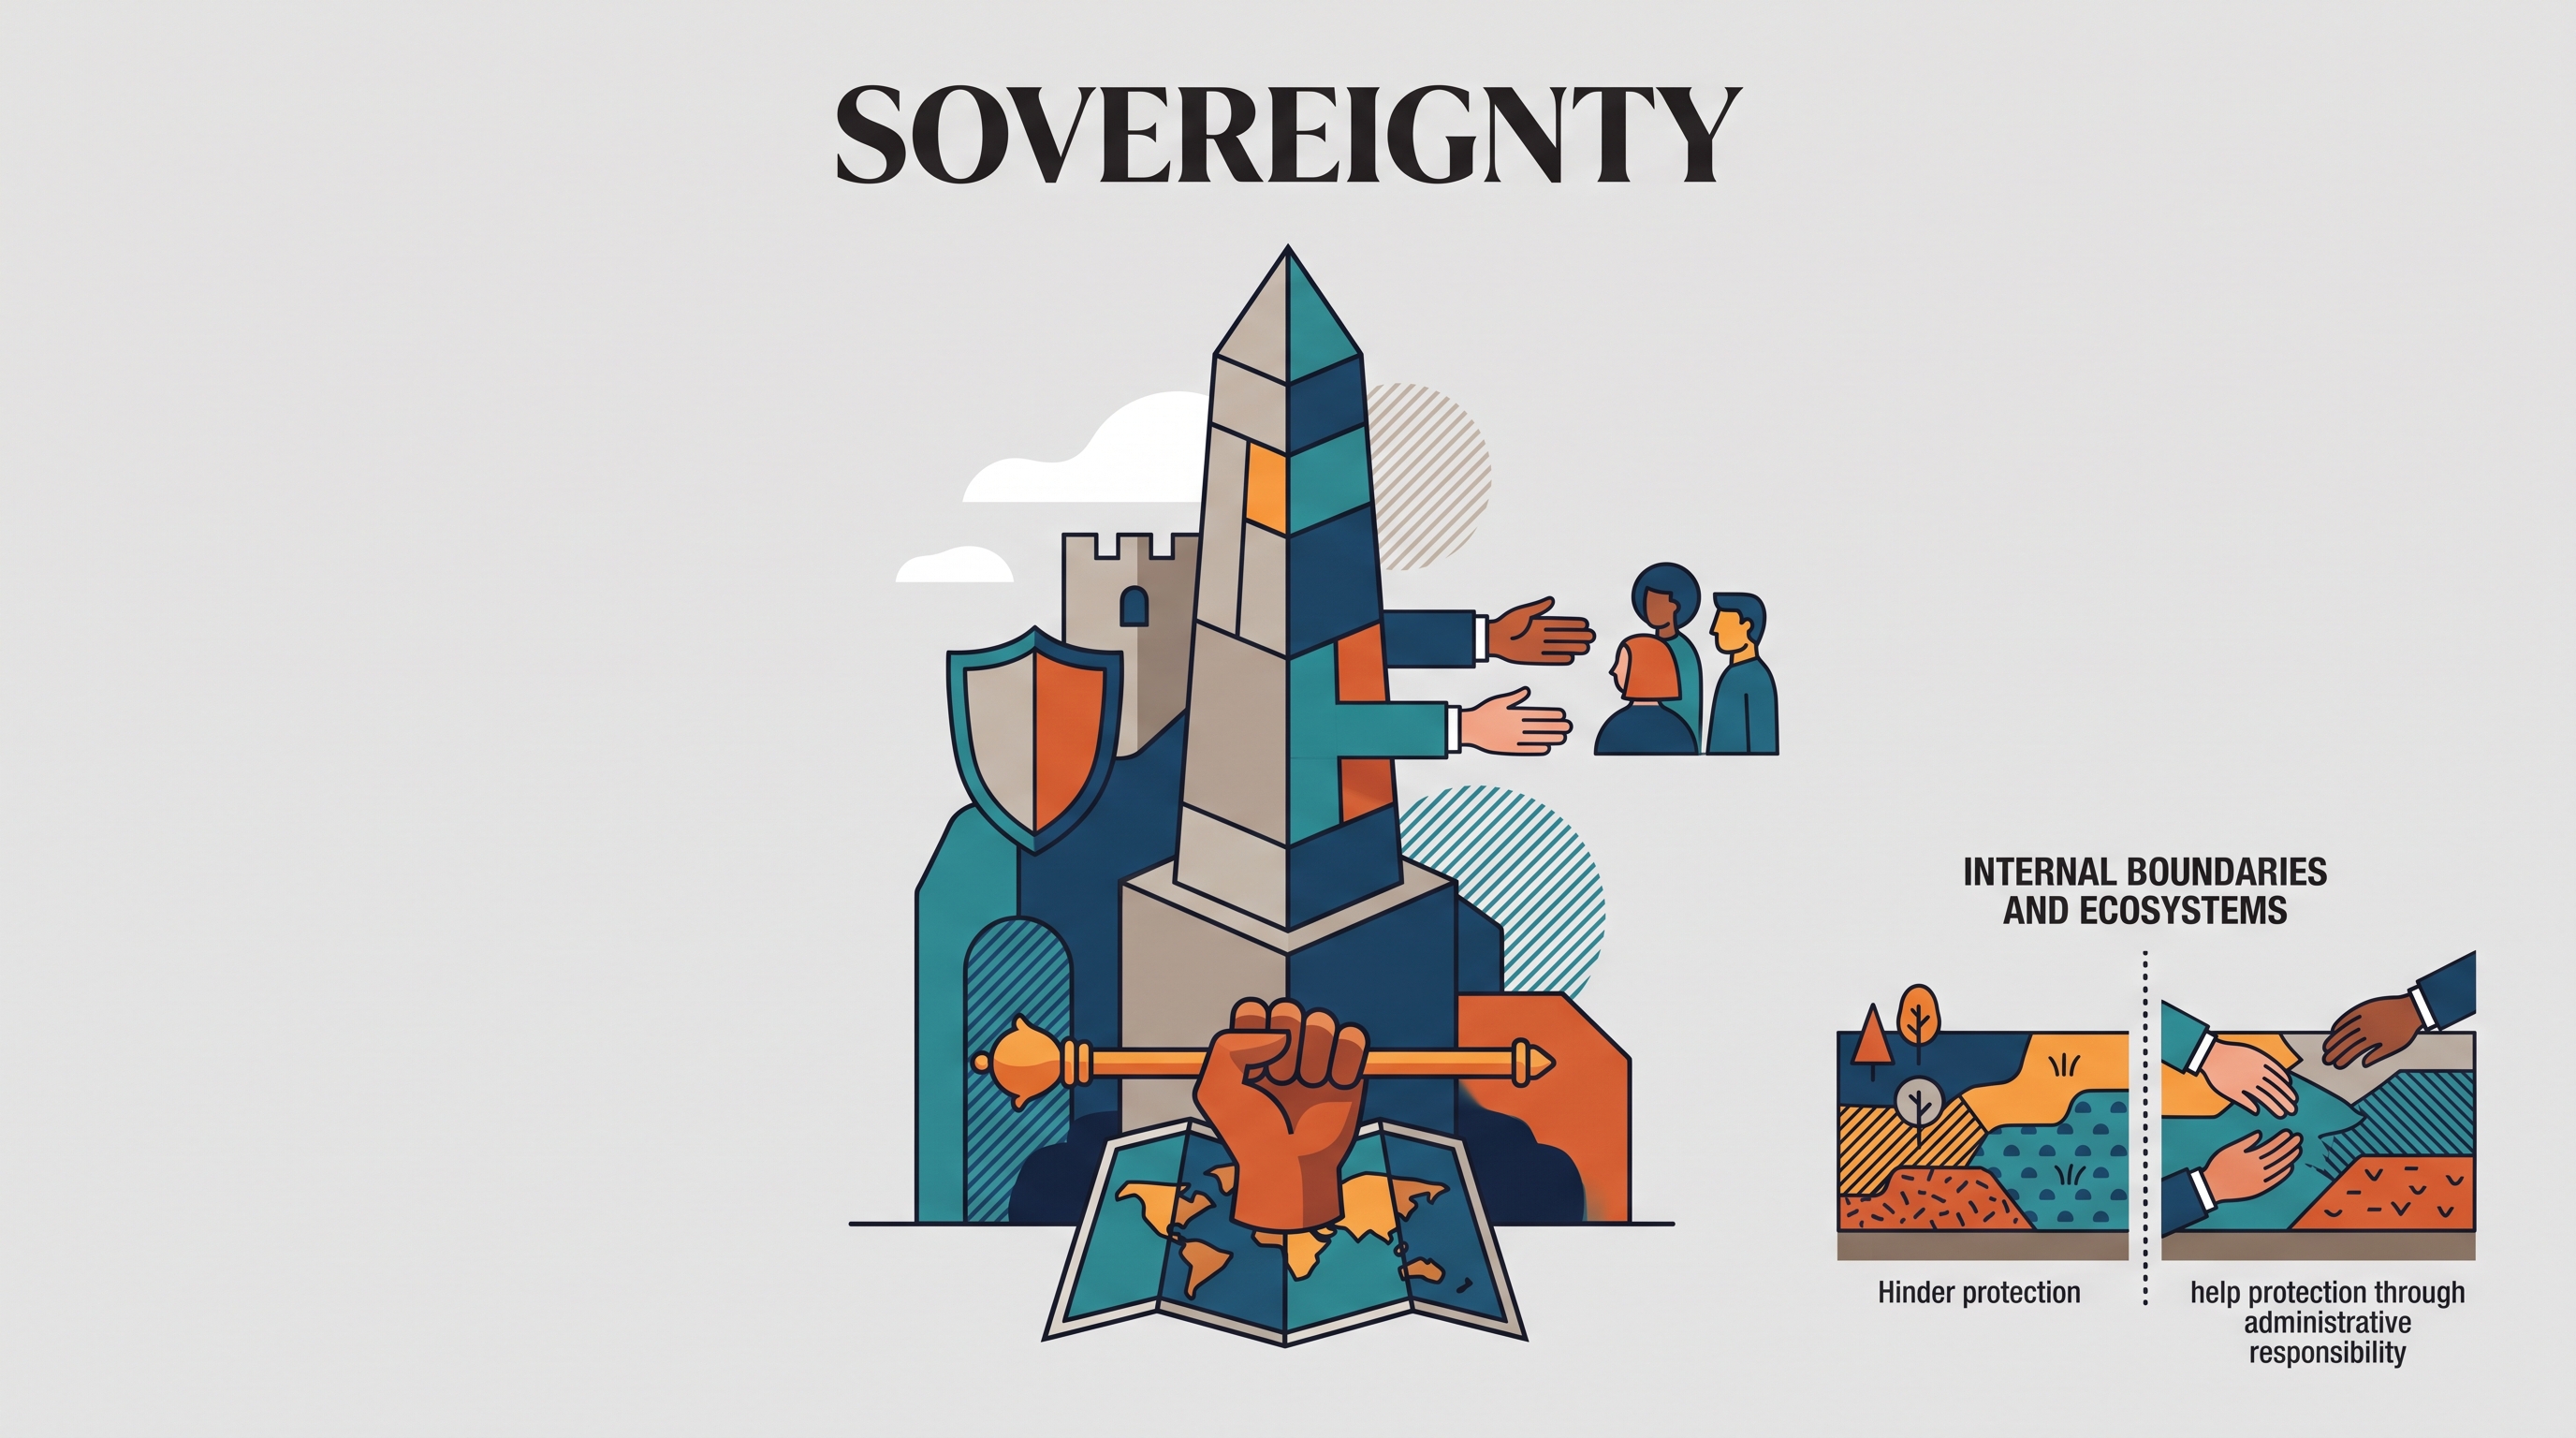
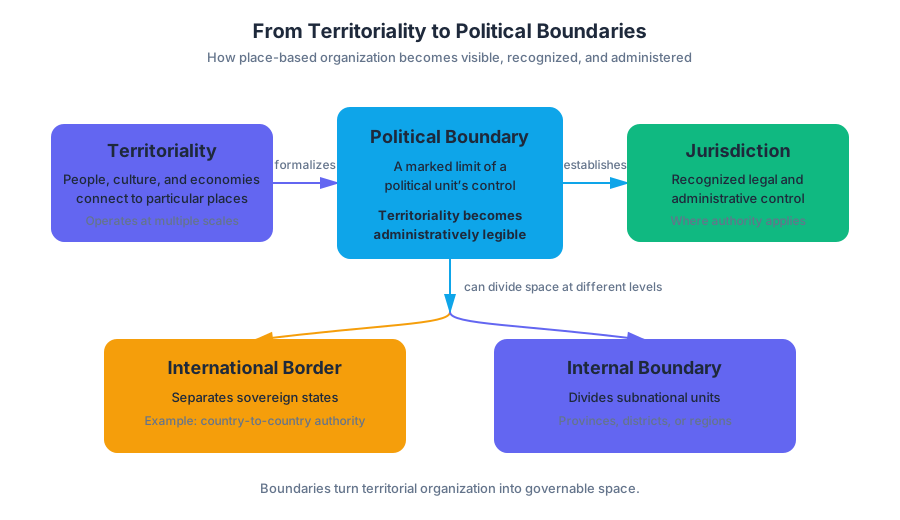
4.5 The Function of Political Boundaries
Key concepts: Political boundaries · Cultural, national, and economic divisions · Demilitarized zones · Berlin Conference · Land and maritime boundaries · International agreements · National and regional identity · International and internal interactions · Territorial seas · Exclusive economic zones
Political boundaries organize who governs a place, who may cross it, which resources a state may use, and how people imagine collective identity. A line on a map can therefore act simultaneously as a legal limit, a cultural symbol, an economic filter, and a source of conflict.
4.5 The Function of Political Boundaries
Political boundaries organize who governs a place, who may cross it, which resources a state may use, and how people imagine collective identity. A line on a map can therefore act simultaneously as a legal limit, a cultural symbol, an economic filter, and a source of conflict.
Enduring Understanding IMP-4: Political boundaries and divisions of governance, between states and within them, reflect balances of power that have been negotiated or imposed.
The central question is not merely where a boundary lies, but what the boundary does. Through administration—such as border enforcement, regulation, and resource management—a boundary turns an abstract territorial claim into an operating system for sovereignty.
Boundaries as divisions—and as connections
Under Learning Objective IMP-4.B, political boundaries may coincide with existing cultural, national, or economic divisions. A boundary separating states with different languages or national histories can reinforce a sense of belonging. A boundary aligned with an economic region may separate different tax systems, labor markets, or trade policies.
Yet boundaries do not always follow the distribution of people or culture. Some are imposed through policy or created through separation arrangements. A demilitarized zone, or area where military forces are restricted or prohibited, can function as a political separation even when the people on either side share language, history, or family ties. The Korean Demilitarized Zone illustrates how a policy-created division can sharply discourage interaction.
The Berlin Conference demonstrates another imposed pattern. European powers negotiated rules for claiming African territory without the participation of the African societies being divided. The resulting colonial boundaries often grouped different peoples within one political territory or separated communities across multiple territories. After independence, many of these boundaries remained, linking political borders to long-term identity debates and separatist movements.
A boundary can also encourage interaction. An international agreement may create a predictable crossing point, reduce tariffs, or clarify which government regulates a road, river, or port. Conversely, strict enforcement, militarization, or conflicting legal systems can discourage trade, migration, family visits, and regional cooperation.
Land and maritime boundaries
Land boundaries influence identity because they distinguish one state’s laws, symbols, citizenship, and political authority from another’s. They also affect practical interactions: a mountain border may limit movement, while a heavily monitored urban crossing may interrupt an otherwise continuous settlement pattern.
Maritime boundaries extend political authority into the sea. Under IMP-4.B.4, the United Nations Convention on the Law of the Sea establishes rights and responsibilities for nations using international waters and defines maritime areas under national jurisdiction, including territorial seas and exclusive economic zones.
| Maritime area | Political function |
|---|---|
| Territorial sea | Establishes a zone of national jurisdiction adjacent to a state’s coast. |
| Exclusive economic zone | Gives a state special rights to explore, use, and manage marine resources in the designated area. |
| International waters | Remain outside the direct jurisdiction of a single coastal state and are governed through international rules and agreements. |
These zones matter because valuable resources—such as fish, offshore energy, and seabed minerals—do not stop neatly at visible lines. Two states may therefore dispute where a maritime boundary should be placed or which state has the right to exploit a resource. An international agreement can settle, modify, or temporarily manage such a dispute, but agreement itself reflects bargaining power and competing interests.
Worked example: when a boundary changes behavior
Imagine two coastal states facing a declining fish population near their shared maritime boundary. Before an agreement, both fleets fish aggressively because each government fears that restraint will allow the other state to capture the resource. The boundary therefore discourages cooperation and encourages competition.
If the states negotiate an agreement that identifies each country’s maritime jurisdiction, sets seasonal limits, and creates a shared monitoring system, the same boundary begins to encourage interaction. At the international scale, it clarifies state rights; at the regional scale, it changes fishing patterns and port activity; at the local scale, it affects fishermen’s incomes and food supplies. This is 5.D Scale Analysis: explaining how the effects of a geographic concept vary across scales.
Identity, sovereignty, and challenges
Under IMP-4.B.3, land and maritime boundaries and international agreements can influence national or regional identity. A government may use a boundary to promote unity by emphasizing a shared territory, while residents near a border may develop a regional identity based on cross-border language, trade, or family networks.
Boundaries can also be challenged from within. Separatist movements seek greater autonomy or a separate state for a particular region or group. Independence movements go further by seeking sovereign statehood. If such movements succeed—or if governments respond by granting autonomy, redrawing internal divisions, or recognizing a new state—established political boundaries may change and state sovereignty may be weakened or reorganized.
Named misconception: A boundary does not automatically create cultural unity on one side or cultural difference on the other. It may reflect an existing division, but it may also be imposed, contested, and crossed every day.
Retrieval check: A maritime agreement creates an exclusive economic zone, reduces naval tension, and assigns fishing rights. Identify one effect at the international scale and one effect at the local scale. Then explain whether the boundary is encouraging or discouraging interaction, and why.
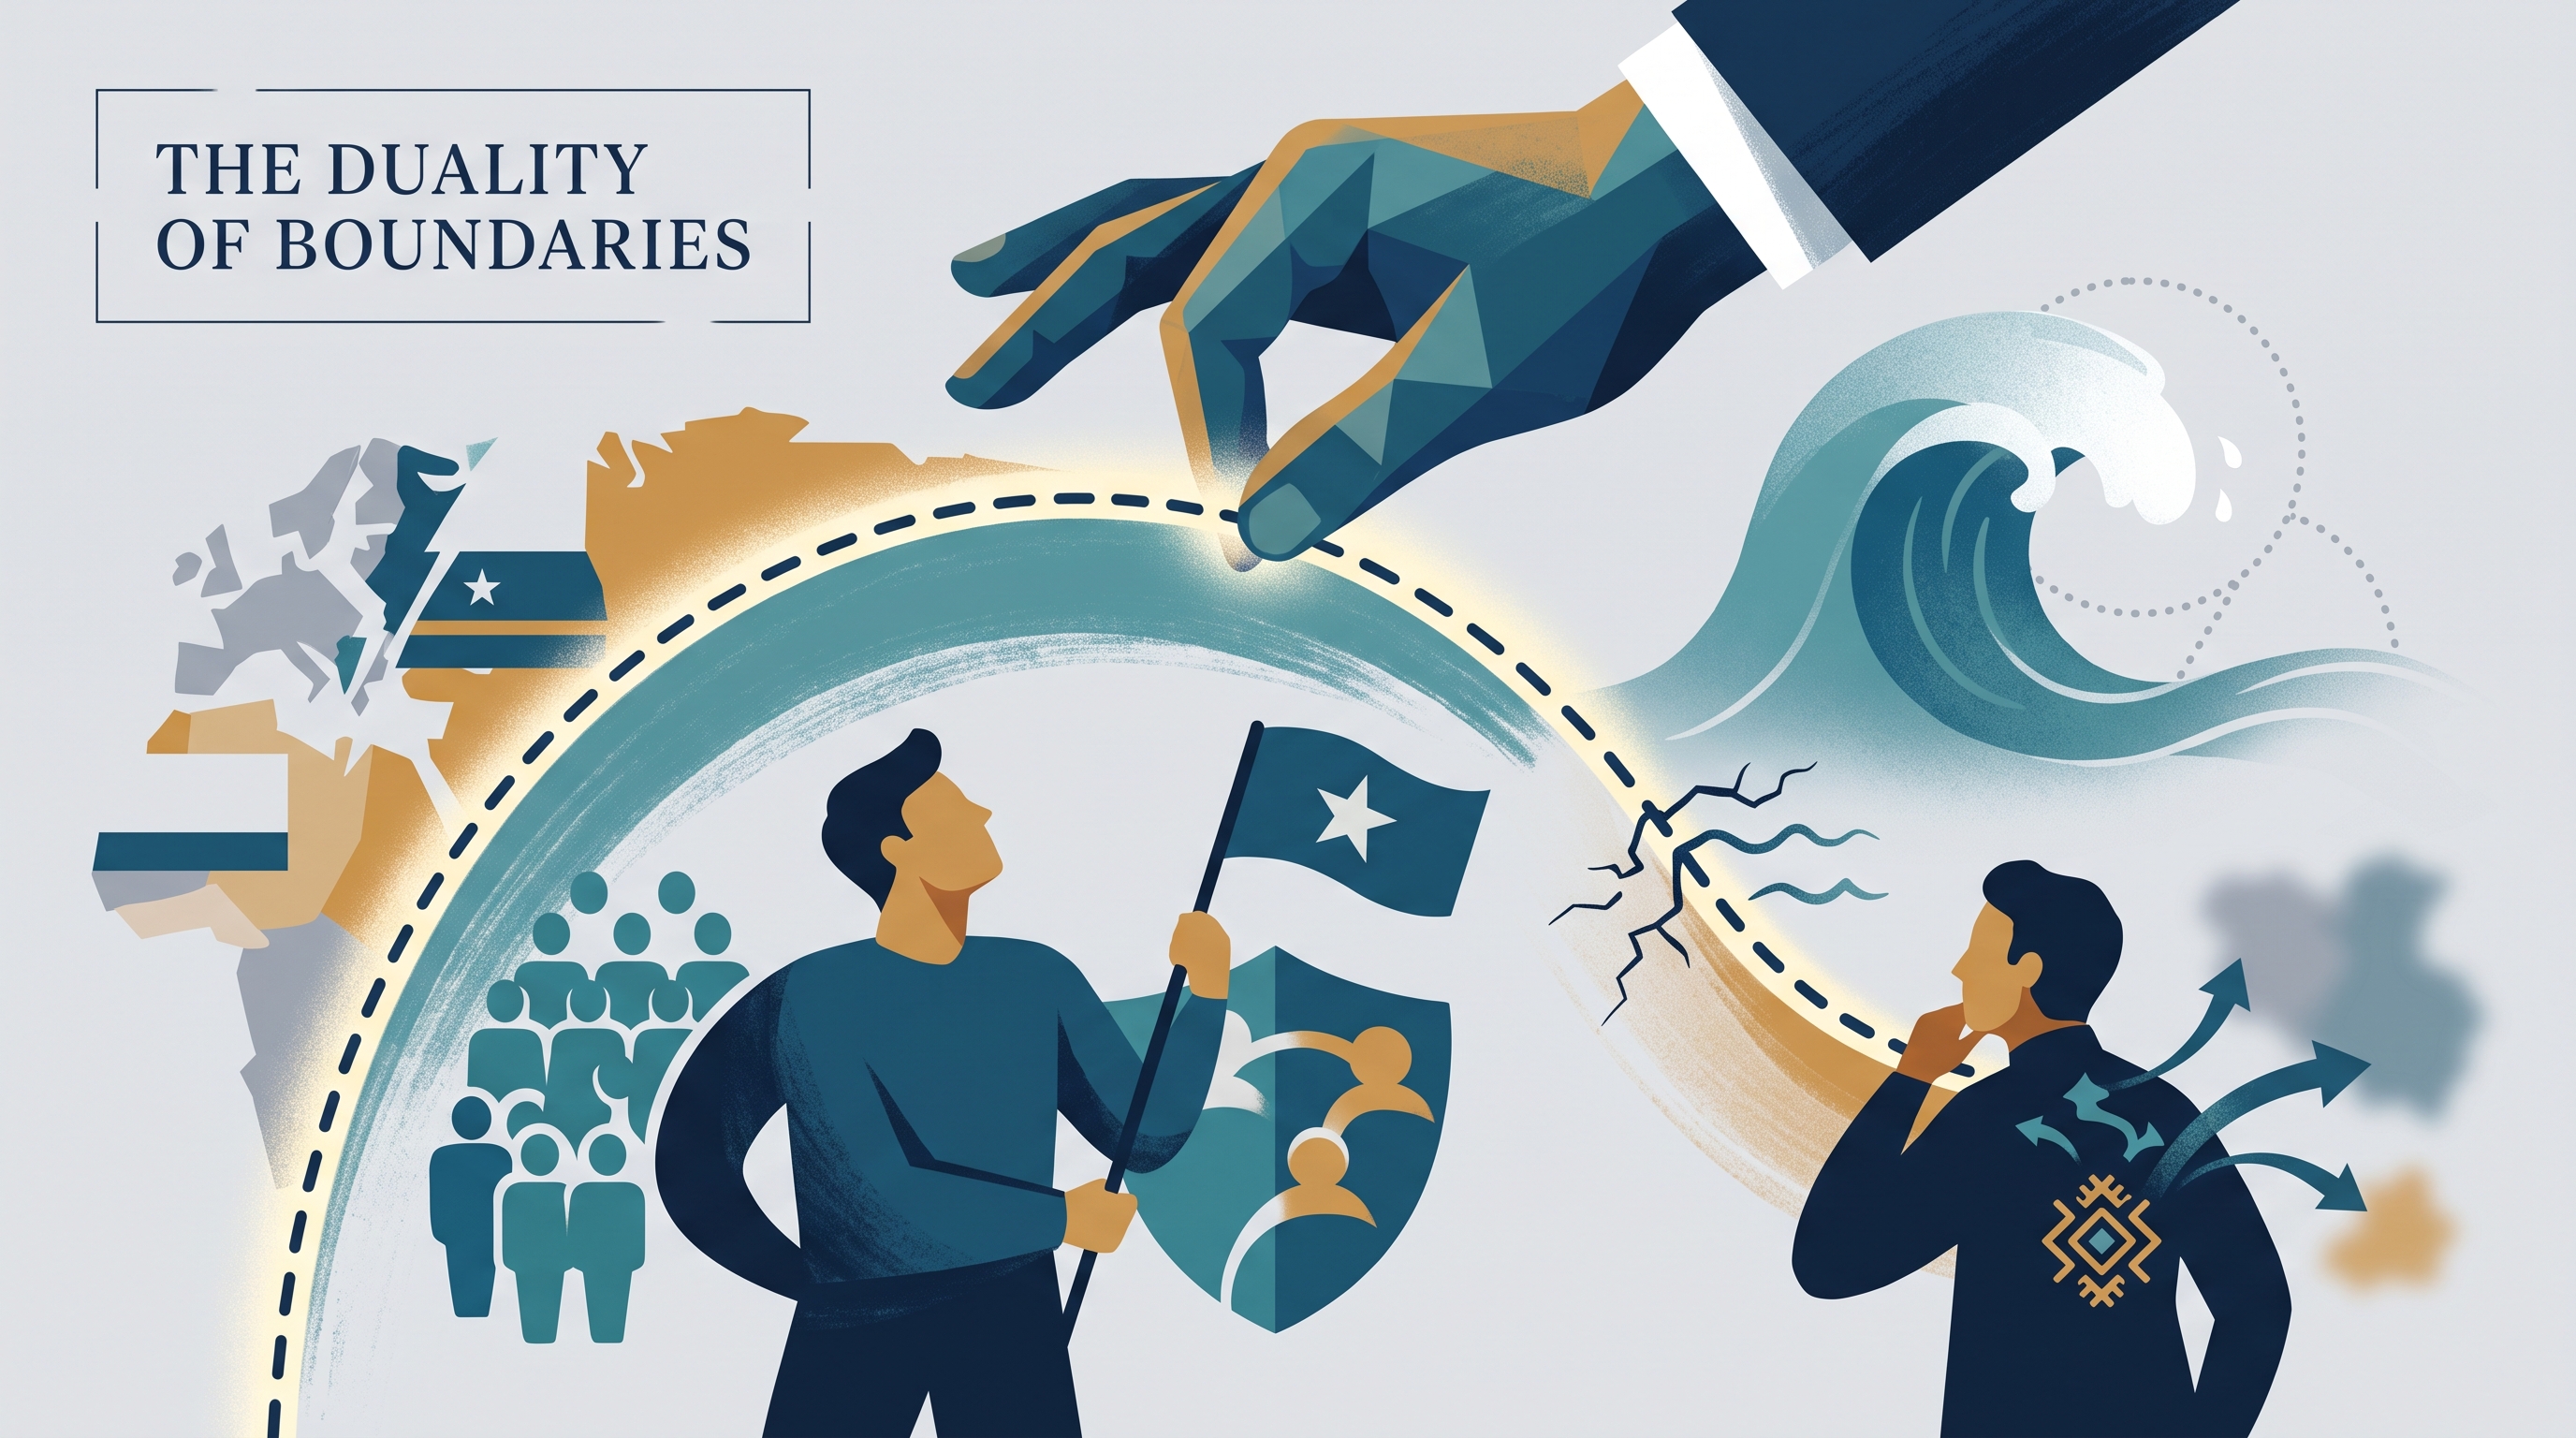
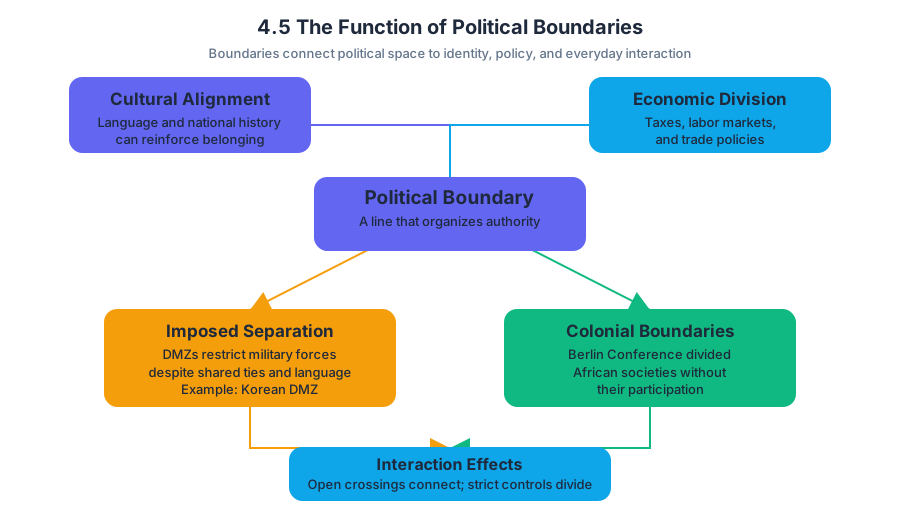
4.6 Internal Boundaries
Key concepts: Internal boundaries · Sovereignty · Government control · Subnational regions · Limits between subnational regions · Different types of subnational regions
Internal boundaries divide territory within a sovereign state, determining which subnational government controls a particular place. A single landscape may therefore be governed simultaneously by a national government, a province, a voting district, a school district, and a water district—each with its own boundary…
4.6 Internal Boundaries
Internal boundaries divide territory within a sovereign state, determining which subnational government controls a particular place. A single landscape may therefore be governed simultaneously by a national government, a province, a voting district, a school district, and a water district—each with its own boundary and responsibility.
Essential definition: Internal boundaries define the limits of sovereignty or government control between one subnational region and another.
From one sovereign state to many subnational regions
Sovereignty is a government’s authority to control territory and make decisions within it. Internal boundaries do not usually separate independent countries; instead, they divide the territory of one country into smaller administrative or political units.
A national government may establish states, provinces, territories, special administrative regions, autonomous zones, or voting districts. Local boundaries can also organize public services through school districts, water districts, and other infrastructure zones. The same location can belong to several of these systems at once because each boundary answers a different administrative question.
The key distinction is between the overall sovereignty of the state and the limited authority assigned to subnational regions. A province may control education or transportation, while the national government retains authority over national defense and foreign affairs. Internal boundaries identify where one subnational government’s authority ends and another’s begins.
CED traceability: Topic 4.6 Internal Boundaries; Learning Objective 4.6; Essential Knowledge 4.6.A and 4.6.B. The topic’s central reasoning is that internal boundaries can delimit or unify different types of subnational regions.
Boundaries can separate—and organize—different regions
Internal boundaries may separate distinct types of subnational regions. For example, a national territory might contain provinces, autonomous zones, and special administrative regions whose legal powers differ. A boundary marks the transition from one set of governing rules or administrative responsibilities to another.
They can also unify different types of subnational regions within one national political system. A province, a voting district, and a school district may have different purposes, but their boundaries collectively organize the same population and territory under the authority of one state.
Internal boundaries can also unify or separate ethnic, cultural, or national groups. A boundary might place a culturally similar population within one administrative unit, helping preserve an identity, or it might divide that population among several units. Consequently, boundaries may reduce conflict by recognizing differences—or intensify conflict when groups view the divisions as unfair.
Worked example: assigning authority in a growing region
Imagine a country creates a new coastal province. The national government assigns the province responsibility for regional roads and hospitals. Within the province, officials draw voting districts and school districts; a separate water district crosses several school-district boundaries because the same reservoir supplies multiple communities.
The reasoning is:
- The national–provincial boundary establishes the province’s area of government control.
- Voting-district boundaries organize political representation.
- School-district boundaries organize education services.
- The water-district boundary coordinates shared infrastructure across other boundaries.
- The boundaries may unify residents for administration while separating them for elections, schooling, or resource management.
This example shows why internal boundaries are not simply lines on a map. They allocate authority, divide responsibility, shape representation, and influence how governments collect and analyze data. A statistic reported by province may conceal important differences between school districts or ethnic communities inside that province.
Skill focus: scale and spatial relationships
Topic 4.6 is especially suited to Skill Category 2: Spatial Relationships, including 2.A Describe spatial patterns and 2.B Explain spatial relationships. On an exam, identify which regions touch, overlap, or are nested inside one another, then explain how that arrangement affects governance or public services.
It also develops Skill Category 5: Scale Analysis, especially 5.A Identify scales of analysis and 5.B Explain scales of analysis. A national map may show one province as a single unit, while a local map reveals several school, voting, or water districts within it. The pattern—and the explanation—can change with scale.
Misconception check
Misconception: every boundary represents a separate sovereign country. Correction: an internal boundary usually lies within a sovereign state and separates subnational regions. A state or province may possess meaningful governmental authority without being an independent state.
Retrieval check: A boundary separates a province from an autonomous zone inside the same country. Is it an international boundary or an internal boundary? What does it identify? Answer: It is an internal boundary; it identifies the limits between two subnational regions with potentially different governmental powers.
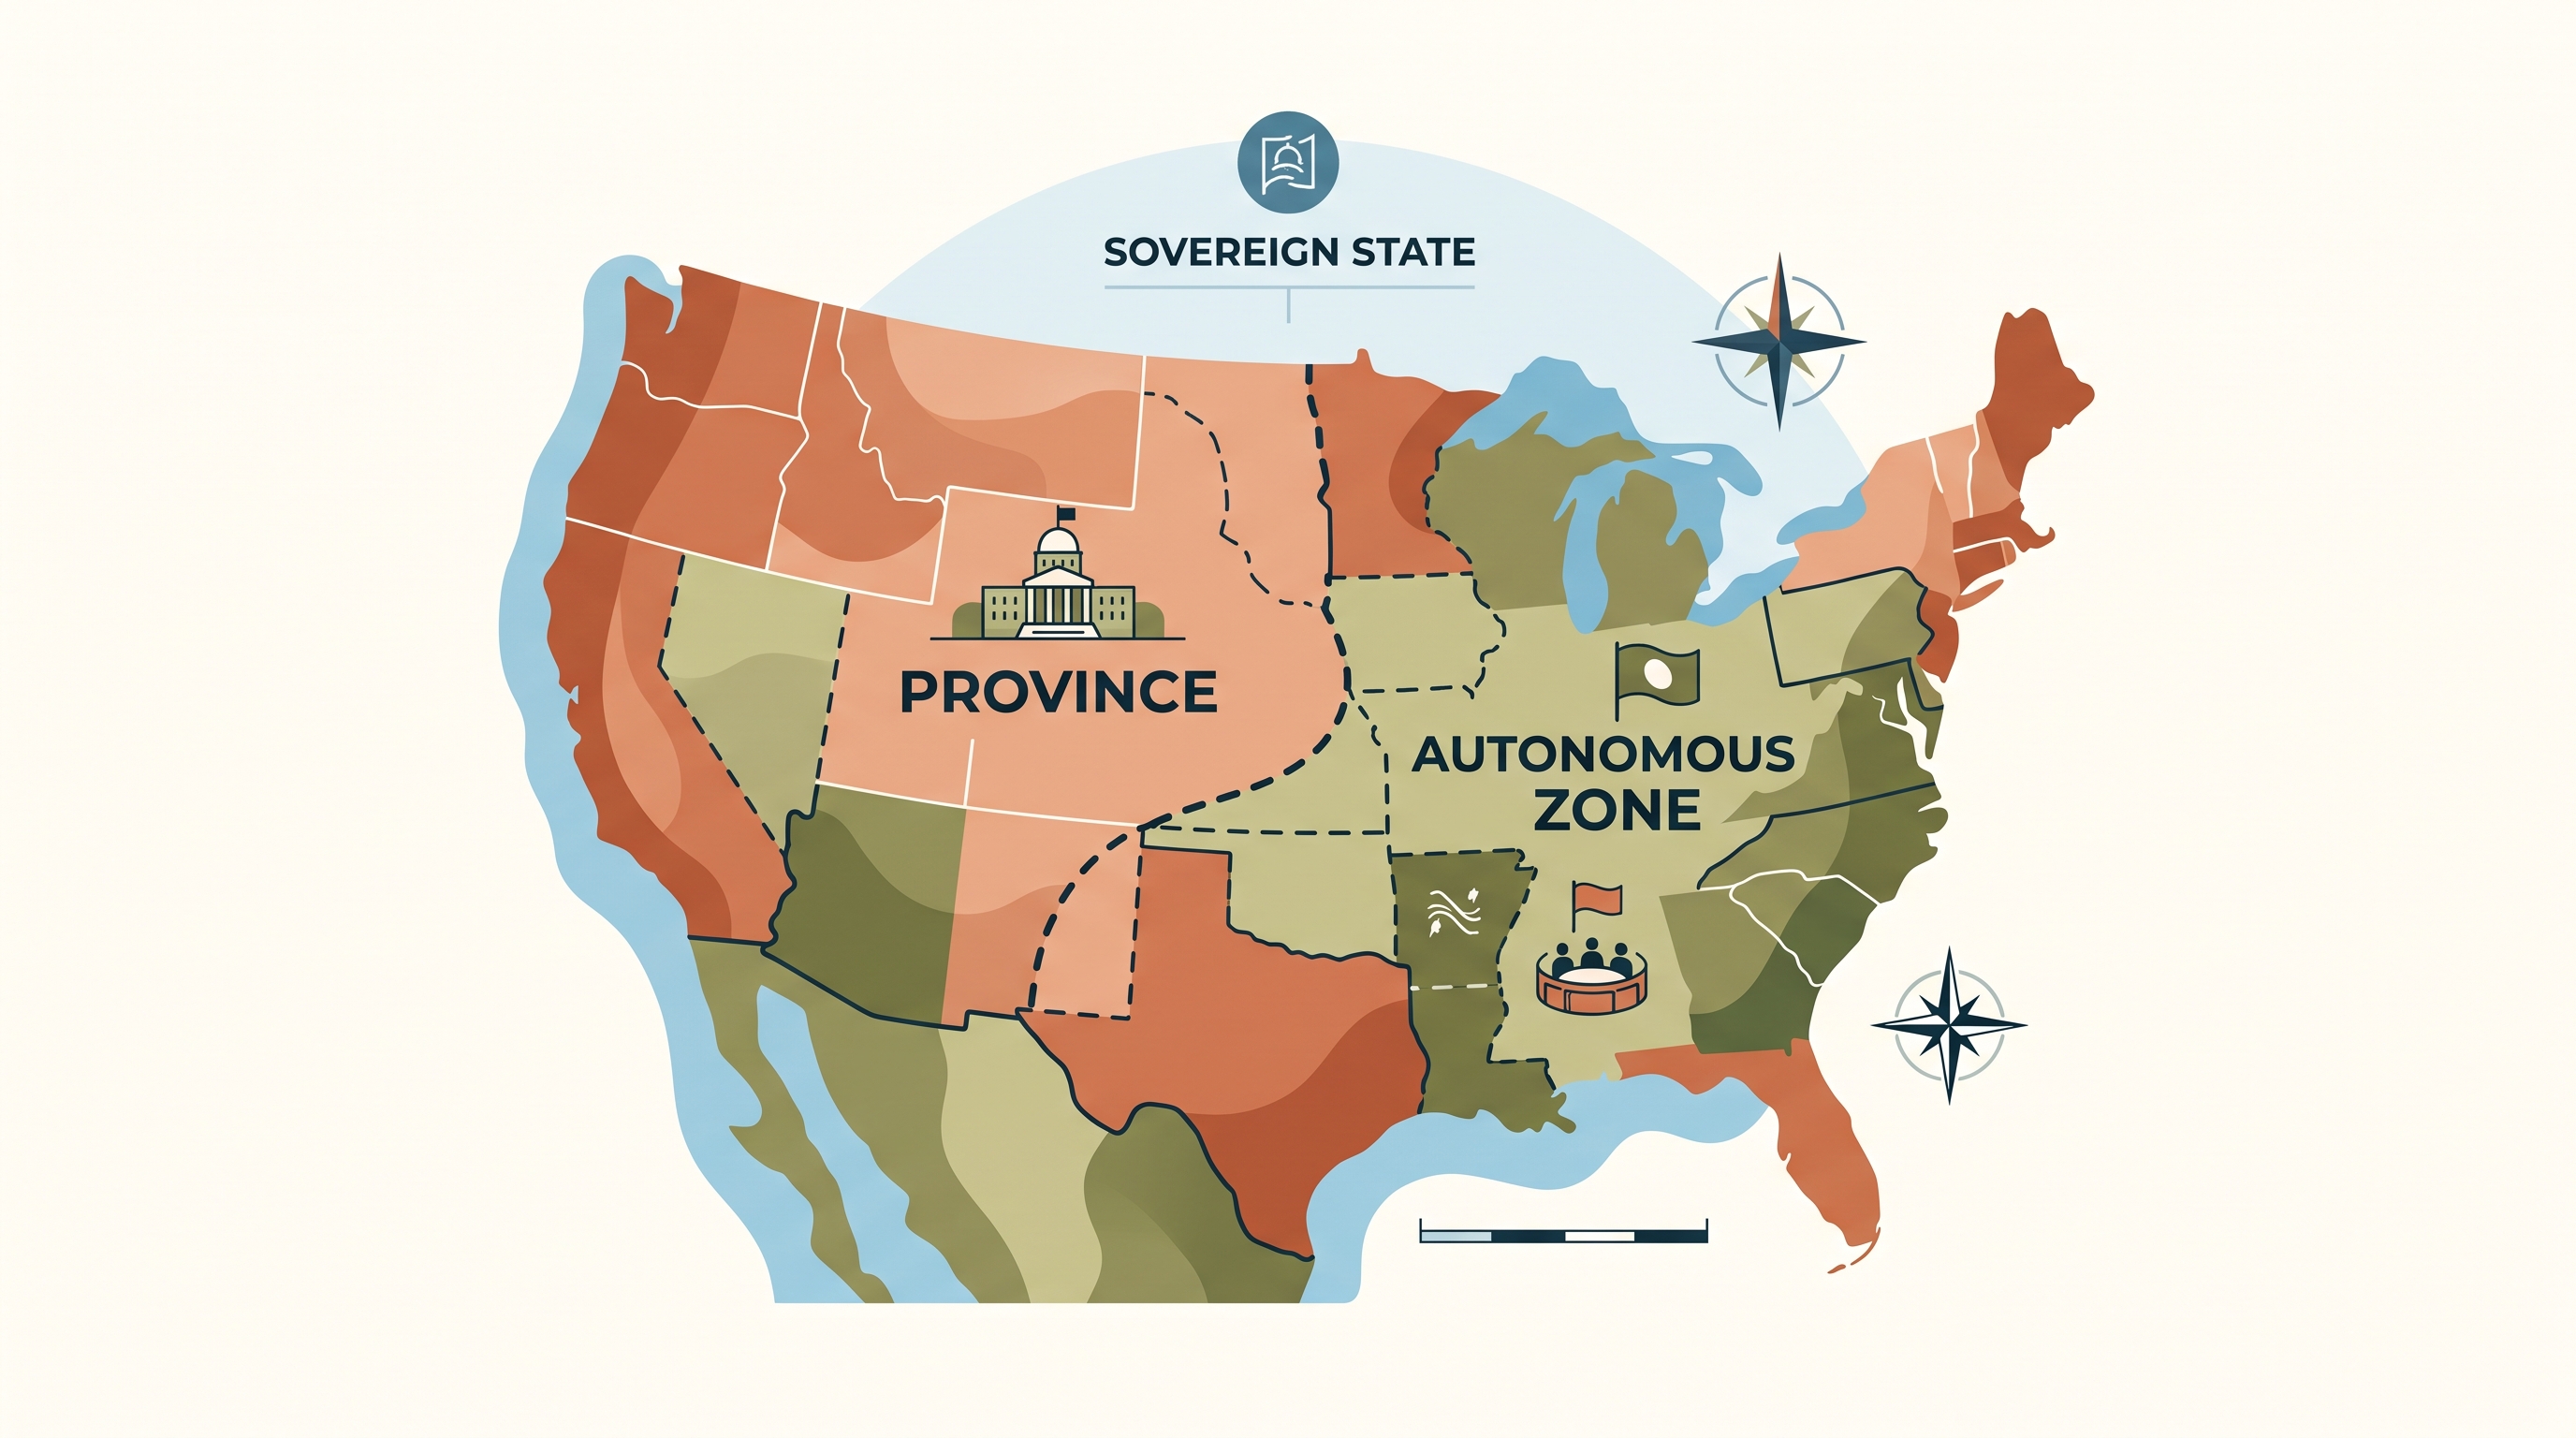
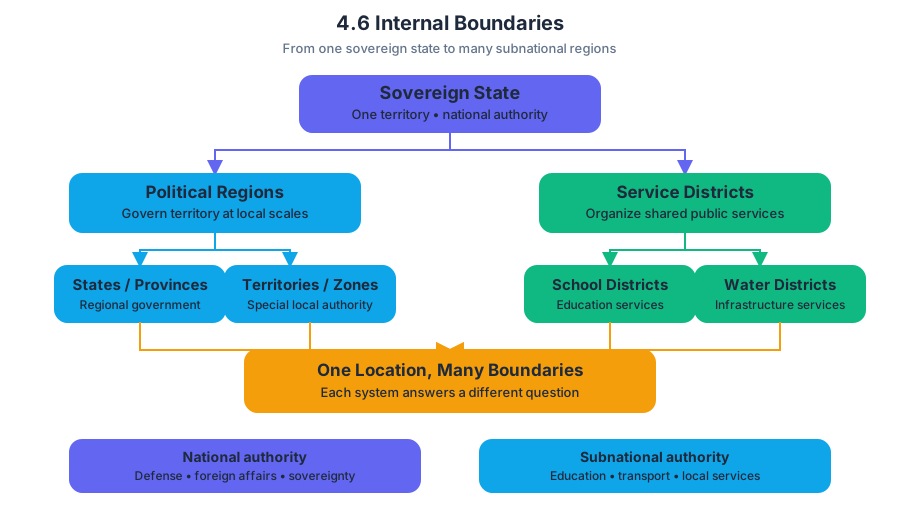
4.7 Forms of Governance
Key concepts: Sovereignty · State self-rule · Noninterference by outside states and entities · International recognition of states · Requirements for defining sovereignty
Sovereignty is more than a government’s ability to make rules: it is a state’s authority to govern its territory and population without outside interference and with recognition from the international community.
4.7 Forms of Governance
Sovereignty is more than a government’s ability to make rules: it is a state’s authority to govern its territory and population without outside interference and with recognition from the international community.
Imagine a locked house. The residents decide what happens inside, outsiders cannot enter and rearrange the furniture without permission, and neighboring households recognize that the house belongs to those residents. A state’s sovereignty works similarly: self-rule, control within borders, noninterference, and international recognition must operate together.
Sovereignty: A state’s right and ability to rule itself, control what occurs inside its borders, remain free from interference by outside states and entities, and receive recognition as a state within the international community.
The four requirements of sovereignty
A state’s sovereignty is incomplete if any one of its central elements is missing or ignored.
| Requirement | Meaning | Diagnostic question |
|---|---|---|
| State self-rule | The state has an autonomous government that makes and enforces its own laws. | Who has the final authority to govern? |
| Territorial control | The state controls what happens inside its borders. | Can the government exercise authority throughout its territory? |
| Noninterference | Outside states and entities do not control the state’s internal decisions. | Is another power directing the government’s actions? |
| International recognition | Other states acknowledge the political entity as a state. | Is it treated as a state in international relations? |
The first two requirements describe sovereignty from the inside. A sovereign state governs itself and exercises authority over its territory. The latter two describe sovereignty in relation to the outside world: the state must be free from external control and recognized by the international community.
Why “self-rule” alone is not enough
A common misconception is that sovereignty simply means “the right to rule yourself.” That definition is incomplete. A response that mentions self-rule but omits freedom from outside interference or international recognition may fail to demonstrate the full geographic concept of sovereignty.
Exam-precision rule: Do not define sovereignty with only one phrase. Connect self-rule to control inside borders, freedom from outside interference, and international recognition.
For example, an autonomous government may make local laws, but if a foreign state controls its defense, economy, or political decisions, its sovereignty is limited. Likewise, a territory may claim independence but lack broad international recognition, making its status as a sovereign state contested.
Unitary and federal governance
Forms of governance also describe how authority is organized across a state’s territory. The key comparison is between unitary states, in which authority is concentrated in a central government, and federal states, in which constitutional arrangements divide authority between national and regional governments.
| Form of governance | Territorial organization of power | Typical relationship between levels of government |
|---|---|---|
| Unitary state | Political power is concentrated at the national level. | Regional or local governments exercise powers delegated by the central government. |
| Federal state | Political power is divided between national and regional governments. | Regional governments possess constitutionally protected powers that the national government cannot simply remove. |
Calling a unitary state “top-down” is only half of a comparison. A complete explanation must also state that a federal state distributes authority between national and regional levels. This distinction concerns the territorial organization of government, not whether a state is sovereign: both unitary and federal states can be sovereign.
Worked example: comparing governance
Suppose a country’s national government can redraw the powers of provinces whenever it chooses. The country is organized in a unitary manner because regional authority depends primarily on the central government. In a different country, the constitution reserves certain powers for states or provinces, so both national and regional governments possess recognized authority; that is a federal arrangement.
The two countries may both control their borders, make laws, and participate in international relations. Their difference lies in where governmental power is located within the territory, not in whether either country possesses sovereignty.
AP alignment and reasoning
This topic is tied directly to IMP-4.C.1 and IMP-4.D.1, which address the territorial organization of governance in unitary and federal states.
The most relevant AP skills are Skill 1.A: Describe geographic concepts, processes, models, and theories, used when identifying sovereignty, unitary governance, or federal governance; Skill 1.B: Explain geographic concepts, processes, models, and theories, used when showing how authority is organized; and Skill 2.C: Explain spatial relationships, used when connecting political power to national, regional, and local territories.
A strong free-response explanation uses a relationship rather than a label: Because a unitary state concentrates authority in the central government, regional governments generally have powers delegated from the center; because a federal state constitutionally divides authority, regional governments retain protected powers.
Misconception check
Misconception: “Federal” means weaker sovereignty. Federalism changes how power is distributed internally; it does not automatically reduce a state’s sovereignty. A federal state can still control its territory, conduct foreign affairs, resist outside interference, and receive international recognition.
Retrieval check
A territory has its own local government, but a neighboring country directs its foreign policy and many internal decisions. Does it fully meet the definition of sovereignty? No. It may have self-rule in a limited sense, but external control violates the requirement of noninterference. A complete definition must also consider territorial control and international recognition.

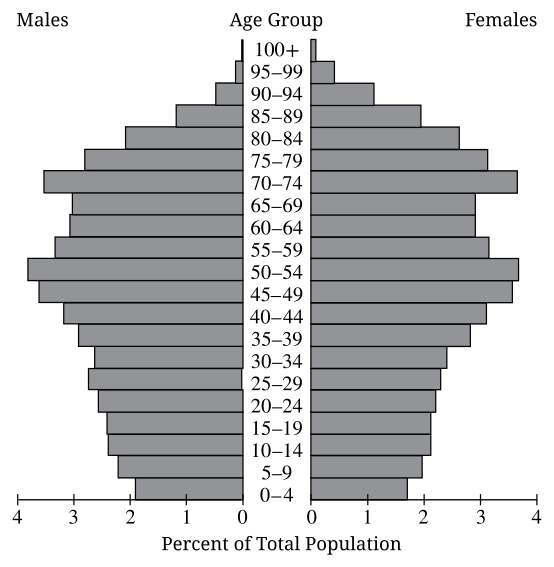
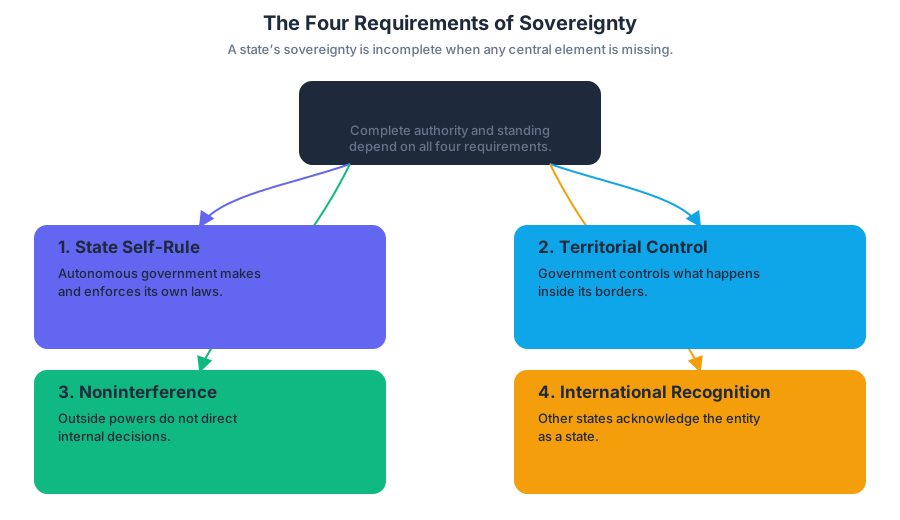
4.8 Defining Devolutionary Factors
Key concepts: Devolution · Devolutionary factors · State sovereignty · Challenges to sovereignty · Supranationalism · Unitary systems · Centralization · Urban and rural populations · Rural natural increase (RNI) · Political, economic, cultural, and technological change
A state can look unified on a political map while containing powerful forces pulling it apart. Devolution is the transfer of power from a central government to regional or local governments; in more extreme cases, devolution may produce autonomous regions, the fragmentation of a state, or complete state disintegration.
4.8 Defining Devolutionary Factors
A state can look unified on a political map while containing powerful forces pulling it apart. Devolution is the transfer of power from a central government to regional or local governments; in more extreme cases, devolution may produce autonomous regions, the fragmentation of a state, or complete state disintegration.
Enduring Understanding SPS-4: Political, economic, cultural, or technological changes can challenge state sovereignty.
State sovereignty means a state’s authority to govern its territory and population without another government controlling its internal or external affairs. Devolution challenges sovereignty because regional governments may gain enough authority to make their own laws, collect revenue, control services, or demand independence.
The spatial logic of devolution
Imagine political power as water in a reservoir. In a highly centralized system, most power remains in the national reservoir. Devolution opens channels that move some of that power outward to provinces, territories, or municipalities.
Unitary systems concentrate political power in a central government through centralization. A national government may still delegate responsibilities to local governments, but it can usually redefine or withdraw those powers. Devolution in a unitary state therefore represents a meaningful shift away from the traditional concentration of authority.
| Political arrangement | Where authority is concentrated | Spatial pattern |
|---|---|---|
| Centralized unitary system | National government | Power flows mainly from the center outward |
| Devolved state | National and regional governments | Power is redistributed across territorial scales |
| Disintegrating state | Competing regional authorities | National control weakens or breaks apart |
Factors that contribute to devolution
Learning Objective SPS-4.A: Define factors that lead to the devolution of states. The CED identifies several devolutionary factors: division by physical geography, ethnic separatism, ethnic cleansing, terrorism, economic and social problems, and irredentism.
- Physical geography can divide populations through mountains, deserts, islands, or difficult transportation corridors. Distance and rugged terrain make communication with the national capital harder and can reinforce regional identities.
- Ethnic separatism occurs when an ethnic group seeks greater autonomy or its own state rather than remaining governed by the national majority.
- Ethnic cleansing—the forced removal of an ethnic group from a territory—can intensify territorial conflict and destroy political cohesion.
- Terrorism can weaken state authority by making regions difficult to govern and by provoking conflict between central authorities and local populations.
- Economic and social problems include uneven development, unemployment, unequal access to infrastructure, and perceptions that one region subsidizes another without receiving fair benefits.
- Irredentism is the desire to acquire territory inhabited by people who share a particular ethnic or national identity, often across an international boundary.
Essential Knowledge SPS-4.A.1: Devolution can occur when states fragment into autonomous regions or subnational political-territorial units, as in Spain, Belgium, Canada, and Nigeria. It can also occur through state disintegration, as happened in Sudan and the former Soviet Union.
Worked geographic example: why scale matters
Consider a hypothetical country with a mountainous western region. The region contains $70%$ of the country’s mineral exports but receives only $35%$ of national infrastructure spending. Its population speaks a distinct language, and the capital is separated from the region by a mountain chain with few roads.
At the state scale, the country may appear economically productive but politically unstable. At the regional scale, residents may see a pattern of resource extraction, underinvestment, and cultural marginalization. These spatial relationships can generate demands for local control over taxation, language policy, and development planning.
This is an example of Skill 5.C: Compare geographic characteristics and processes at various scales. A strong explanation does not merely state that “the region wants independence.” It connects a measurable regional pattern—such as infrastructure spending, resource production, or linguistic concentration—to the political challenge at the state scale.
Rural–urban differences can also shape political pressures. Rate of natural increase (RNI) is calculated as the crude birth rate minus the crude death rate, commonly expressed as a percentage:
$$ \text{RNI} = \frac{\text{birth rate} - \text{death rate}}{10} $$
Rural populations typically have a higher RNI than urban populations. Higher rural fertility can produce a younger, faster-growing population, while cities often have lower fertility because of later marriage, higher living costs, greater access to education, and wider access to family planning. If public services and political representation do not keep pace with rural growth, economic and social grievances may deepen.
Technology and supranationalism
Modern communication and transportation technologies can produce two opposite political effects. Digital networks may strengthen a regional identity by allowing separatist movements to organize across distance, while the same technologies help governments monitor territory and coordinate national services.
Supranationalism is cooperation in which states transfer or share some authority with a larger international organization. States may join such organizations to address environmental problems, security threats, trade, or economic development, but shared decision-making can limit individual state sovereignty.
The scale contrast is essential: devolution shifts authority downward from the state to subnational regions, whereas supranationalism shifts or shares authority upward with international institutions. Both challenge the idea that the national government is the only important political decision-maker.
Misconception check
Misconception: “Devolution always means a country breaks apart.” Devolution may stop at regional autonomy, as with subnational units receiving expanded powers. State disintegration is a more extreme outcome in which the existing state loses territorial and political unity.
Retrieval check: A region has a distinct ethnic identity, poor transportation links to the capital, high unemployment, and lower infrastructure investment than the national average. Identify two devolutionary factors and explain how one could challenge state sovereignty.
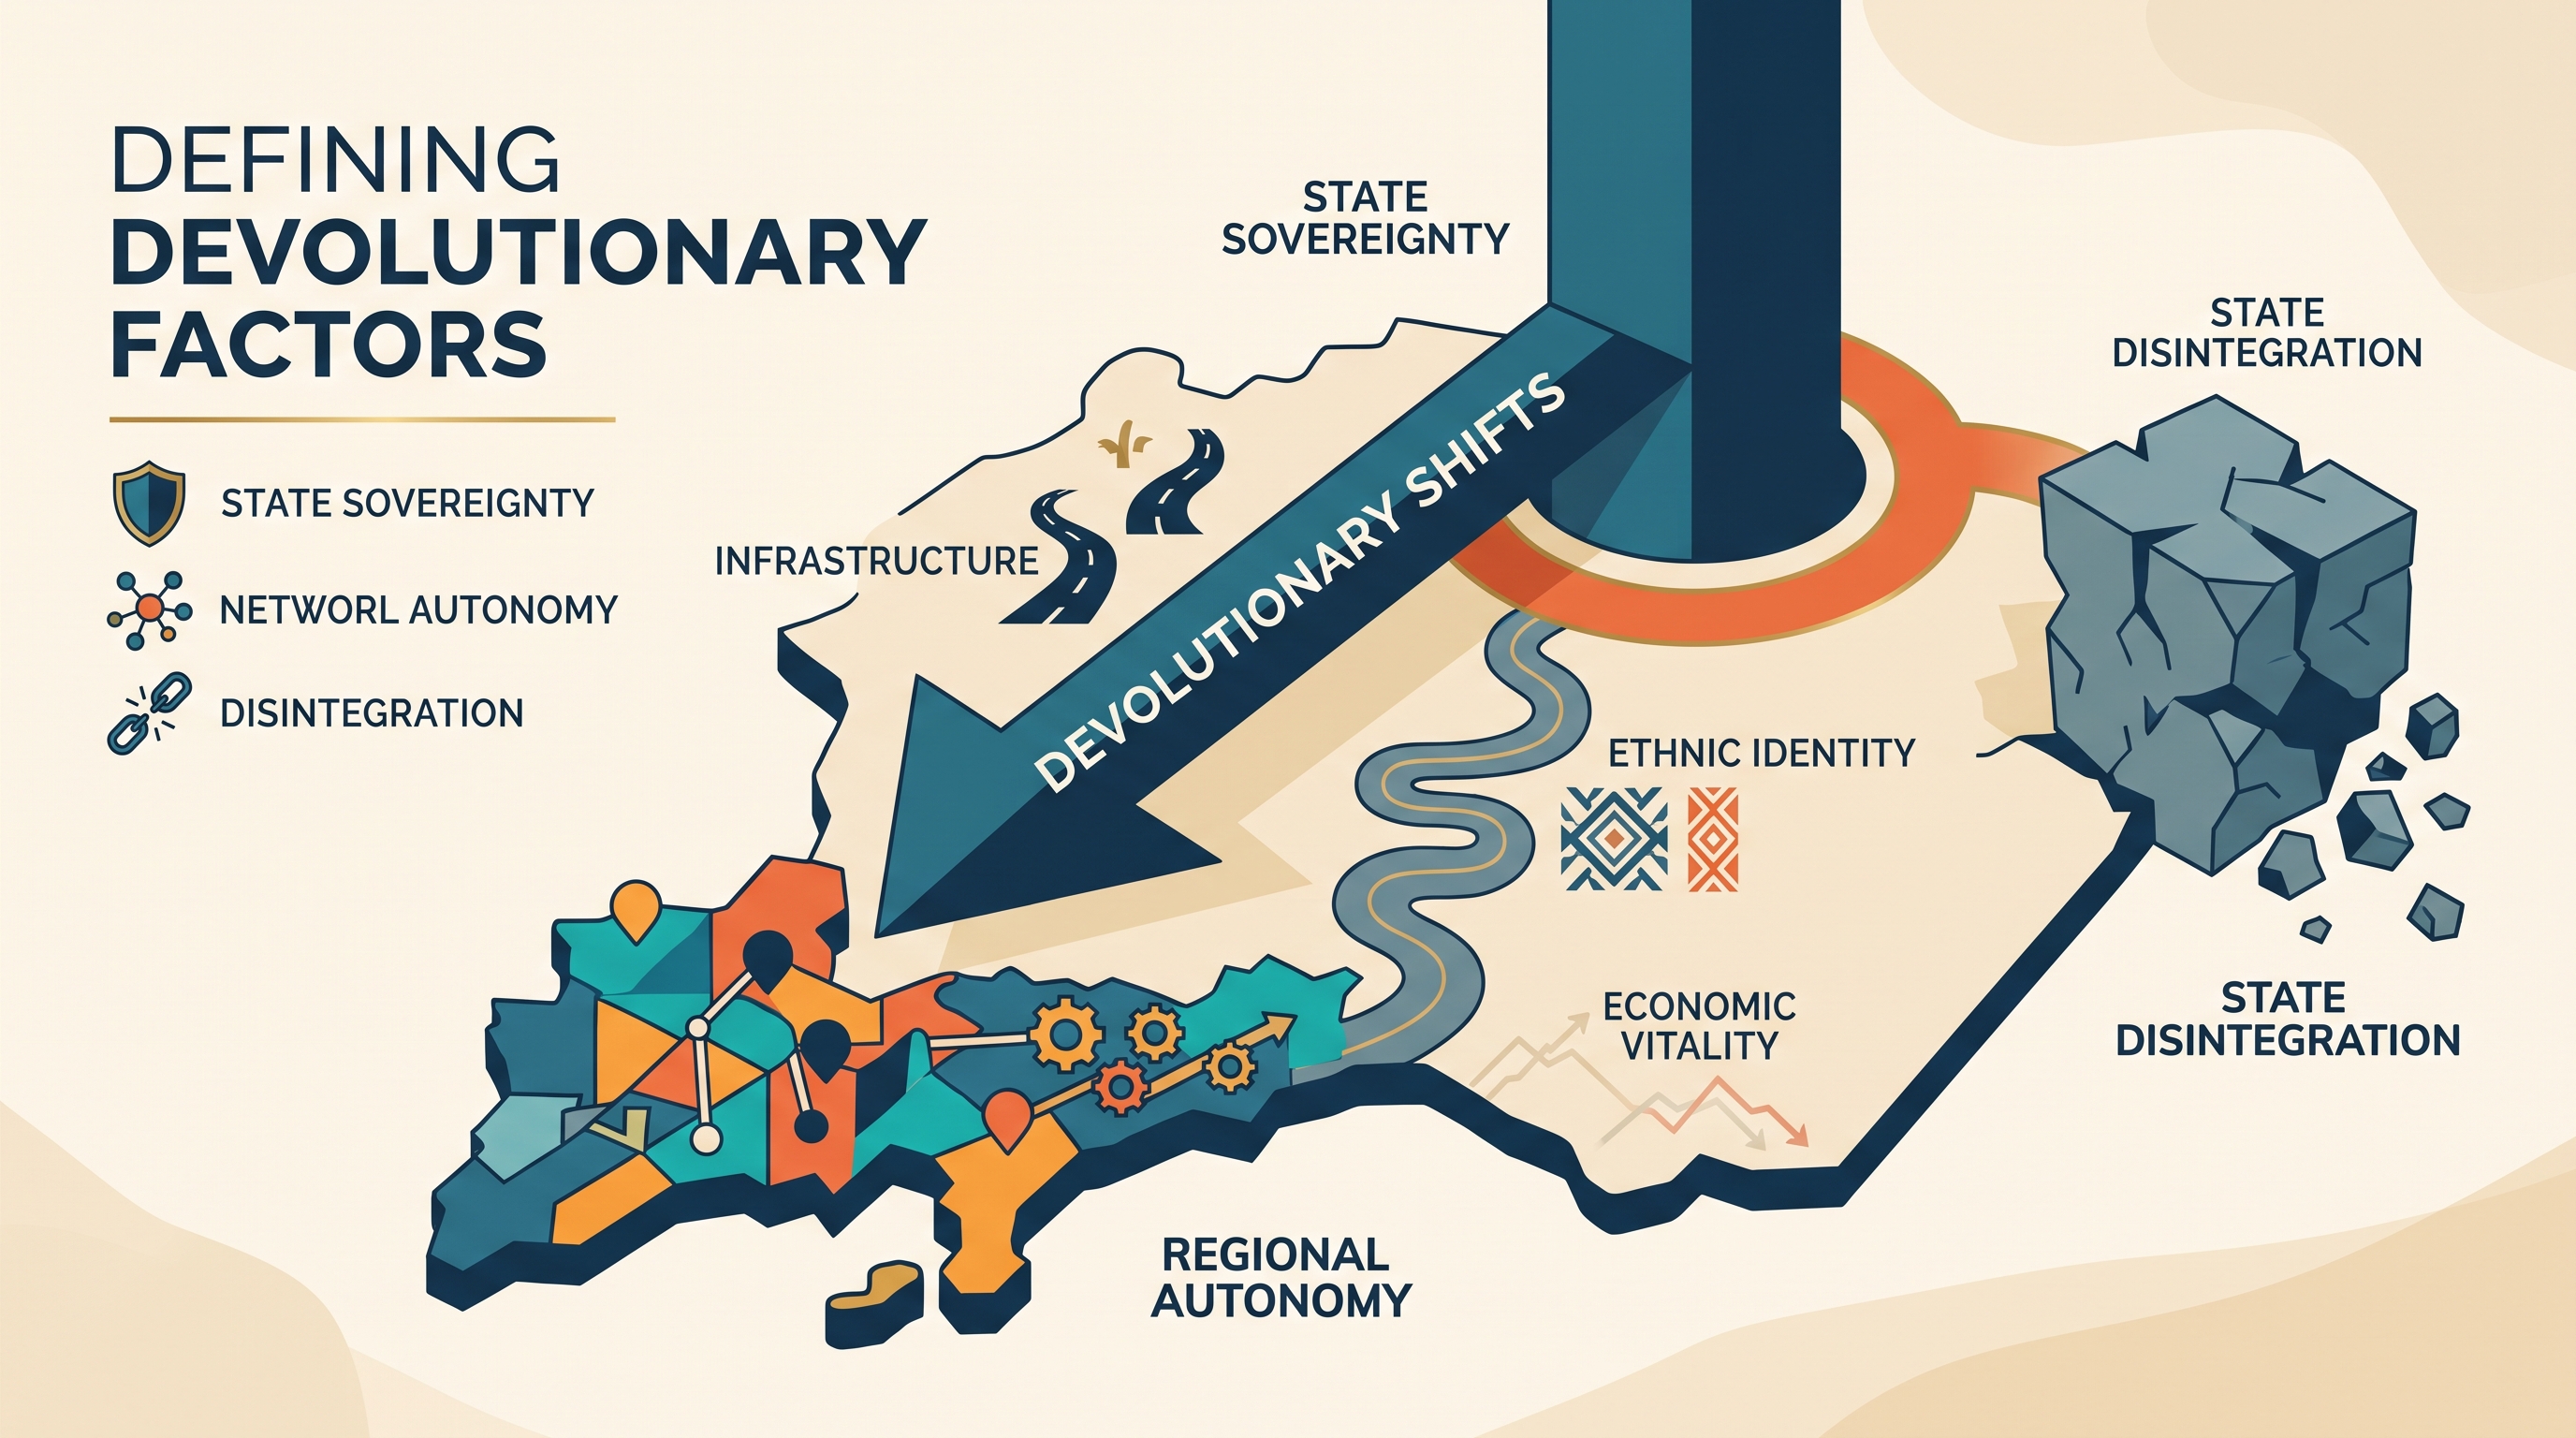
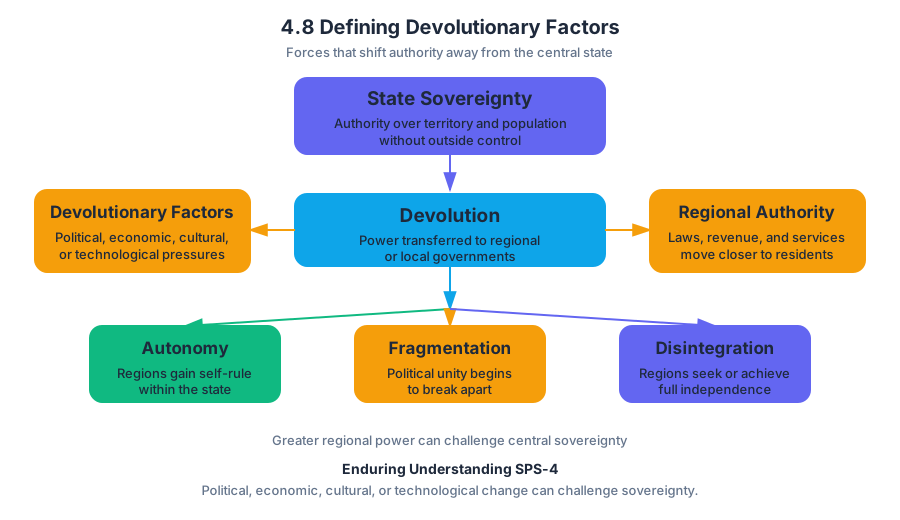
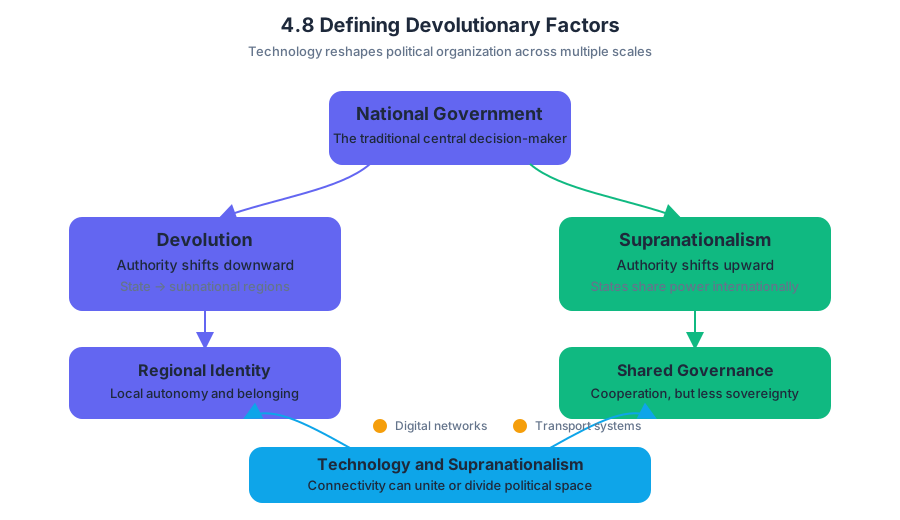
4.9 Challenges to Sovereignty
Key concepts: state sovereignty · territoriality · devolution · supranationalism · democratization · communication technologies · Scottish independence · Brexit and sovereignty · unitary and federal states · electoral district redistricting
State sovereignty is the authority of an independent government to control its territory, make and enforce its laws, and conduct its affairs without being controlled by an external power.
4.9 Challenges to Sovereignty
State sovereignty is the authority of an independent government to control its territory, make and enforce its laws, and conduct its affairs without being controlled by an external power. That authority is strengthened when other states recognize the government as legitimate; sovereignty is therefore both internal control and external recognition.
Sovereignty = autonomous government + control over territory and laws + recognition by other states
A state’s sovereignty can be challenged without immediately disappearing. Authority may be transferred downward to regional governments, shared upward with supranational organizations, redistributed through democratization, or weakened when communication technologies allow political groups to coordinate across boundaries.
Four pathways that challenge state sovereignty
1. Devolution: authority moves within the state
Devolution is the transfer of some powers from a national government to regional or local authorities. The state remains formally sovereign, but its central government no longer makes every decision uniformly across its territory.
A geographically distinct region may demand control over education, taxation, language policy, policing, or natural resources. In Scotland, proposals for independence from the United Kingdom illustrate a challenge to the United Kingdom’s sovereignty. Strictly speaking, devolution itself grants regional authority while keeping the region inside the existing state; full independence would create a separate sovereign state. A devolutionary demand can therefore be an alternative to independence or a step toward it.
Territoriality—the attempt to control a specific geographic area—helps explain why devolutionary movements are often regional. A region with a clear boundary, distinctive cultural identity, separate historical institutions, or concentrated resources may argue that its residents should exercise greater authority over the territory they inhabit.
Named misconception: Devolution does not automatically mean secession. Devolution redistributes authority inside an existing state; secession creates a new state claiming complete sovereignty.
2. Supranationalism: authority is shared above the state
Supranationalism occurs when states cooperate through an organization whose decisions or agreements influence member states. By joining such an organization, a state may voluntarily limit some independent control over trade, laws, borders, currency, security, or environmental policy.
The United Kingdom’s decision to withdraw from the European Union can be interpreted through sovereignty. Supporters of withdrawal opposed external influence over British laws and governance and argued that decision-making should return to the national government. The issue was not simply geographic separation; it was a debate over who should possess final authority.
3. Democratization: authority is redistributed politically
Democratization expands popular participation and accountability in governance. Elections, constitutional reforms, voting rights, and stronger local representation can challenge a centralized government when citizens demand that authority be exercised more directly by elected communities rather than by a distant national leadership.
Territorial organization affects how democratization works. Unitary states concentrate constitutional authority in a national government, which may delegate powers to local governments but can often revise that arrangement. Federal states constitutionally divide authority between national and regional governments, giving regions more protected power.
| Territorial organization | Where authority is concentrated | Geographic consequence |
|---|---|---|
| Unitary state | Primarily at the national level | Local powers are generally delegated |
| Federal state | Constitutionally divided between national and regional levels | Regional governments possess protected authority |
Redrawing internal electoral districts also changes how political power is distributed. If boundary lines divide a concentrated minority among several districts, that group may lose the ability to elect preferred representatives. If lines concentrate the group into one district, it may gain representation there but have less influence elsewhere. Thus, a seemingly local map can alter political outcomes at the city or state scale.
4. Communication technologies connect challengers across space
Advances in communication technology—such as social media, encrypted messaging, and rapid video sharing—allow people separated by distance to feel politically connected. Groups can publicize grievances, coordinate demonstrations, recruit supporters, and seek alliances beyond their immediate territory.
This connectivity can support devolution by helping a regional movement coordinate demands; supranationalism by linking organizations across countries; and democratization by allowing citizens to circulate information outside state-controlled channels. Communication technology does not itself create sovereignty, but it can change the structure of a state or its system of governance by making challenges easier to organize.
Scale analysis: locating the challenge
Skill 5.B: Scale Analysis asks how a political process changes when examined at different geographic levels. A district-boundary dispute operates locally, a Scottish autonomy movement operates regionally and nationally, and the European Union operates supranationally. Communication networks can connect all of these scales, allowing a local grievance to attract national or international support.
Retrieval check: A region receives control over schools and taxation but remains part of its country. Is this devolution or independence, and what role does territoriality play? Answer: It is devolution because authority has moved to a regional government within the existing state. Territoriality matters because the region seeks control over a specific, geographically distinct area.
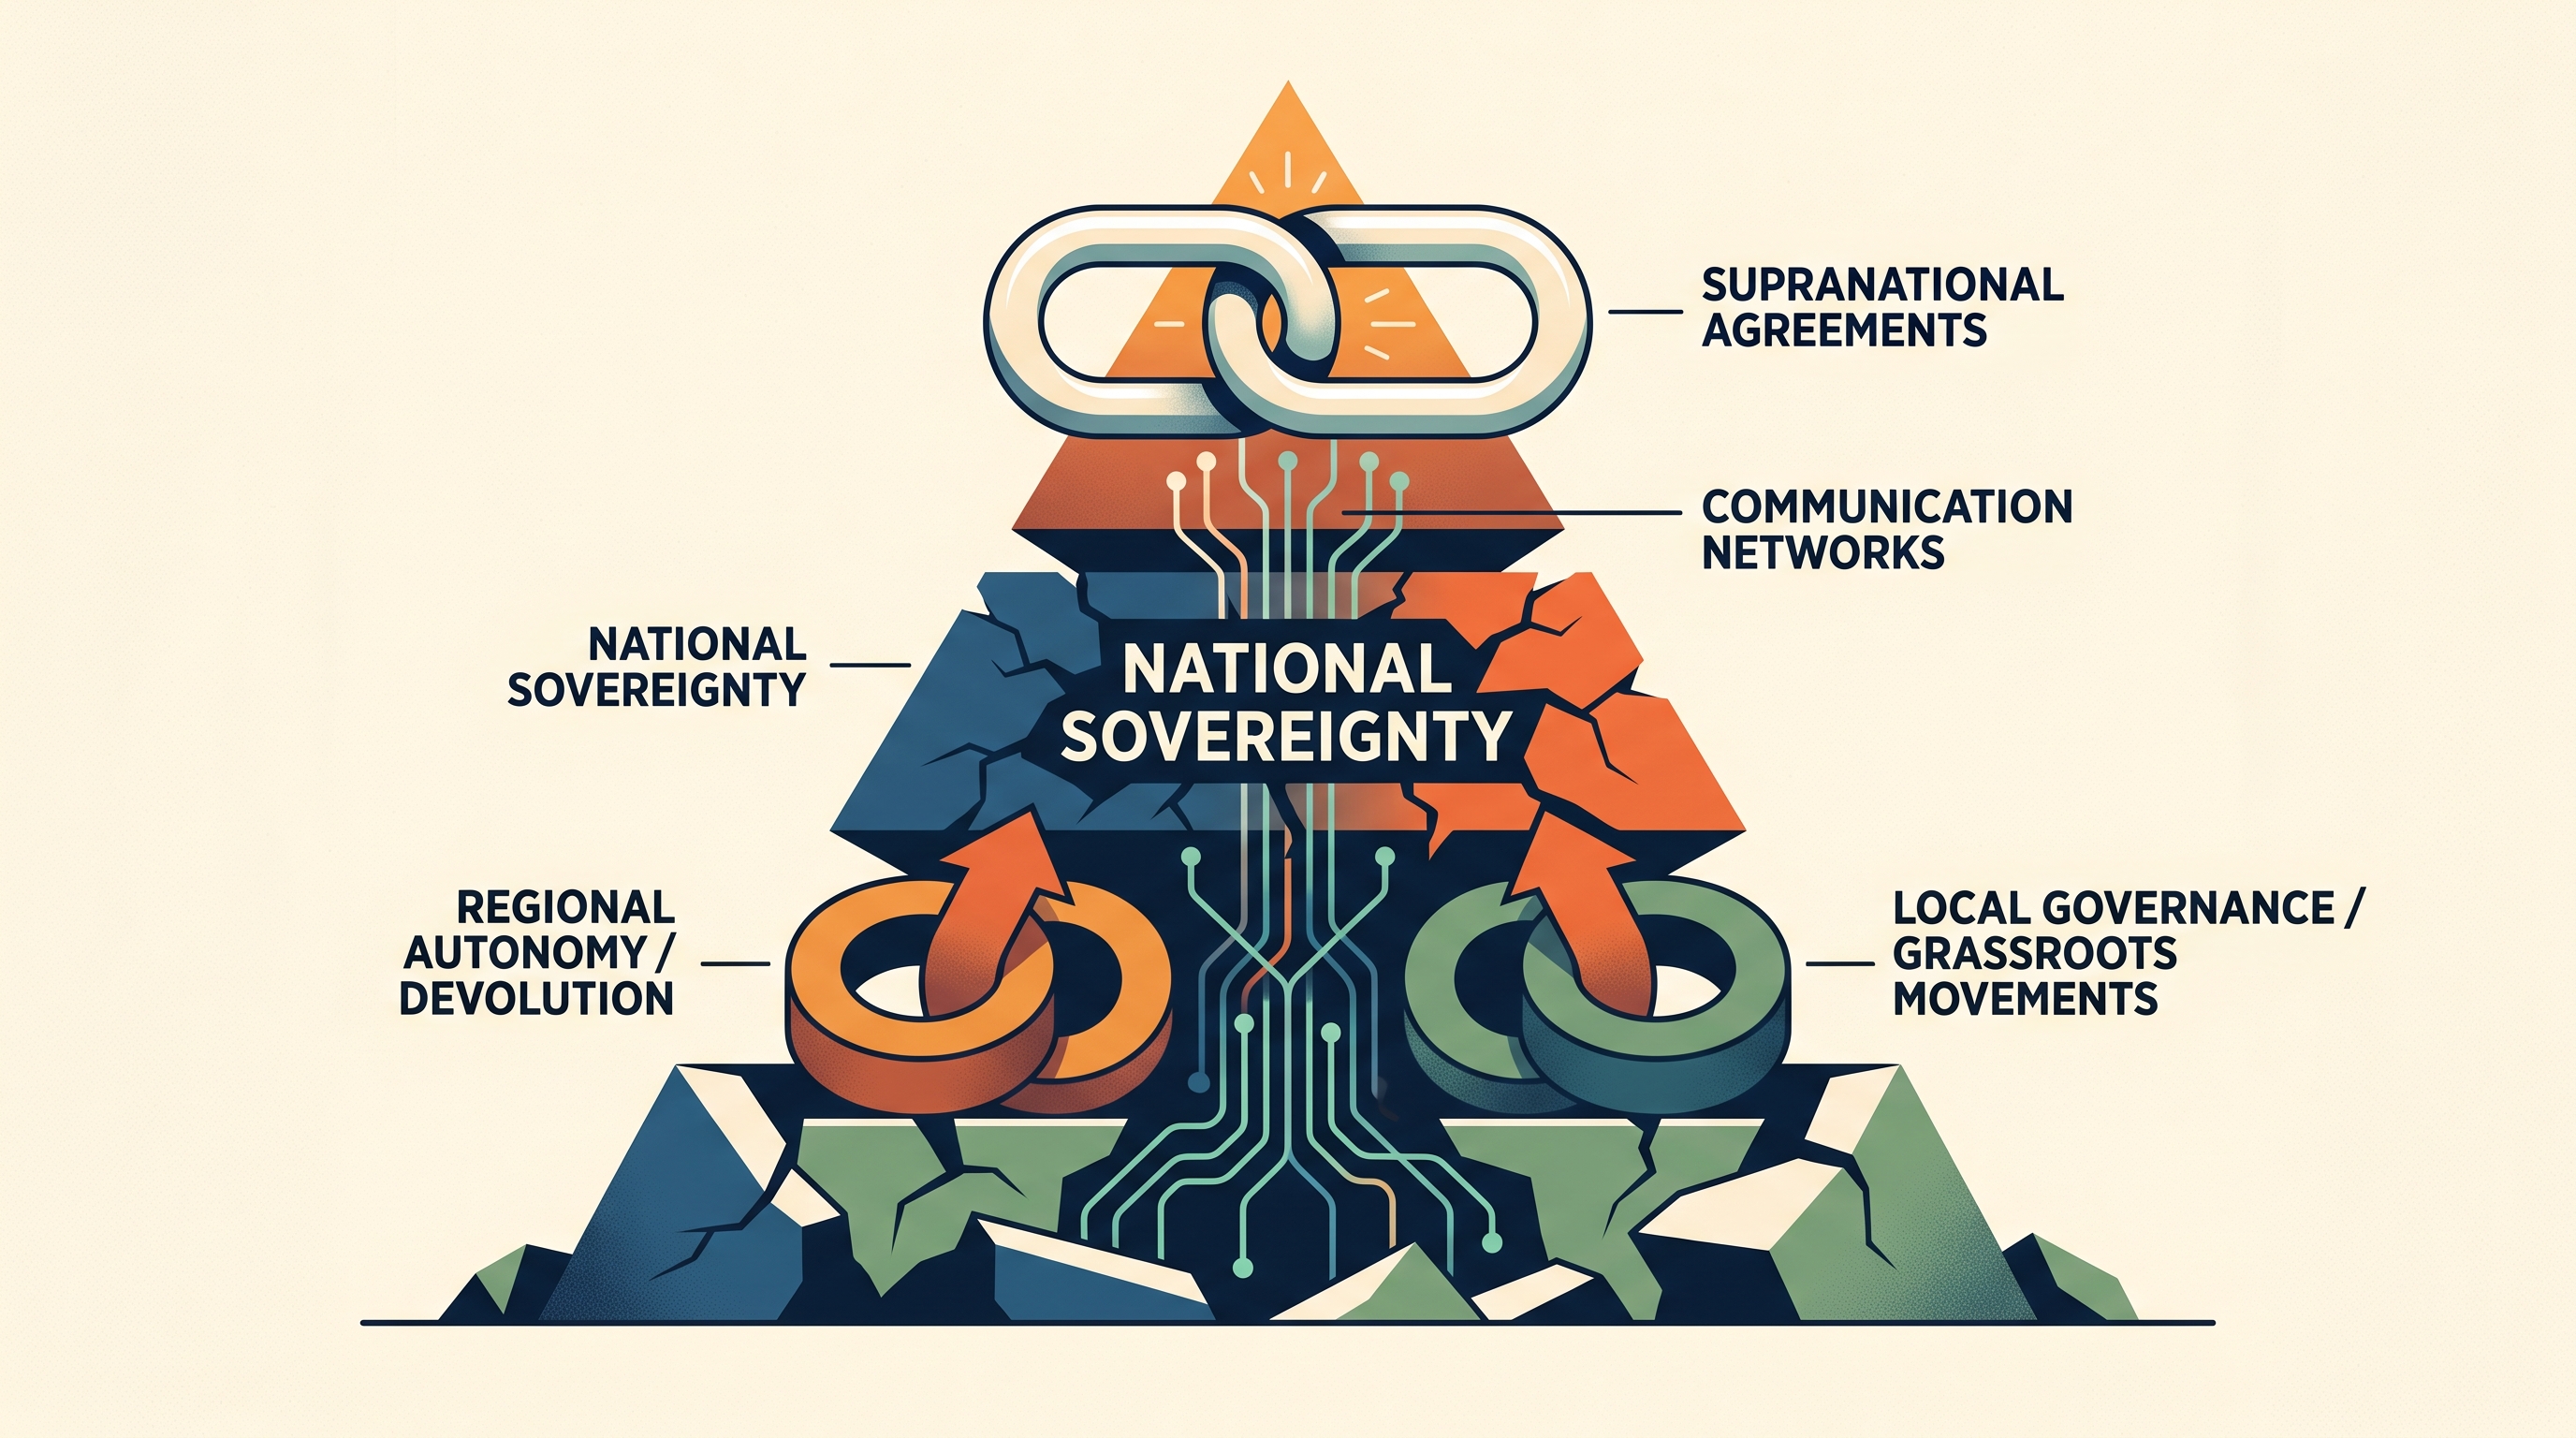
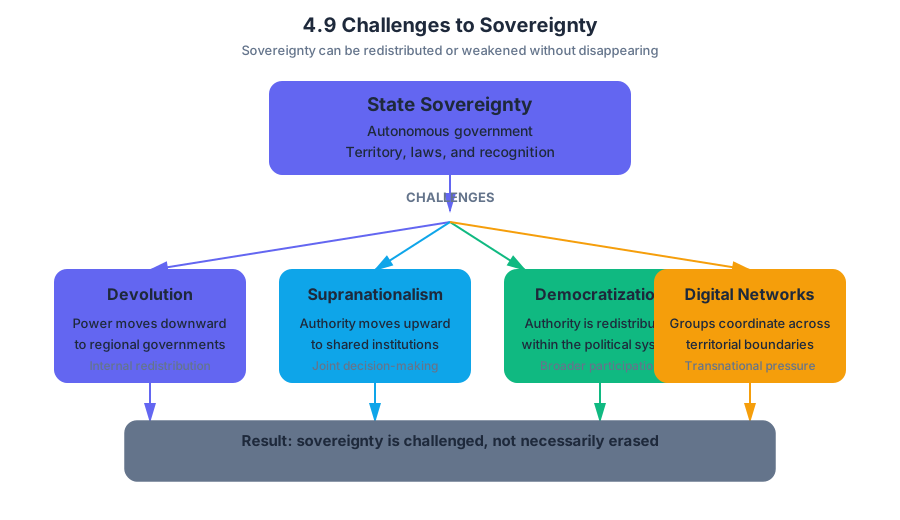
4.10 Consequences of Centrifugal and Centripetal Forces
Key concepts: Centrifugal forces · Centripetal forces · State sovereignty · State failure and state stability · Uneven economic development · Stateless nations · Ethnic nationalism and separatist movements · Devolution and autonomous regions · National identity and cultural unity · Language, ethnicity, and religion as political forces
A state can be pulled together by shared identity and infrastructure—or pulled apart by inequality, separatism, and distrust. Centrifugal forces are pressures that divide a state, while centripetal forces are pressures that unify it.
4.10 Consequences of Centrifugal and Centripetal Forces
A state can be pulled together by shared identity and infrastructure—or pulled apart by inequality, separatism, and distrust. Centrifugal forces are pressures that divide a state, while centripetal forces are pressures that unify it. Their consequences are central to state sovereignty, the authority of a state to govern its territory and population.
Enduring Understanding [SPS-4]: Political, economic, cultural, or technological changes can challenge state sovereignty.
Learning Objective [SPS-4.C]: Explain how the concepts of centrifugal and centripetal forces apply at the state scale.
Two opposing forces at the state scale
The simplest way to visualize the relationship is as a tug-of-war over state stability. A state is not automatically stable because it has legal borders; stability depends on whether people accept, participate in, and benefit from the state’s authority.
| Force | Direction of pressure | Typical consequences |
|---|---|---|
| Centrifugal | Pulls groups and territories away from the state | Failed states, uneven development, stateless nations, ethnic nationalist movements |
| Centripetal | Pulls groups toward a shared state identity | Political unity, stronger state stability, cultural cohesion, more equitable infrastructure |
Centrifugal forces may be political, economic, cultural, or technological. Economic inequality can make one region feel exploited while another receives better roads, schools, jobs, or public services. Cultural differences can become politically divisive when an ethnic group believes the dominant group controls government and uses state power to suppress its identity. Separatist movements, ethnic cleansing, and terrorism are especially severe forms of internal division.
A stateless nation is a cultural group with a shared national identity that does not possess its own independent state. When a group believes that the existing state cannot protect its language, religion, territory, or political interests, ethnic nationalism may develop: the belief that a particular ethnic nation should control its own political territory. If separatists establish competing territorial control, the state’s sovereignty weakens because the central government can no longer exercise authority uniformly.
How centrifugal pressure produces instability
State failure occurs when a government loses the capacity to provide security, public services, or effective control over its territory. Centrifugal forces do not automatically cause state failure, but persistent regional inequality, armed conflict, terrorism, or competing ethnic authorities can erode state stability.
Worked example: Imagine a multinational state with three regions. Region A contains the capital and most industries; Region B has valuable minerals but receives little public investment; Region C speaks a different language and has historically experienced discrimination. If mineral revenues remain concentrated in Region A, residents of Region B may demand autonomy. If Region C’s language is banned, its political movement may become separatist. The government could respond with shared infrastructure and language recognition—centripetal strategies—or with strict military control. The first approach may preserve sovereignty by giving groups a reason to remain within the state; the second may suppress dissent temporarily while deepening centrifugal resentment.
Centripetal forces and the construction of unity
Centripetal forces promote political unity and strengthen state stability. Governments can use national symbols—flags, anthems, monuments, holidays, and public ceremonies—to present the state as a shared nation. These symbols help build national identity, especially in states containing several ethnic or linguistic groups.
Centripetal forces can also be material rather than symbolic. Shared infrastructure connects regions physically and economically; national resources such as schools, hospitals, transportation systems, and communication networks distribute the benefits of citizenship; and cultural unity can grow through shared languages, traditions, or civic values. More equitable infrastructure development matters because people are more likely to support a state they experience as fair.
A multinational state facing ethnic tension has two broad strategies. It may create autonomous regions, allowing a minority territory to control selected local matters such as education, language, or cultural policy while remaining inside the state. This can reduce devolutionary pressure and preserve central sovereignty. Alternatively, the government may maintain strict central control, refusing territorial autonomy and enforcing uniform laws. That strategy can produce unity when institutions are trusted, but it can intensify centrifugal forces when groups view central authority as domination.
The same policy can unite or divide
A national language policy illustrates why consequences depend on context. Requiring one language in public administration may improve communication and create a common civic identity—a centripetal effect. If the policy suppresses minority languages, however, it may generate ethnic nationalism and separatism—a centrifugal effect. The geographic scale of analysis also matters: a policy that strengthens the state overall may weaken trust in a particular region.
Misconception check: Centripetal forces are not simply “good,” and centrifugal forces are not always “bad.”
A regional autonomy agreement may appear to weaken central control, yet it can preserve the state by reducing separatism. Conversely, forced uniformity may appear to strengthen the state while producing deeper instability.
Under Essential Knowledge [SPS-4.C.1], centrifugal forces may lead to failed states, uneven development, stateless nations, and ethnic nationalist movements. Under Essential Knowledge [SPS-4.C.2], centripetal forces can lead to ethnonationalism, more equitable infrastructure development, and increased cultural cohesion. The required reasoning is causal: identify the force, describe how it operates geographically, and connect it to a consequence for state stability.
Retrieval check: A government funds roads, schools, and hospitals equally across linguistic regions while recognizing each region’s cultural traditions. Is this primarily centrifugal or centripetal? Explain one mechanism and one likely consequence. A strong answer identifies a centripetal force, explains that equitable investment and cultural recognition build trust and cohesion, and connects those effects to stronger state stability.
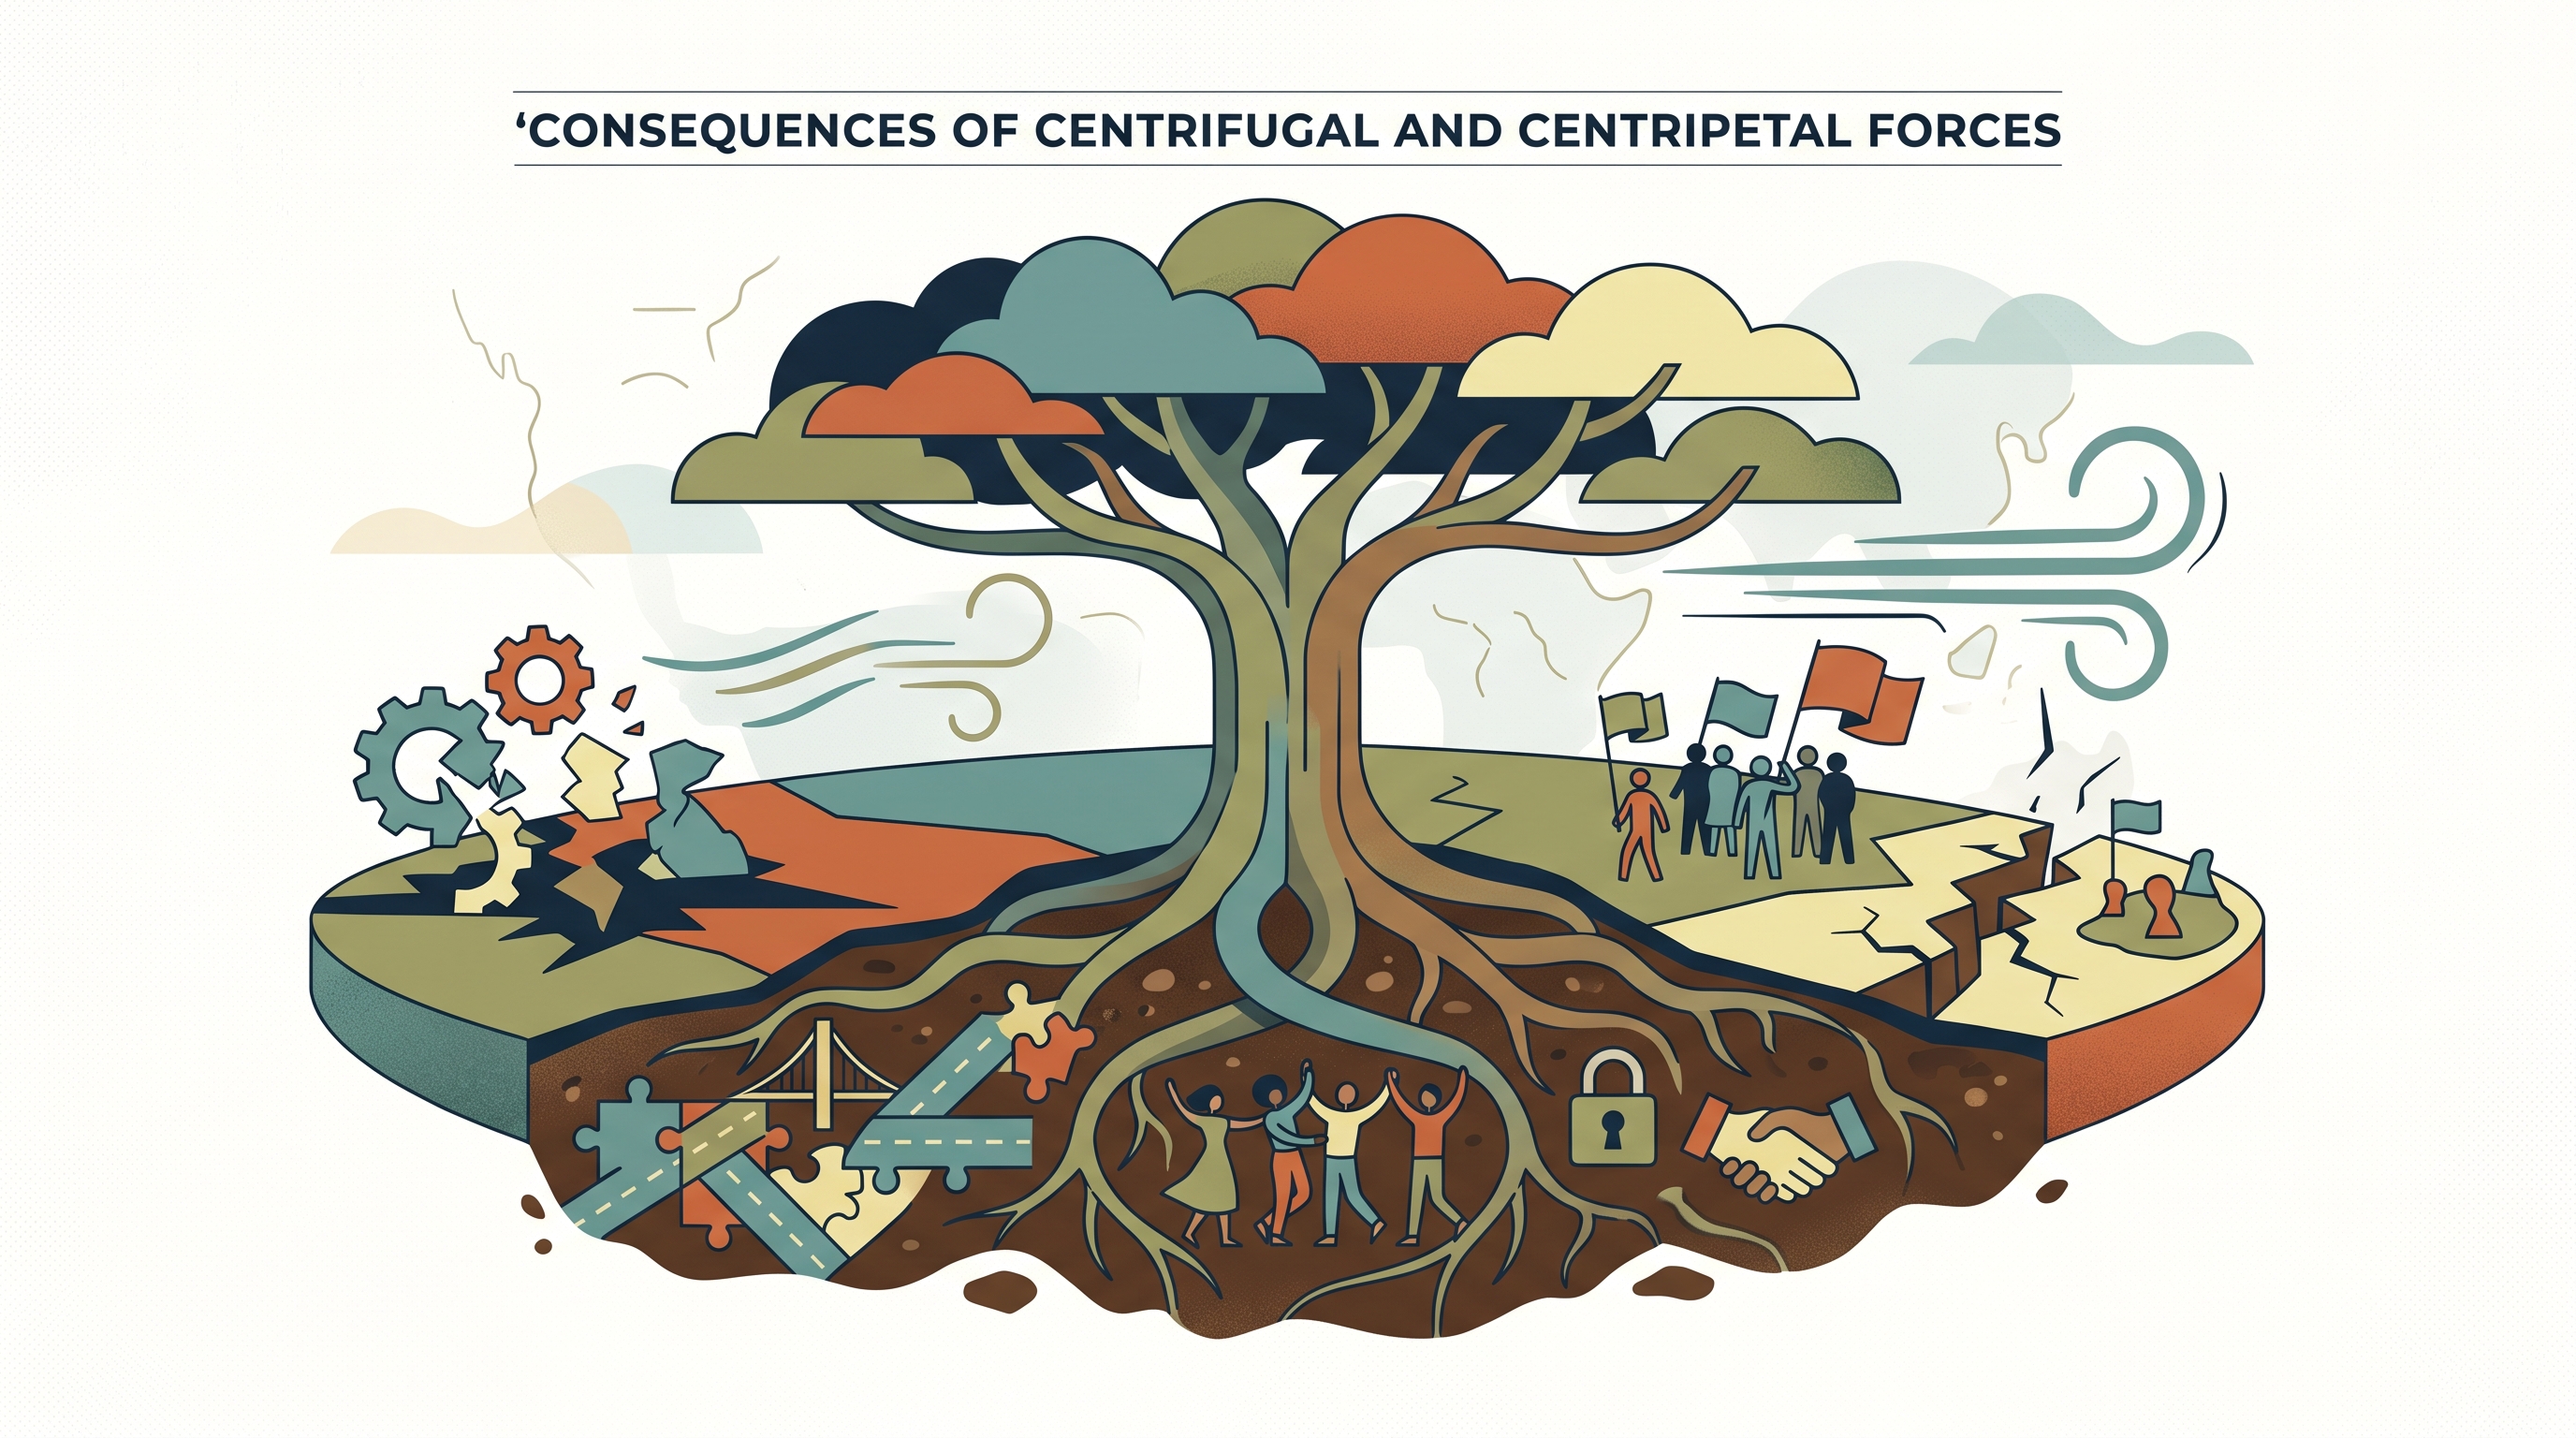
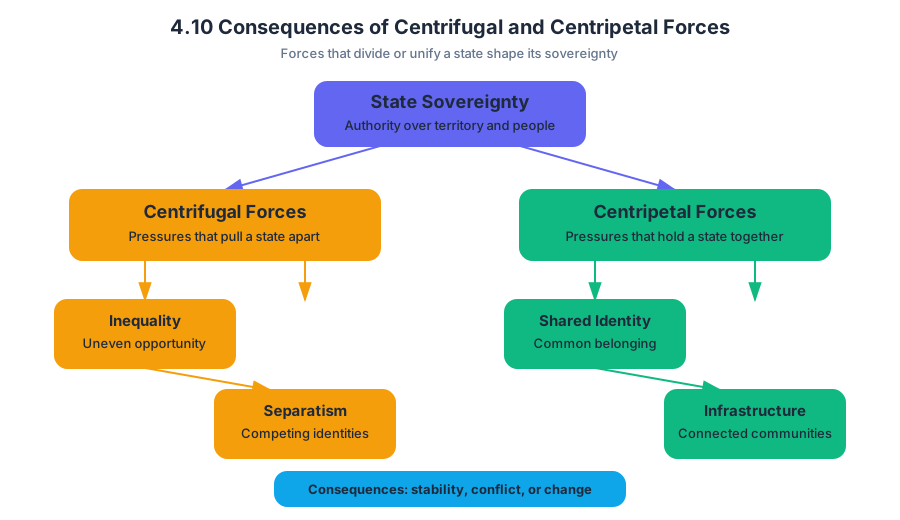
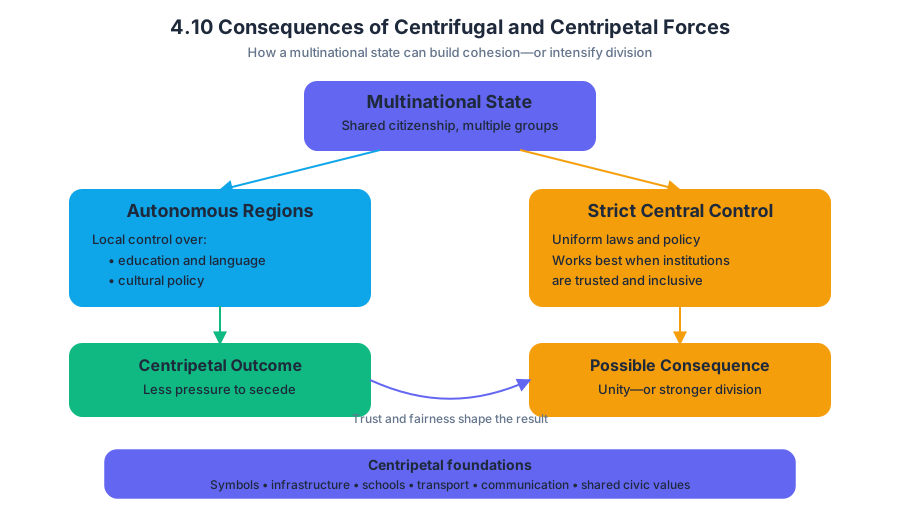
5.1 Introduction to Agriculture
Agriculture is the deliberate cultivation of plants and the raising of animals to produce food, fiber, fuel, and other goods. It is both an environmental activity and a human system: climate and soil set possibilities, while technology, markets, culture, government policy, and transportation shape what people…
5.1 Introduction to Agriculture
Agriculture is the deliberate cultivation of plants and the raising of animals to produce food, fiber, fuel, and other goods. It is both an environmental activity and a human system: climate and soil set possibilities, while technology, markets, culture, government policy, and transportation shape what people actually produce.
Why agriculture matters
A city meal may seem disconnected from farming, but nearly every ingredient begins in an agricultural landscape. Wheat may be grown on large mechanized farms, coffee on smallholder plots, cattle on ranches, and vegetables near an urban market. Agriculture therefore connects rural land use to population, trade, culture, environmental change, and economic development.
Agriculture occurs in both developed countries—countries with relatively high levels of industrialization, income, infrastructure, and access to technology—and developing countries, where industrialization and average incomes are generally lower and unevenly distributed. This distinction does not mean that developed countries lack farms or that developing countries use only traditional methods. Both groups contain highly varied agricultural systems.
Essential Knowledge AGR-5.A.1: Agriculture is practiced in both developed and developing countries.
A useful comparison is not “modern versus traditional,” but rather the combination of inputs, technology, labor, capital, and market access used in a particular place. A highly mechanized grain farm may use few workers but substantial capital, while an intensively cultivated small farm may produce a large harvest from limited land through careful labor and irrigation.
Physical and human influences
Physical factors are environmental conditions that influence agricultural possibilities. Important examples include temperature, precipitation, length of the growing season, soil fertility, terrain, and water availability. Rice generally requires abundant water and warm growing conditions, while wheat can be cultivated across broad temperate regions with less standing water.
Human factors are social, economic, political, and technological forces that influence agricultural decisions. These include land ownership, labor costs, consumer demand, government subsidies, transportation networks, irrigation, access to machinery, cultural preferences, and the distance to markets.
Essential Knowledge AGR-5.A.2: Agricultural production and consumption patterns are influenced by physical and human factors.
The key geographic idea is that physical conditions create opportunities and constraints, not a single unavoidable outcome. Greenhouses can extend growing seasons; irrigation can bring water to dry regions; terracing can make steep slopes usable; refrigeration can move perishable foods over long distances. At the same time, these adaptations require money, labor, infrastructure, and knowledge.
Worked example: choosing a crop
Imagine two farming regions. Region A has warm temperatures, abundant rainfall, and steep hillsides. Region B is relatively flat, drier, and connected to a major highway.
- Physical assessment: Region A favors water-demanding crops but presents erosion and mechanization challenges because of its slopes. Region B requires irrigation but is easier to cultivate with machines.
- Human assessment: If Region A has abundant labor and nearby consumers who prefer a particular staple crop, intensive small-scale farming may be practical. If Region B has substantial capital, irrigation, machinery, and highway access, large-scale commercial production becomes more feasible.
- Geographic conclusion: Neither region has one inevitable agricultural future. The observed pattern results from the interaction of environmental conditions with human choices and resources.
Skills in action
This topic is assessed through the course’s geographic reasoning skills:
- Skill 1. Concepts and Processes: Apply the concepts of physical factors, human factors, agricultural production, and consumption to a real location.
- Skill 2. Spatial Relationships: Explain why agricultural activities are distributed differently across places.
- Skill 3. Data Analysis: Interpret a map, graph, table, or infographic showing crop production, food consumption, climate, or land use.
- Skill 4. Source Analysis: Use a photograph, satellite image, or landscape to identify evidence of an agricultural system and infer the factors shaping it.
- Skill 5. Scale Analysis: Explain how a farming decision affects a field, region, country, or global food system differently.
For example, a map showing high wheat production does not by itself prove that wheat grows naturally everywhere in those regions. A strong explanation connects the pattern to growing conditions, farm technology, transportation, markets, and policy—and distinguishes what the map directly shows from what must be inferred.
Misconception check: “Agriculture is only rural”
Agriculture is usually associated with rural land, but its effects are not confined there. Urban consumers, food-processing companies, global trading networks, supermarkets, and government policies influence what farmers produce. Conversely, agricultural change can affect urban food prices, employment, migration, and environmental quality.
Retrieval check
A dry, flat region begins producing vegetables for a distant city after installing irrigation and building a refrigerated highway. Which factor is physical, which factors are human, and why does this example demonstrate possibilism rather than environmental determinism?
Answer: Dryness is a physical constraint. Irrigation, refrigeration, transportation, investment, and urban demand are human factors. The region’s environment limits some choices but does not determine one inevitable land use; human actions create additional possibilities.
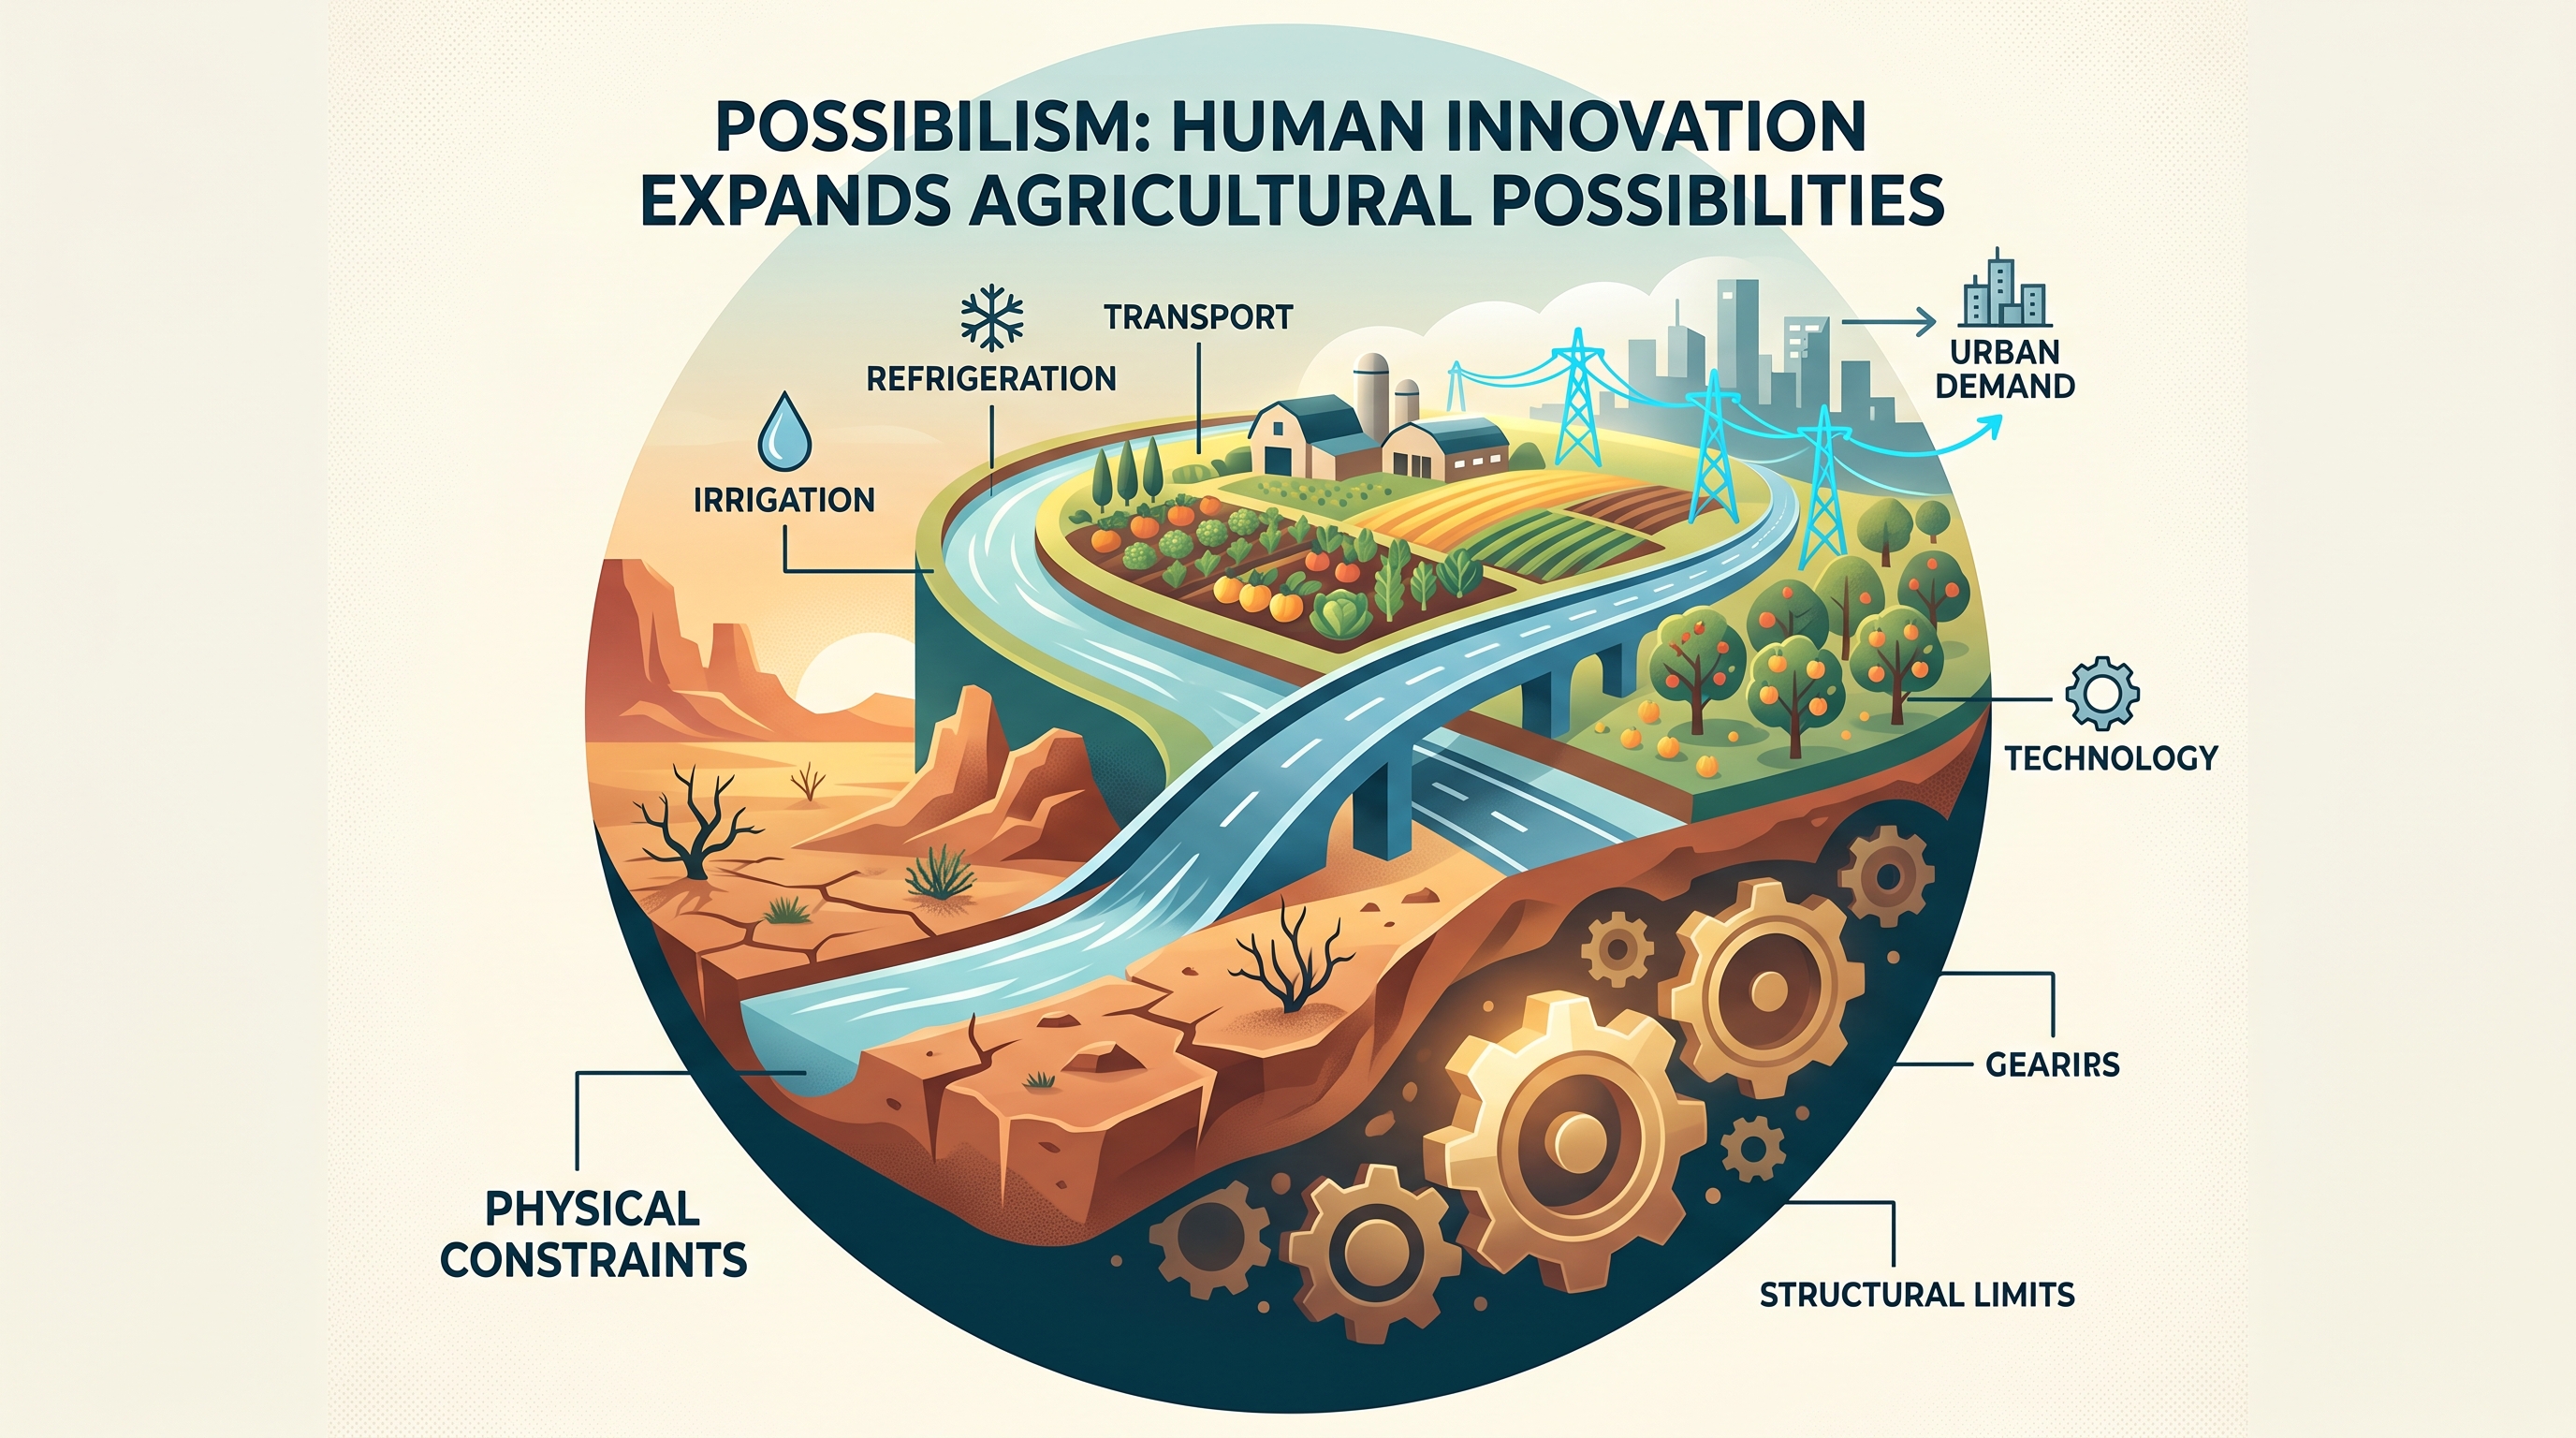
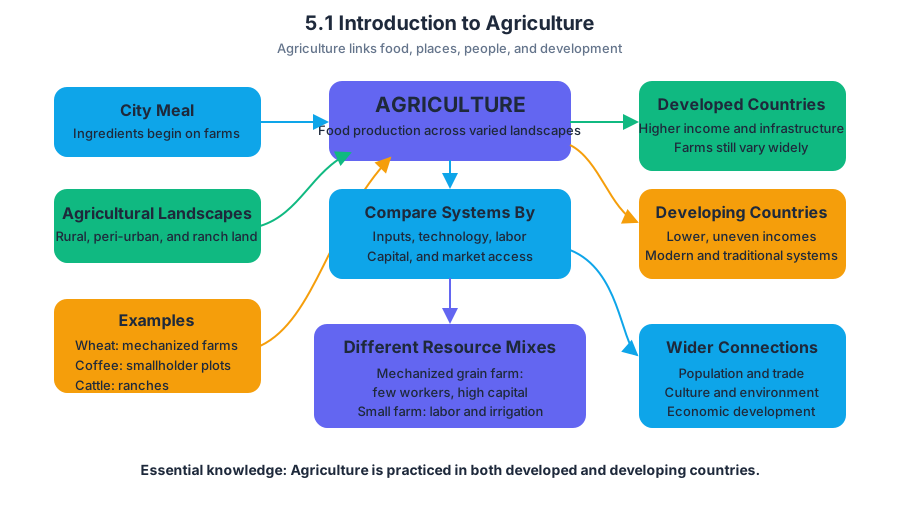
5.2 Settlement Patterns and Survey Methods
Key concepts: Rural settlement patterns · Clustered settlements · Dispersed settlements · Linear settlements · Metes-and-bounds surveying · Township-and-range surveying · Long-lot surveying · Rural land-use patterns · Agricultural practices and resource availability · Visual source analysis
A rural landscape is not randomly assembled: the way homes, fields, roads, and water are arranged reveals how people use resources, move across space, and organize land ownership.
5.2 Settlement Patterns and Survey Methods
A rural landscape is not randomly assembled: the way homes, fields, roads, and water are arranged reveals how people use resources, move across space, and organize land ownership. Rural settlement patterns describe the visible arrangement of buildings and farmsteads, while survey methods describe the system used to divide and record the land itself.
Enduring Understanding PSO-5: Availability of resources and cultural practices influence agricultural practices and land-use patterns.
Learning Objective PSO-5.B: Identify different rural settlement patterns and methods of surveying rural settlements.
Essential Knowledge
- PSO-5.B.1: Specific agricultural practices shape different rural land-use patterns.
- PSO-5.B.2: Rural settlement patterns are classified as clustered, dispersed, or linear.
- PSO-5.B.3: Rural survey methods include metes and bounds, township and range, and long lot.
Reading the rural landscape
Imagine looking down from an airplane. If houses form a compact knot around a church, crossroads, or village green, the settlement is clustered. If each farmhouse sits among its own fields with large spaces between homes, it is dispersed. If buildings form a narrow chain beside a river, road, railway, or coastline, the settlement is linear.
| Pattern | What the buildings look like | Why it may develop |
|---|---|---|
| Clustered | Buildings grouped around a central settlement area | Shared services, defensive needs, community institutions, or a tradition of village living |
| Dispersed | Homes and farmsteads spread across the landscape | Large individual holdings, mechanized farming, or a preference for living near one’s fields |
| Linear | Buildings arranged in a line | Access to roads, rivers, coastlines, railways, or other transportation routes |
These categories describe spatial arrangement, not levels of development. A clustered settlement is not automatically older or poorer than a dispersed settlement, and a linear settlement is not simply “a town that happens to be long.” The key evidence is the relationship between buildings and the physical or transportation feature guiding their placement.
Clustered settlements
In a clustered settlement, buildings are grouped together around a central settlement area. This arrangement can make shared institutions—such as a market, school, religious building, or water source—more accessible. Fields may extend outward from the settlement, creating a clear contrast between a compact residential core and surrounding agricultural land.
Dispersed settlements
In a dispersed settlement, homes and farmsteads are spread across the landscape rather than concentrated in one village. This pattern commonly corresponds to agricultural systems in which households occupy or work separate parcels, especially where land is abundant or farms require substantial space.
Linear settlements
Linear settlements develop along roads, rivers, coastlines, or other transportation routes. The route provides movement, access to markets, water, or transportation, while the settlement’s narrow shape reflects the directional constraint of that feature. A row of farms beside a river is therefore linear even if the individual farmsteads are widely spaced.
Survey systems: the geometry of ownership
A settlement pattern tells you where people live; a survey system tells you how parcels were measured and bounded. Three systems are especially important: metes-and-bounds, township-and-range, and long lot.
Metes-and-bounds surveying uses physical features, distances, and directions to define irregular parcels. A boundary might follow a stream, then run a specified distance north, turn toward a large oak tree, and continue along a ridge. Because the boundaries follow local landmarks rather than a universal grid, parcels often have uneven shapes.
The township-and-range system organizes land into a rectangular grid. A large area is divided into townships, and each township is divided into regularly shaped sections. This creates a landscape of straight roads, right-angle property lines, and rectangular fields—an immediately recognizable visual signature.
The long-lot system divides land into narrow, elongated parcels. These parcels commonly extend from a settlement or transportation route to a waterway, giving each household access to both movement and water. On a map, long lots appear as thin strips running perpendicular to a river, road, or coast.
Worked visual analysis
Suppose a map shows thirty farmhouses concentrated around a small church, with fields radiating outward. A second map shows isolated farmsteads surrounded by separate fields. A third shows narrow parcels stretching from a road back to a river.
Step 1 — Identify the settlement pattern. The first map is clustered because buildings gather around a central place. The second is dispersed because farmsteads are spread across the landscape. The third is likely linear if the buildings follow the road or river.
Step 2 — Identify the survey system. If the first map contains irregular boundaries following streams and hills, it suggests metes-and-bounds. If the second contains a regular checkerboard of rectangles, it suggests township-and-range. If the third contains narrow strips running between a route and waterway, it suggests the long-lot system.
Step 3 — Explain the relationship. Do not stop at naming the pattern. Connect it to resources and cultural practices: water access can produce long lots; large farms and mechanized agriculture can encourage dispersed settlement; shared services or traditional village organization can support clustered settlement.
Misconception check
Common misconception: “Settlement pattern and survey system mean the same thing.”
They do not. A clustered settlement may exist on irregular metes-and-bounds parcels, and a dispersed settlement may occur within a rectangular township-and-range grid. Settlement pattern concerns the distribution of buildings; surveying concerns the shape and organization of land parcels.
AP skill in action
Suggested Skill 4.D — Source Analysis: Compare patterns and trends in visual sources to draw conclusions. On an exam, compare visual evidence before explaining it. Look for clustering, spacing, alignment, parcel shape, straight versus irregular boundaries, and the physical feature—if any—that organizes the landscape. Then draw a conclusion supported by both the observed pattern and a geographic cause.
Retrieval check: A map shows houses in a compact group, irregular property boundaries following streams, and fields surrounding the village. Identify the settlement pattern and survey system, then give one resource or cultural factor that could help explain the arrangement.
Answer: The settlement is clustered because the buildings are grouped around a central area. The survey system is metes-and-bounds because boundaries follow physical features and form irregular parcels. Shared services, community traditions, or access to a common water source could help explain the pattern.
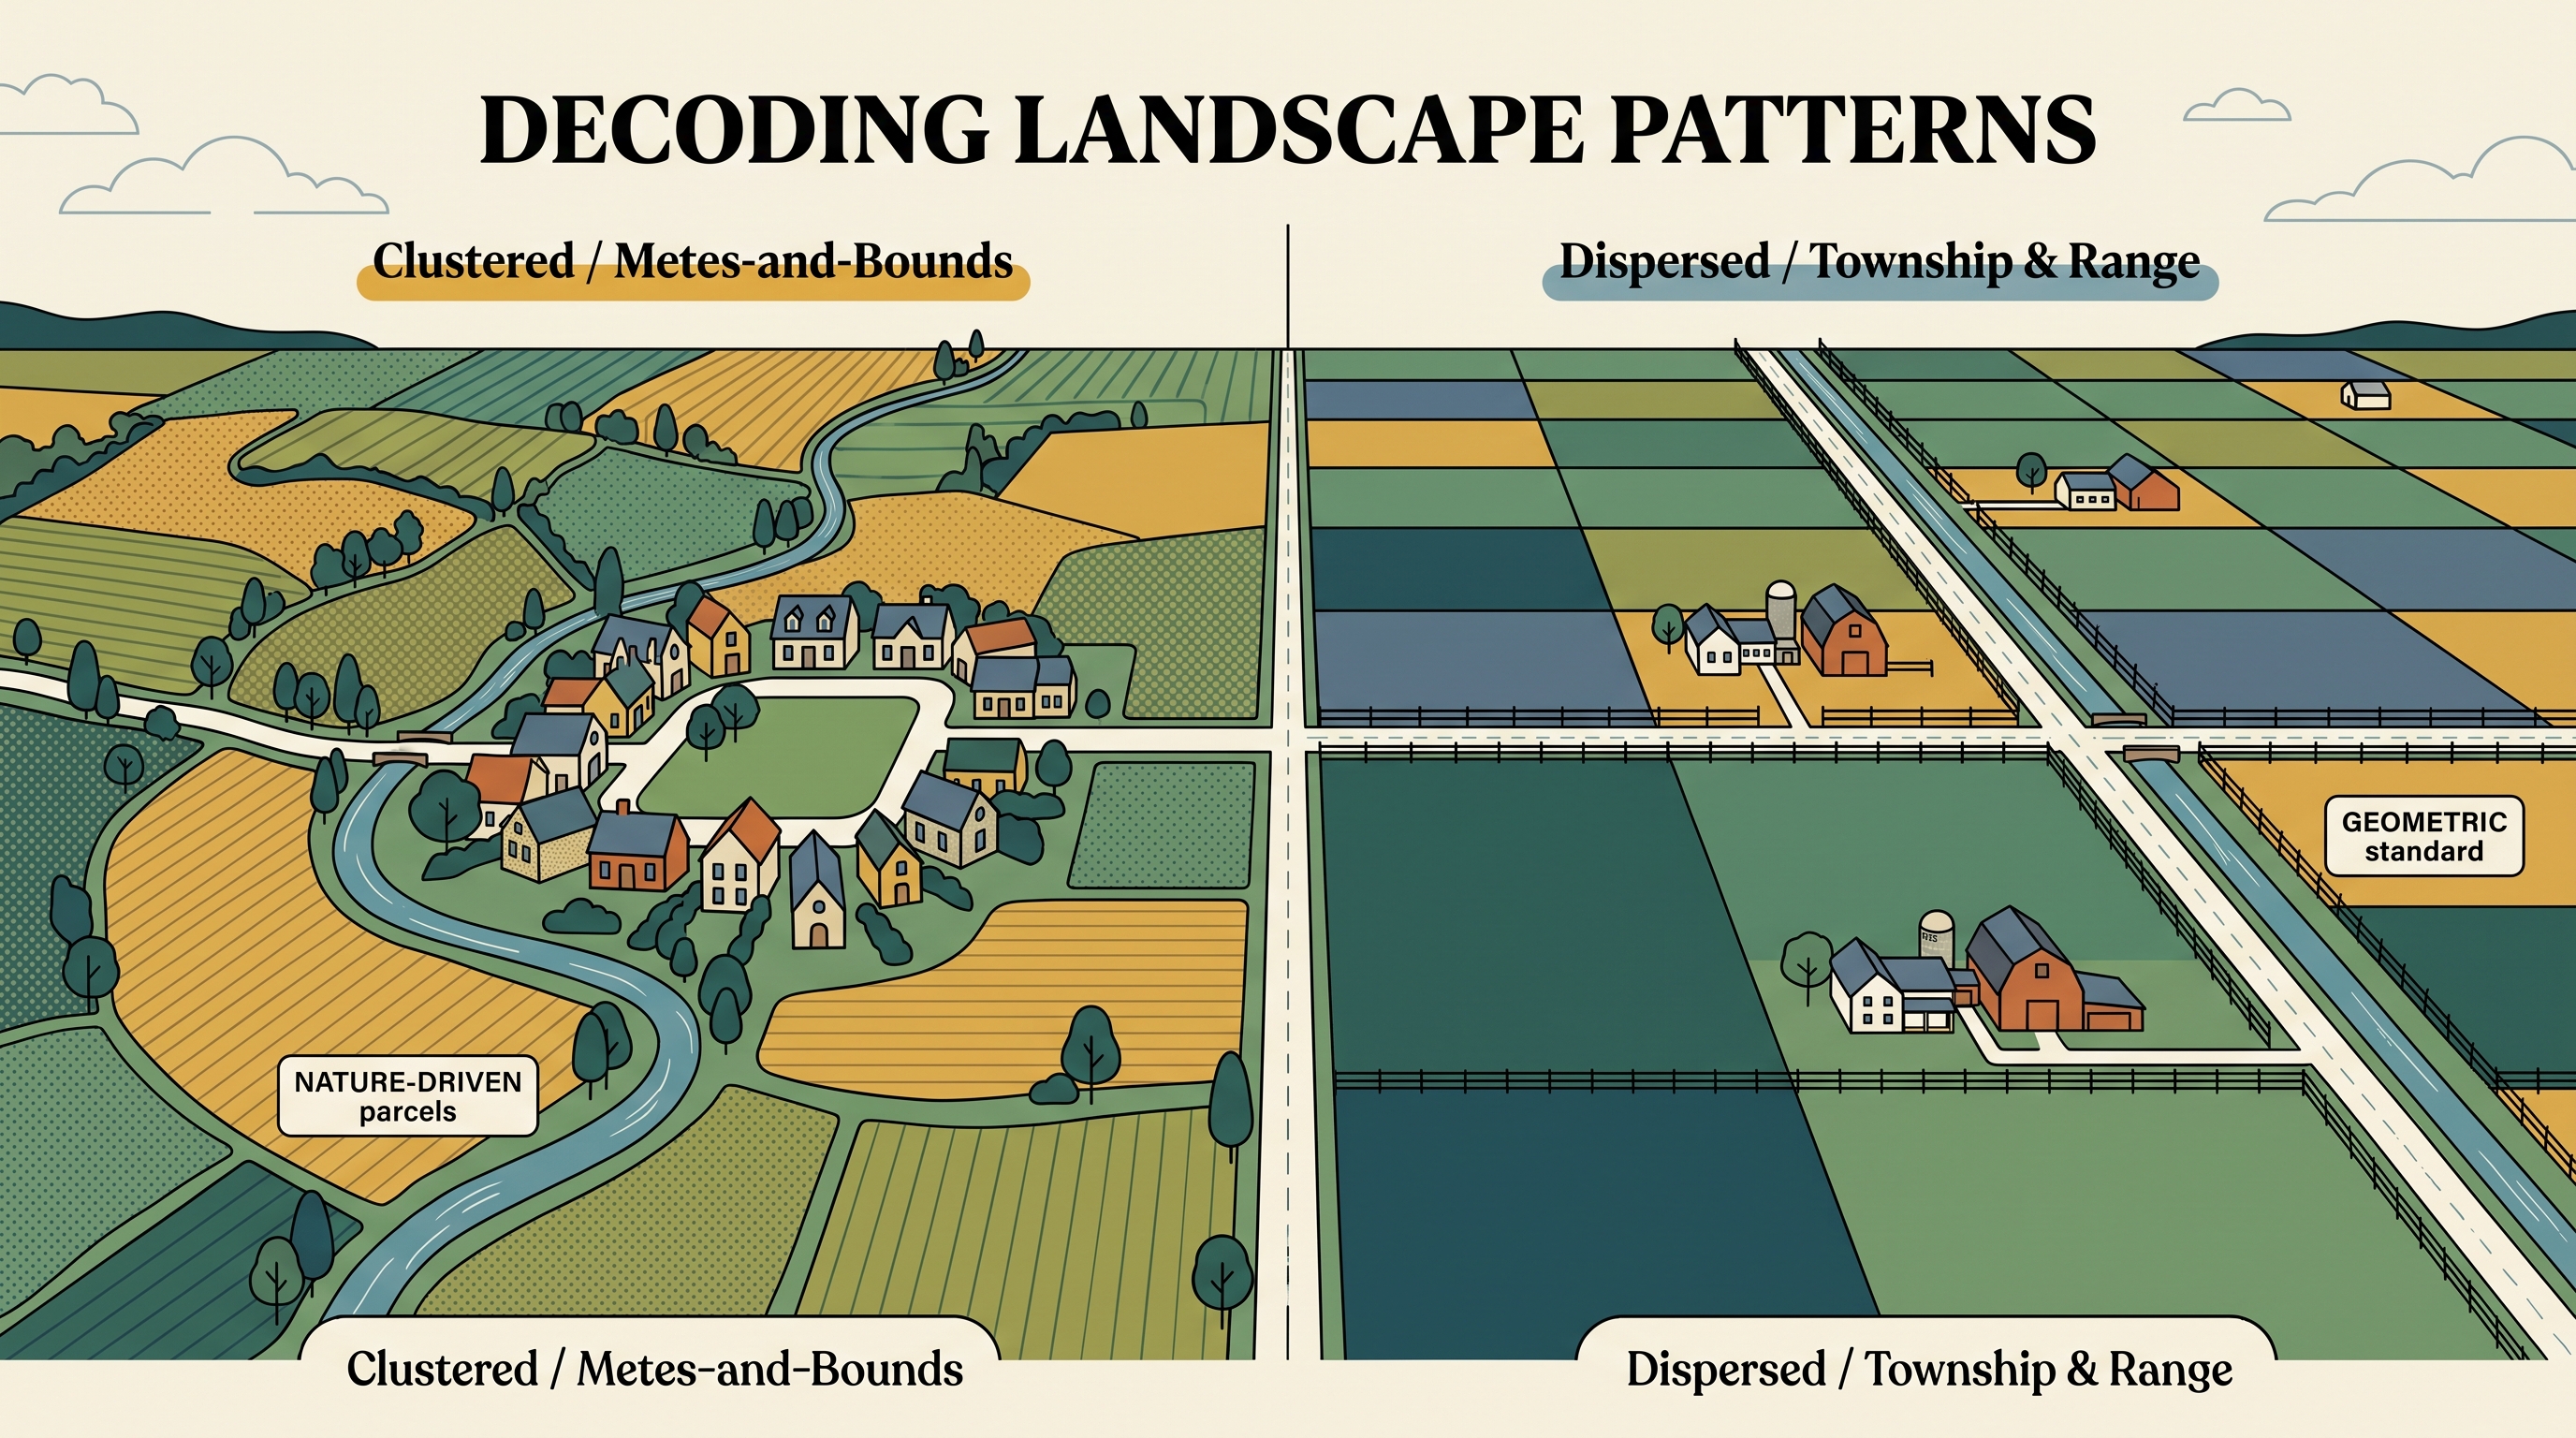
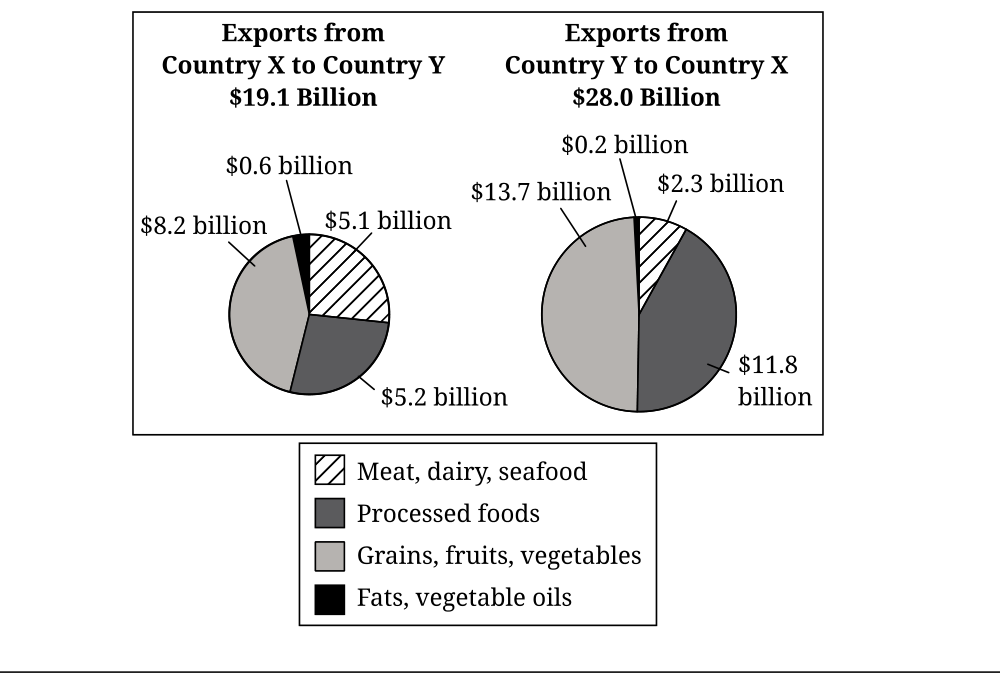
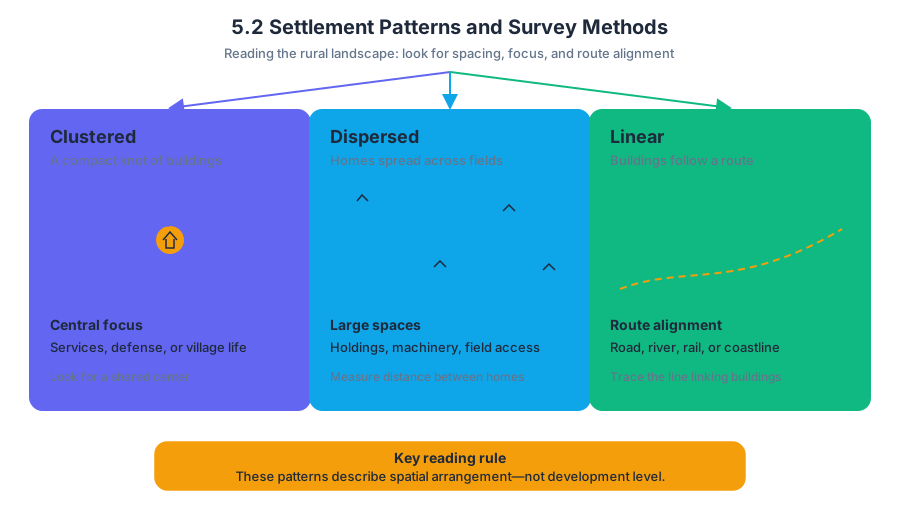
5.3 Agricultural Origins and Diffusions
Key concepts: Agricultural origins and diffusions · Agriculture and rural land-use patterns and processes · Interdependence among agricultural production regions · Comparative advantage · Trade relationships · Global food distribution networks · Types of diffusion · Source analysis
A crop’s birthplace and its modern center of production are often thousands of kilometers apart. Maize originated in Mesoamerica, yet it is now grown extensively across the United States, China, Brazil, and many other regions because domesticated species spread through cultural diffusion—the movement of ideas,…
5.3 Agricultural Origins and Diffusions
A crop’s birthplace and its modern center of production are often thousands of kilometers apart. Maize originated in Mesoamerica, yet it is now grown extensively across the United States, China, Brazil, and many other regions because domesticated species spread through cultural diffusion—the movement of ideas, practices, plants, animals, and technologies from one place to another.
SPS-5: Agriculture has changed over time because of cultural diffusion and advances in technology.
Major centers of domestication
A hearth of domestication is a major region where humans first selectively bred wild plants or animals for useful traits. Domestication is not simply “finding” a plant; it is a long process in which repeated human selection changes a species so that it becomes more productive, predictable, or manageable.
| Major domestication hearth | Representative domesticated plants or animals |
|---|---|
| Southwest Asia | Wheat, barley, lentils, sheep, goats |
| East Asia | Millets, rice, soybeans, pigs |
| South Asia | Rice, cotton, cattle |
| Mesoamerica | Maize, beans, squash, turkeys |
| The Andes | Potatoes, quinoa, llamas, alpacas |
| Sub-Saharan Africa | Sorghum, pearl millet, African rice, yams |
These hearths developed where environmental conditions and human experimentation made domestication possible. Once domesticated, species could be carried into new regions, exchanged through trade, or adopted by neighboring societies. The original hearth therefore remained historically important even when another region later became the dominant producer.
From hearth to global crop
The SPS-5.A learning objective requires identifying major centers of domestication, while SPS-5.B requires explaining how plants and animals diffused globally. Two diffusion processes are especially important:
- Relocation diffusion occurs when people physically carry a crop, animal, or agricultural practice to a new location. Migrants, traders, soldiers, and colonists can all transport domesticated species.
- Expansion diffusion occurs when an agricultural practice or species spreads outward from its source while remaining strong in the source region. Neighboring farmers may adopt a crop through interaction, observation, or economic pressure.
For example, pigs domesticated in East Asia did not remain confined to that hearth. Their movement with migrating and trading populations demonstrates relocation diffusion; their subsequent adoption by nearby communities can produce expansion diffusion. When interpreting a map, do not merely say that pigs “spread.” Identify the source hearth, describe the spatial pattern, and connect the pattern to a diffusion process.
Exam-ready chain: hearth of domestication → movement or adoption → new production region → visible spatial pattern.
Why agricultural regions become interdependent
Interdependence means that places rely on one another because no region efficiently produces everything it needs. Agricultural interdependence develops when regions differ in climate, soils, water availability, labor costs, technology, land, capital, or consumer demand.
A region has a comparative advantage when it can produce a particular good at a lower opportunity cost than another region. Comparative advantage does not mean that a place is absolutely best at producing everything; it means that specializing in certain goods and trading for others can benefit both regions.
Worked example: Suppose Region A has a cool, wet climate suited to wheat, while Region B has a warm climate suited to coffee. Region A specializes in wheat and exports its surplus to Region B. Region B specializes in coffee and exports coffee to Region A. Even if both regions grow small amounts of both crops, climate-based specialization makes them mutually dependent on trade.
Trade relationships connect agricultural production regions to consumers, processors, ports, financial institutions, and one another. A crop may be grown in one country, processed in a second, packaged in a third, and sold in a fourth. This creates a global food distribution network: a linked system of farms, transportation routes, storage facilities, markets, and consumers.
The network increases interdependence because a disruption in one location can affect distant places. A drought can reduce exports, a port closure can delay shipments, and a rise in fertilizer prices can increase food costs far from the farm. At the same time, global networks can improve food access by allowing regions to obtain products that local environments cannot support year-round.
Source analysis: reading agricultural maps
Skill 4.C: Source Analysis asks students to explain the significance of geographic information in a source. For a map showing agricultural production, use a three-step method:
- Describe the pattern precisely: identify clusters, gaps, gradients, or regional contrasts.
- Locate the likely production hearths, environmental conditions, or economic centers.
- Explain the pattern through domestication, diffusion, comparative advantage, trade, or distribution networks.
A strong response distinguishes description from explanation. “High production occurs in eastern and southern regions” describes a pattern; “those regions may have suitable climates, established livestock traditions, and access to markets” explains it. Avoid assuming that high production means high consumption or that a crop’s current location is its origin.
Common misconception — origin equals dominance: A domestication hearth is where a species was first developed, not necessarily where it is most widely produced today.
Retrieval check
A map shows a crop concentrated far from its known domestication hearth. What evidence would support the claim that relocation diffusion created the pattern, and how could comparative advantage make the new production region interdependent with other regions? A complete answer should name the hearth, identify the movement of the crop or farming population, describe the mapped pattern, and explain what the region exports and imports.
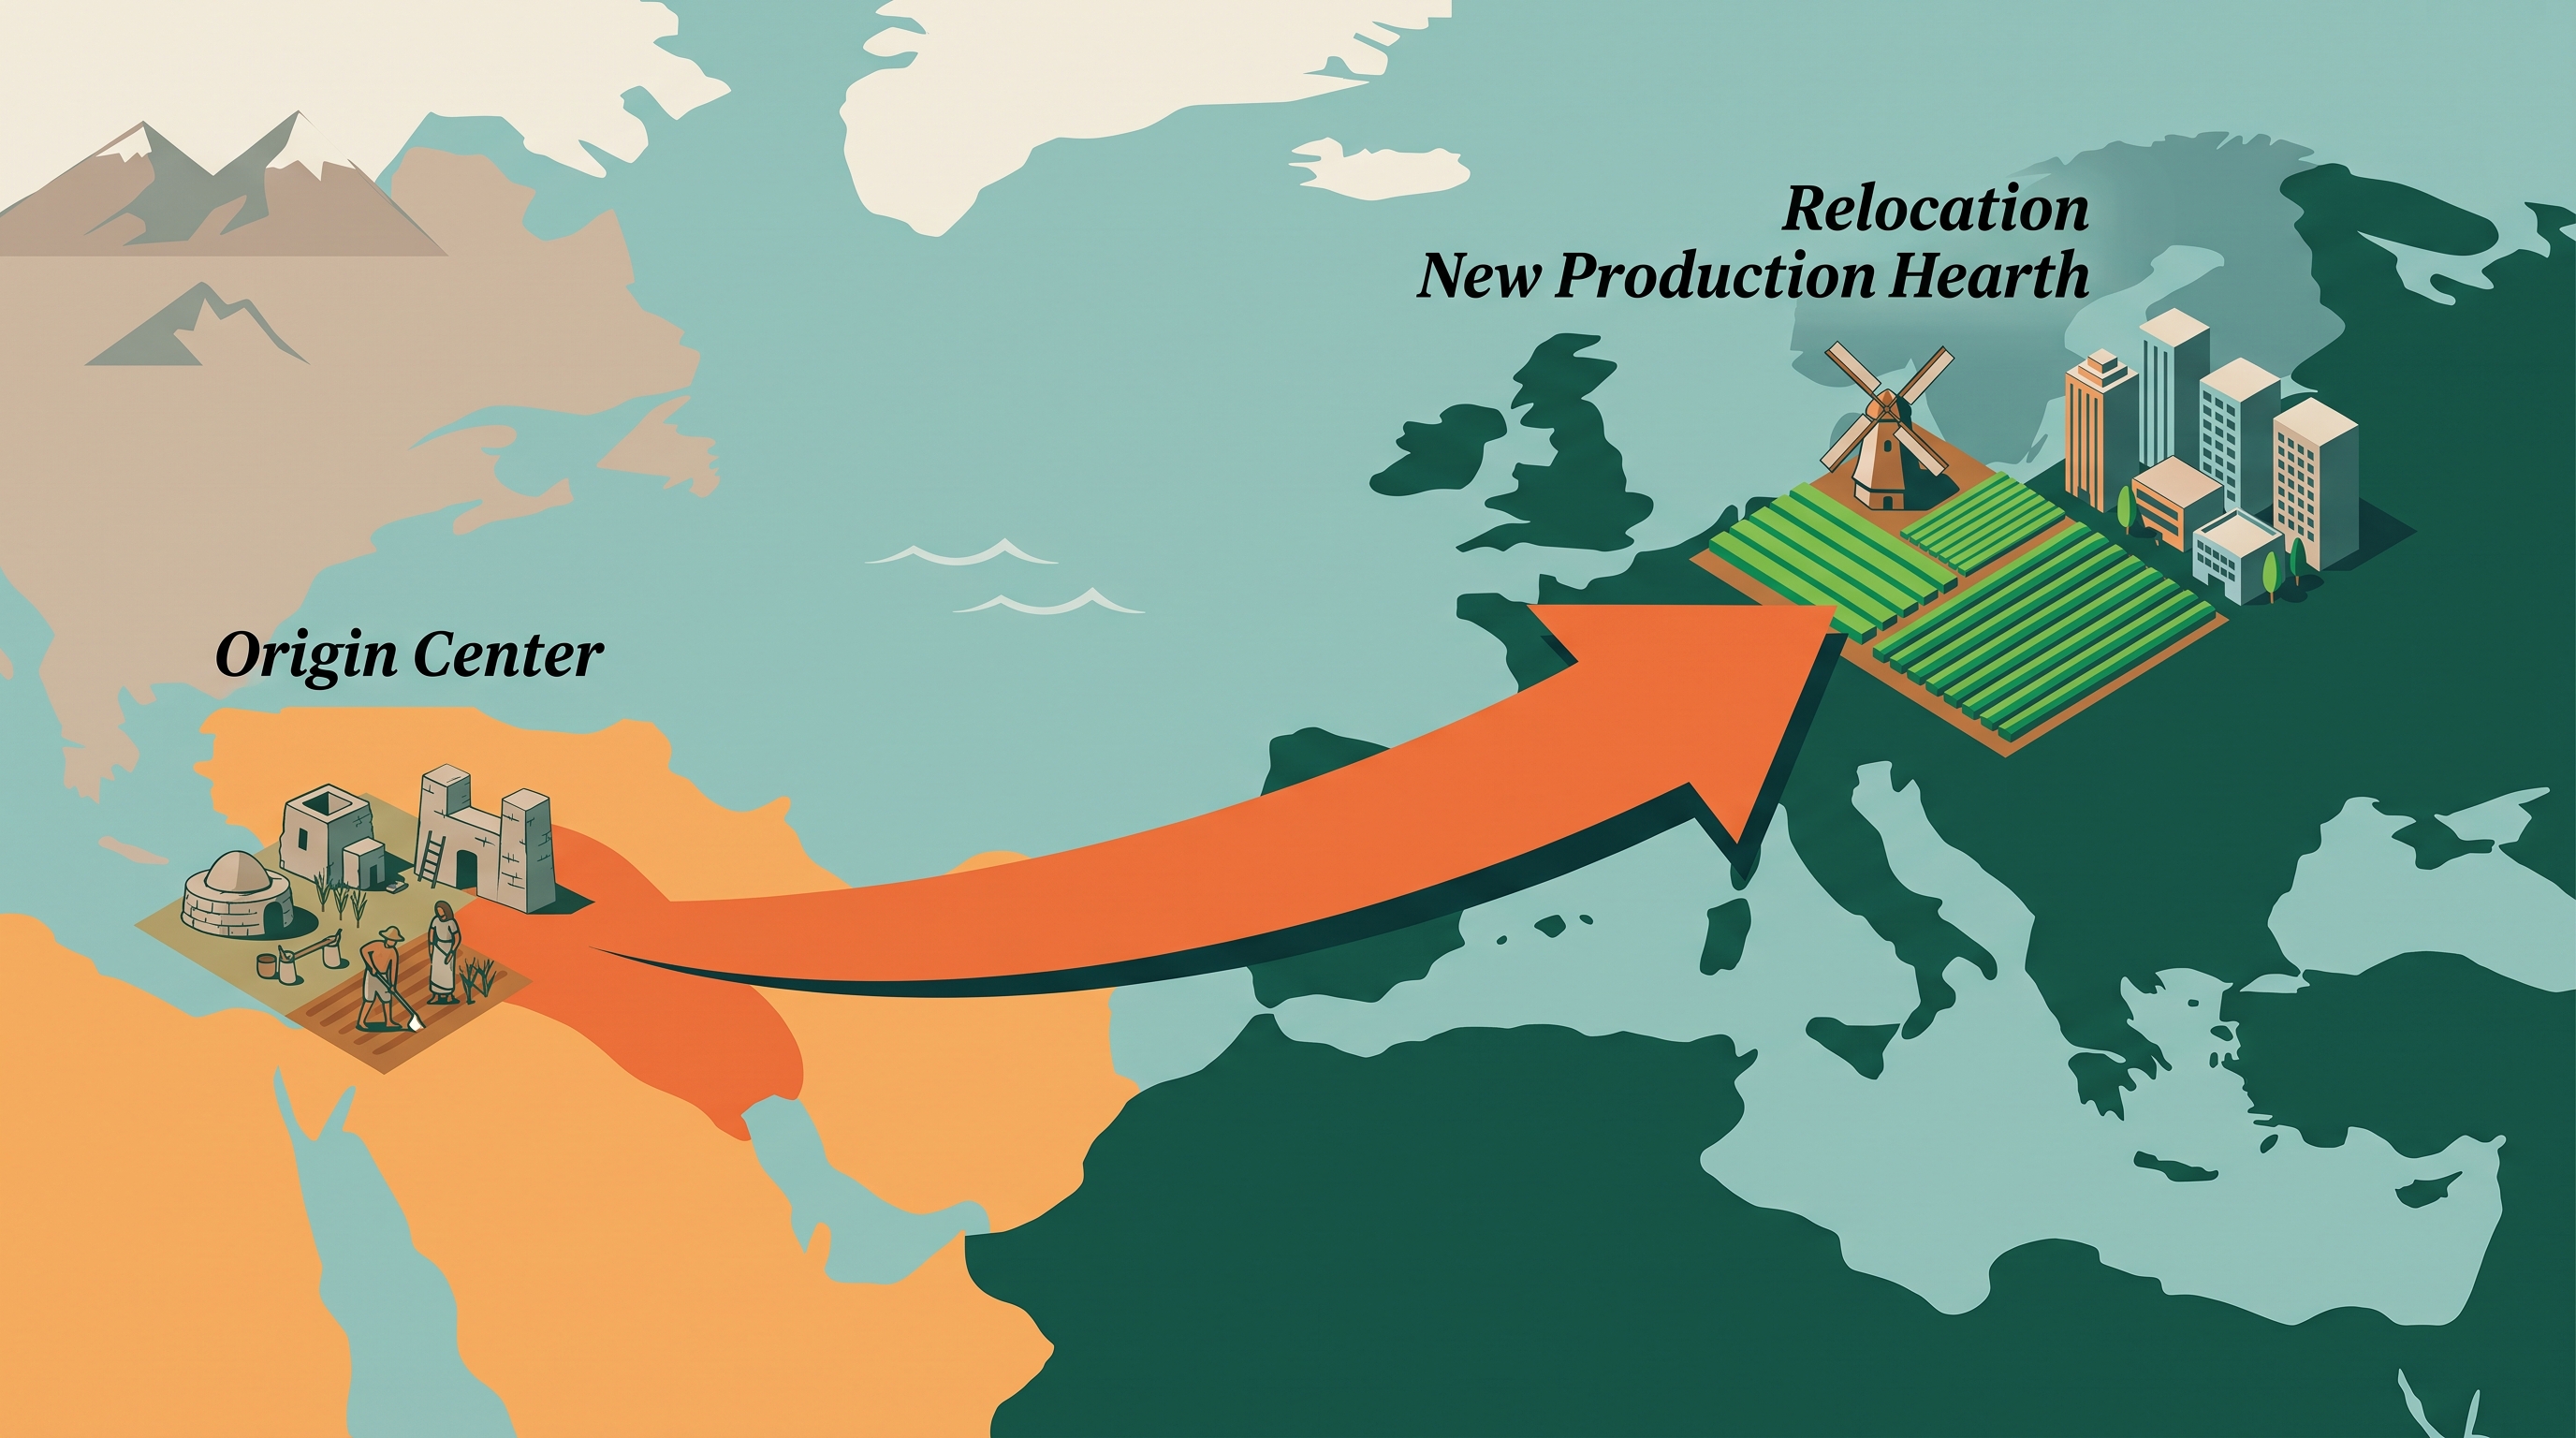
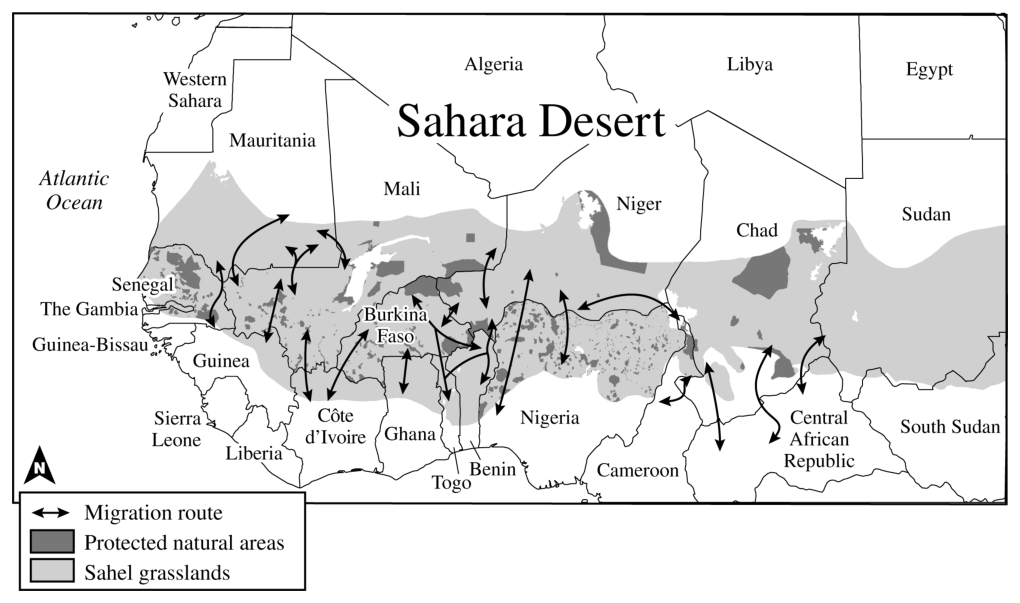
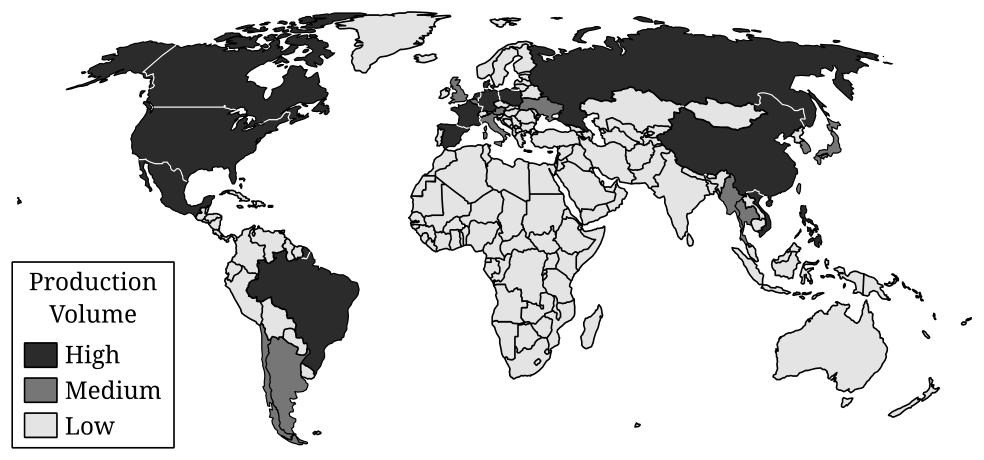
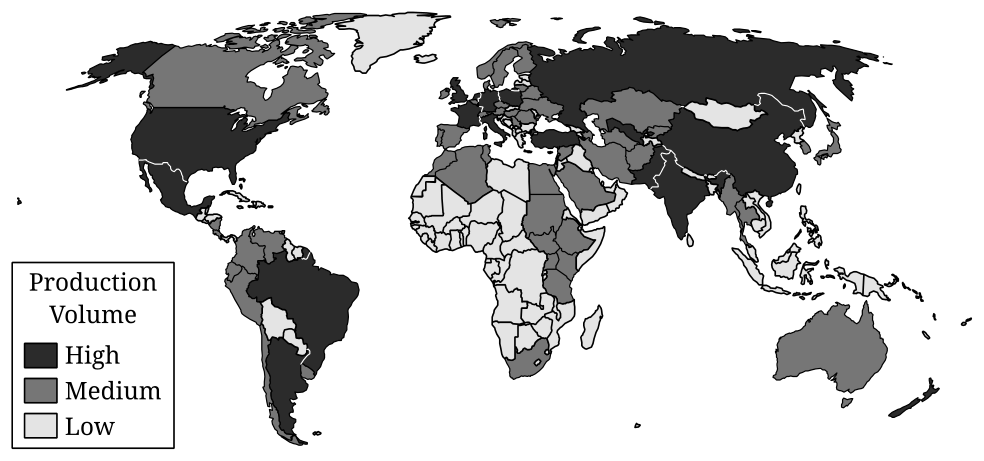
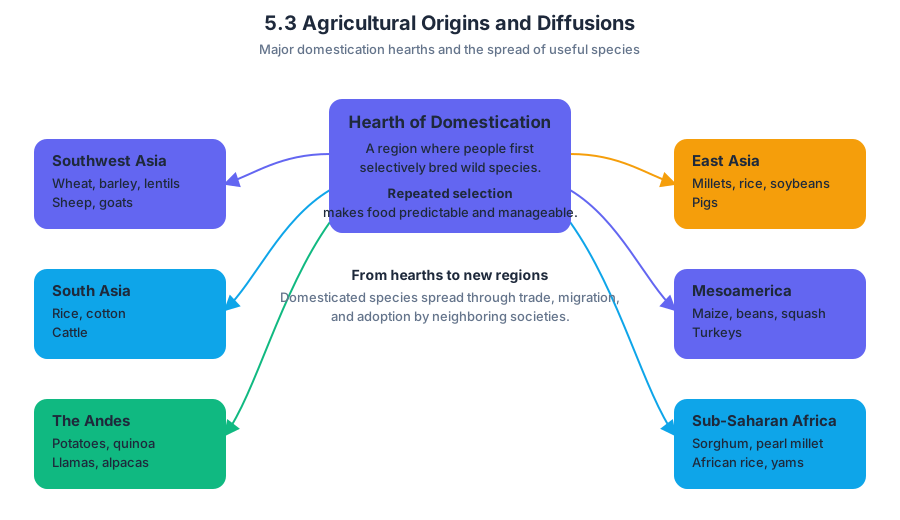
5.4 The Second Agricultural Revolution
Key concepts: Second Agricultural Revolution · Agricultural technological advancements · Impacts of technological change on agricultural practices · Carrying capacity of land · Green Revolution · High-yield seeds · Agricultural chemicals · Mechanized farming · Food supply in the developing world · Environmental consequences of the Green Revolution
A farm’s carrying capacity is not fixed: when people improve tools, seeds, transportation, or land management, the same area can support a larger population. The Second Agricultural Revolution was the major period of agricultural technological advancement that increased productivity and transformed farming…
5.4 The Second Agricultural Revolution
A farm’s carrying capacity is not fixed: when people improve tools, seeds, transportation, or land management, the same area can support a larger population. The Second Agricultural Revolution was the major period of agricultural technological advancement that increased productivity and transformed farming practices, especially in Europe and later in other regions.
Learning Objective SPS-5.C: Explain how advances in agricultural technology may increase the carrying capacity of land.
From more land to more output
Carrying capacity means the largest population that a particular environment can support sustainably with the resources and technology available at a given time. Agricultural technology can raise carrying capacity by increasing the amount of food produced per unit of land, reducing losses, or making previously difficult land productive.
A simple chain shows the mechanism:
$$ \text{Technology} \rightarrow \text{higher yield or fewer losses} \rightarrow \text{greater food supply} \rightarrow \text{higher carrying capacity} $$
For example, suppose a farming region produces $2$ metric tons of wheat per hectare and supports a population using $1{,}000$ hectares. If improved drainage, crop rotation, and better tools raise production to $3$ metric tons per hectare, the region can produce $50%$ more food without expanding its cultivated area:
$$ \frac{3-2}{2}\times 100 = 50% $$
That increase does not automatically mean that population must grow, or that the environment can support the change forever. It means that, under the new technological conditions, the land has a greater potential food-producing capacity.
What changed during the Second Agricultural Revolution?
The Second Agricultural Revolution refers to a period of technological advancements that changed agricultural practices and increased agricultural productivity. It is associated especially with innovations such as improved tools and machinery, more systematic crop rotation, selective breeding, drainage, enclosure, and improved transportation connecting farms to markets.
These changes worked together rather than acting as isolated inventions. Better machinery allowed farmers to cultivate more land or complete tasks faster; crop rotation helped maintain soil fertility; drainage opened some wet areas to cultivation; selective breeding improved livestock and crops; and transportation made it easier to move agricultural products to urban consumers.
Positive impacts—and the trade-off
The central positive impact was increased agricultural productivity, meaning more output from a given quantity of land, labor, or time. Larger and more reliable food supplies supported population growth, helped supply expanding cities, encouraged commercial agriculture, and reduced the likelihood that a local harvest failure would immediately produce famine when transportation and markets could bring food from elsewhere.
Technological change could also release labor from agriculture. If machines performed tasks that once required many workers, some people could seek employment in manufacturing, transportation, or services. This helped connect agricultural change to industrialization and urbanization.
Why intensification can damage the environment
Agricultural intensification means producing more food through greater inputs or more intensive use of land. Although intensification can increase short-term yields, it may also create environmental costs: soil exhaustion, erosion, habitat loss, water depletion, and pollution from agricultural chemicals or runoff.
The key geographic relationship is conditional:
| Agricultural change | Possible productivity gain | Possible environmental cost |
|---|---|---|
| More irrigation | Reliable water during dry periods | Aquifer depletion or soil salinization |
| More machinery | Faster planting and harvesting | Fuel use, soil compaction, and pollution |
| Greater chemical use | More rapid plant growth or pest control | Water contamination and loss of soil organisms |
| Expanded cultivation | More land in production | Habitat destruction and erosion |
Misconception check — “Higher carrying capacity means unlimited growth.” A technological increase in carrying capacity is not a permanent escape from environmental limits. If farming degrades soil or exhausts water, the land’s future carrying capacity may decline even while current production rises.
Do not confuse SPS-5.C with SPS-5.D
SPS-5.C centers on the Second Agricultural Revolution and the mechanism by which agricultural technology increased productivity and the carrying capacity of land. SPS-5.D, the Green Revolution topic, focuses on a later technological shift—especially high-yield seeds, increased chemical use, and mechanized farming—and its consequences for food supply and the environment in the developing world.
The Green Revolution therefore connects to this topic but should not replace it. Its technologies included high-yield seeds, chemicals, irrigation, and mechanization; the detailed consequences of that later transformation belong to the next topic.
AP geographic reasoning
This topic most directly uses Skill 1.C: Explain geographic concepts, processes, and patterns, because a strong response explains how technology changes production and carrying capacity rather than merely naming an invention. It also uses Skill 2.B: Explain spatial patterns, Skill 3.C: Explain patterns and trends in geographic data, and Skill 5.C: Explain how the scale of analysis affects geographic understanding when comparing technological impacts across places or time periods.
Retrieval check: A region adopts improved drainage and crop rotation, increasing food production without expanding farmland. Which concept explains the change, and what is one possible long-term environmental risk if intensification is poorly managed?
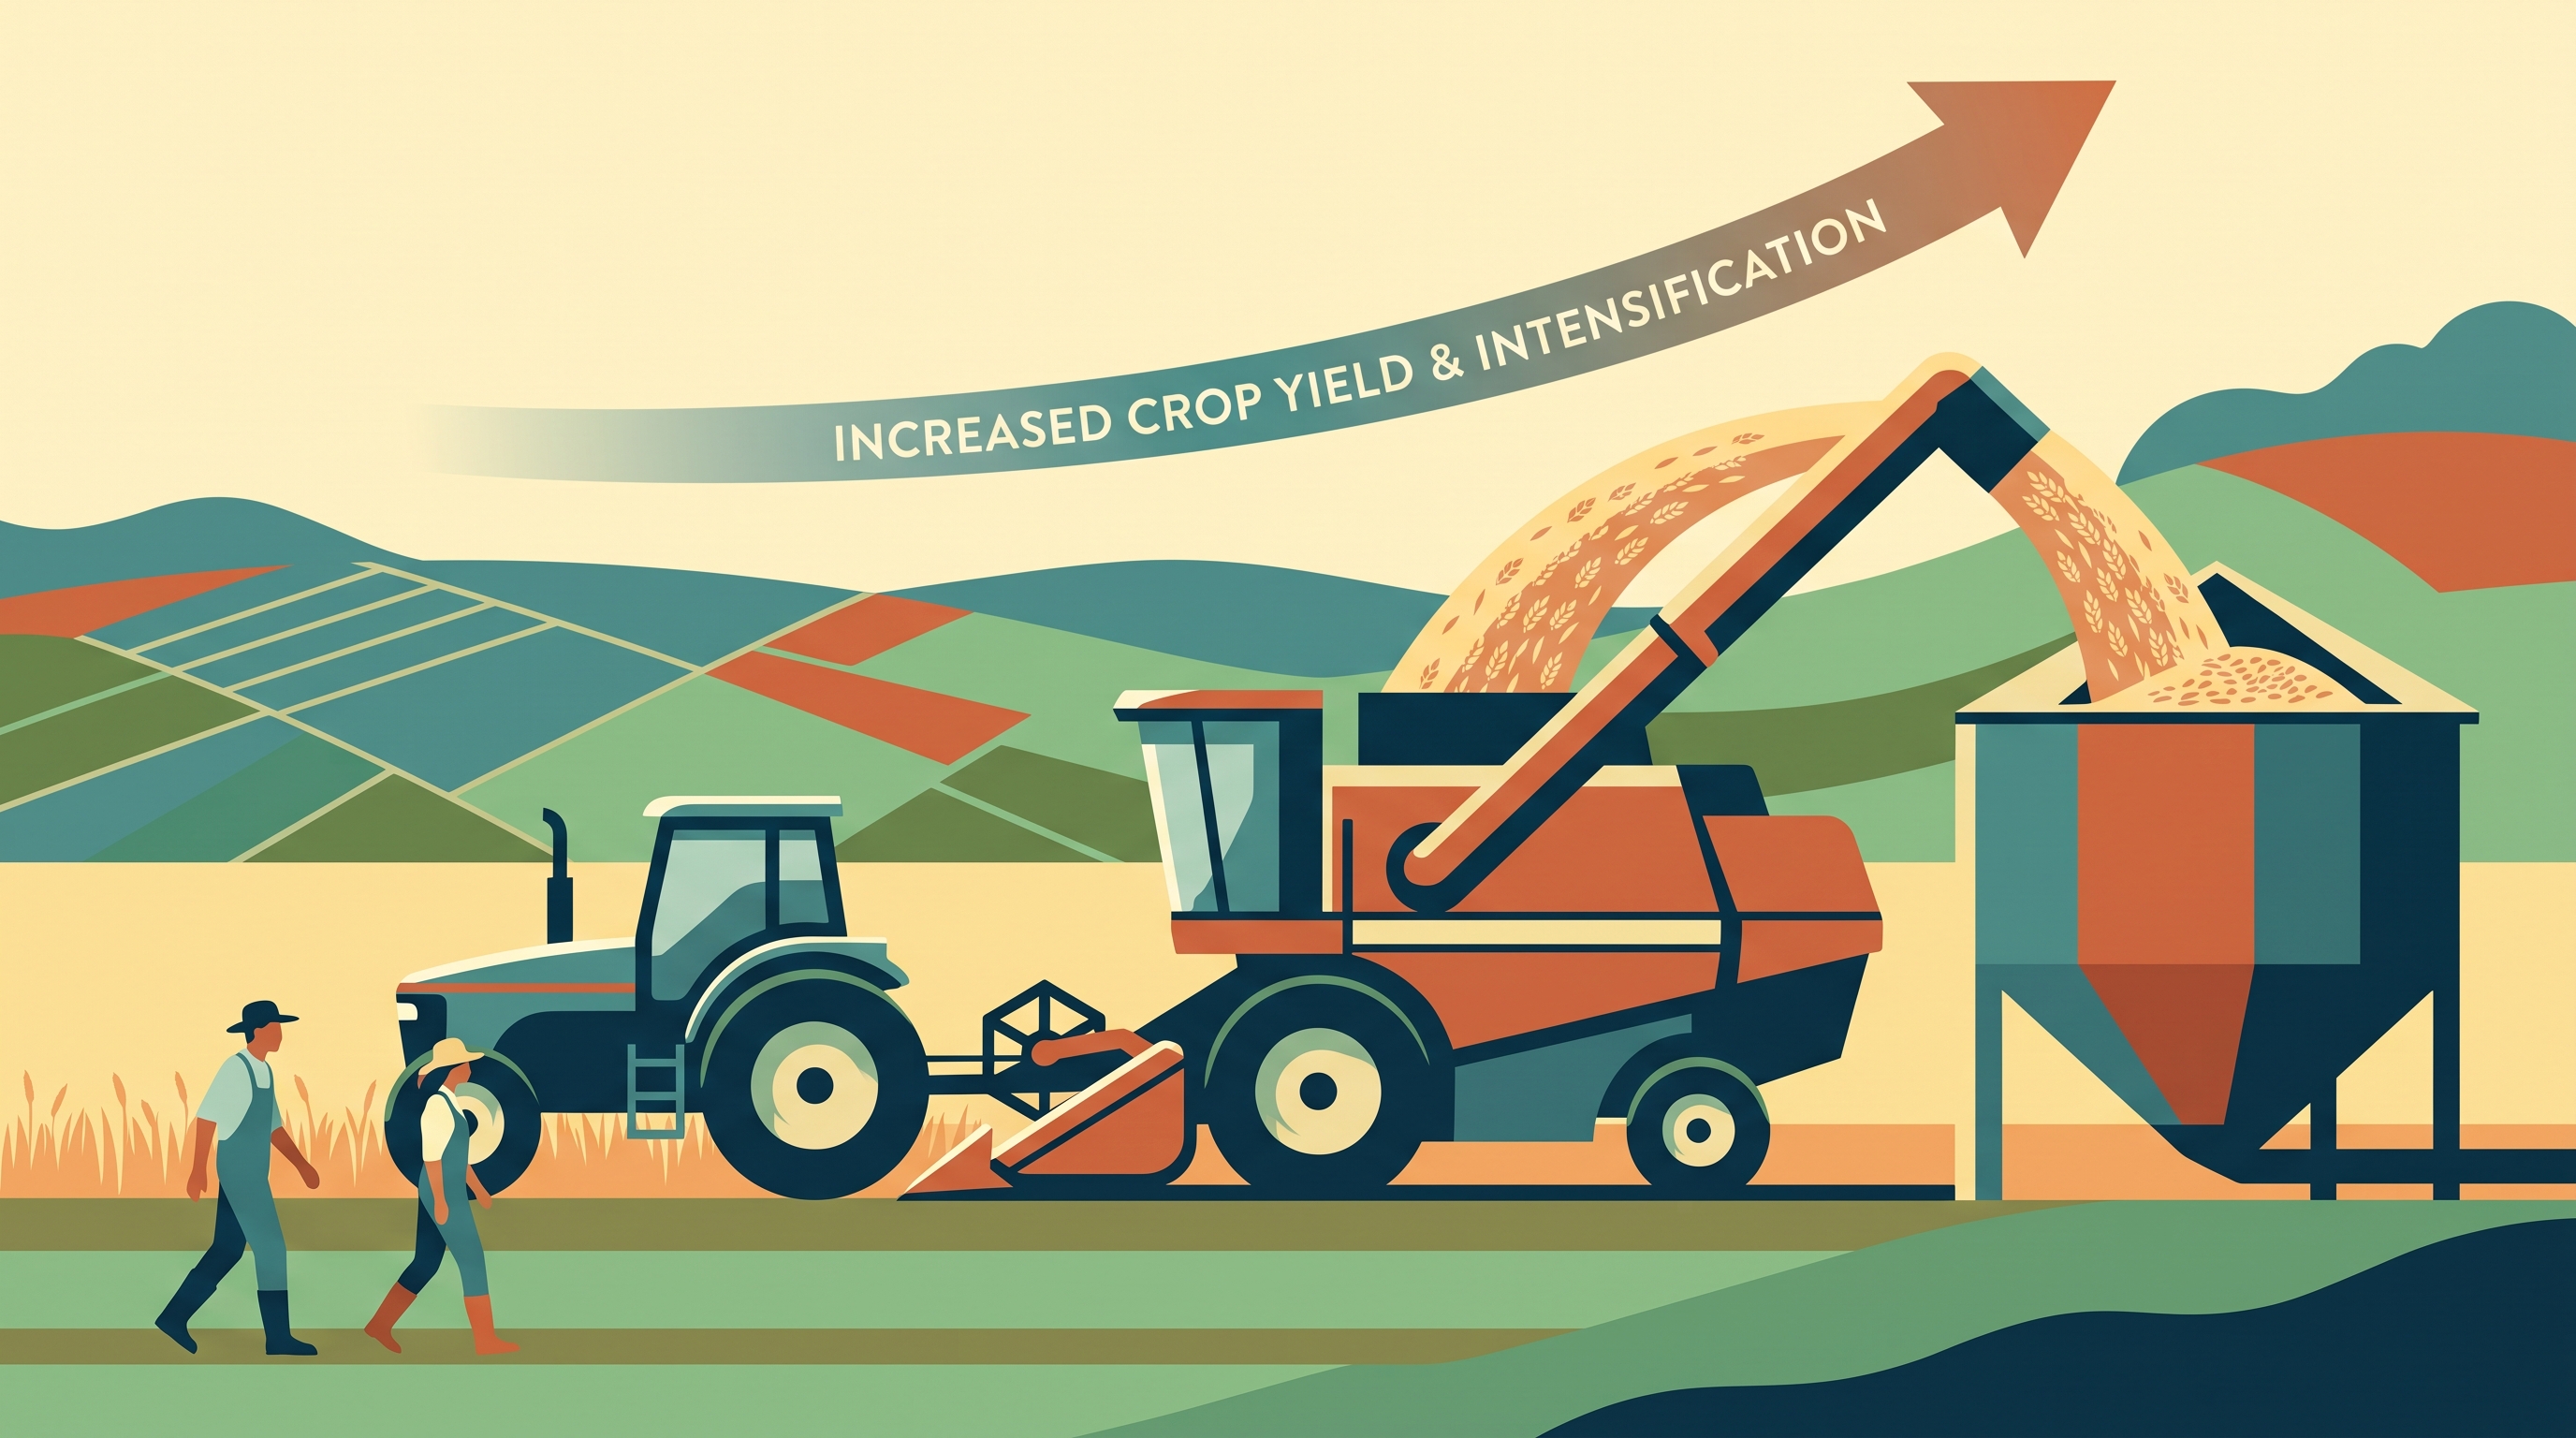
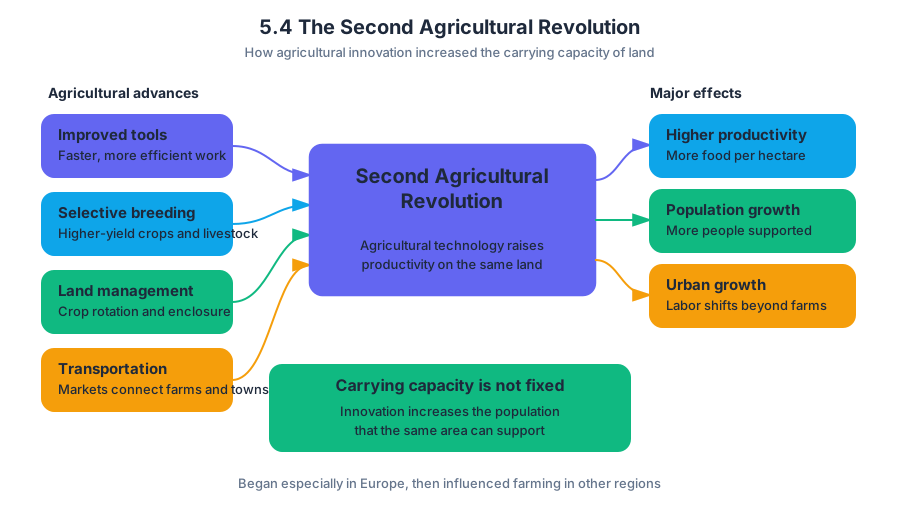
5.5 The Green Revolution
Key concepts: Green Revolution · Cultural diffusion · Agricultural technology · Comparative advantage · Carrying capacity · Food supply and food security · Malthusian theory · Agricultural specialization and monocropping
The Green Revolution transformed agriculture by combining new biological, chemical, water-management, and mechanical technologies to raise crop productivity. Its central geographic question is not simply “Did food production increase?” but rather: How did higher productivity change population support, trade, rural…
5.5 The Green Revolution
The Green Revolution transformed agriculture by combining new biological, chemical, water-management, and mechanical technologies to raise crop productivity. Its central geographic question is not simply “Did food production increase?” but rather: How did higher productivity change population support, trade, rural communities, and environmental sustainability?
CED alignment: Learning Objective 5.5.A — Explain the consequences of the Green Revolution. This topic draws especially on Essential Knowledge 5.5.A.1, the use of high-yield seeds and agricultural inputs; Essential Knowledge 5.5.A.2, increased agricultural productivity and food supplies in developing countries; and Essential Knowledge 5.5.A.3, the economic, social, and environmental consequences of intensive agricultural production.
A technology package, not one invention
The Green Revolution spread through cultural diffusion, meaning the movement of an idea, practice, or technology from one place to another. Governments, scientists, agricultural institutions, and farmers adapted technologies developed in one region to local farming systems in developing countries.
Its technologies commonly include:
- High-yield seeds, bred to produce more grain under favorable conditions
- Irrigation, which supplies water when rainfall is insufficient or unreliable
- Fertilizers, which add nutrients such as nitrogen, phosphorus, and potassium
- Pesticides and herbicides, which reduce crop losses from insects, weeds, and disease
- Mechanization, using machines for planting, harvesting, processing, and transportation
These technologies work as a package. A high-yield seed may produce little additional food without adequate water and nutrients; irrigation may be less effective if farmers lack fertilizer, machinery, or access to markets. The result was a major increase in food supplies in many developing countries.
Carrying capacity and food security
Carrying capacity is the largest population that a particular environment can support indefinitely with available resources and technology. Agricultural technology can increase the carrying capacity of land by raising productivity: if the same area produces a larger and more reliable food surplus, it can support more people.
Food security means reliable physical and economic access to sufficient, safe, nutritious food. The Green Revolution generally increased the potential supply of food, but higher production did not automatically guarantee equal access. Poverty, conflict, unequal landownership, transportation problems, and market prices can leave people food insecure even when a country produces substantial food.
Worked example: from technology to carrying capacity
Suppose a farming region previously harvested $2$ metric tons of grain per hectare and could support $10{,}000$ residents through local production. Improved seeds, irrigation, and fertilizer raise productivity to $4$ metric tons per hectare. If population demand remains similar per person, the region now has approximately twice as much food-producing capacity.
The geographic chain of reasoning is:
- Agricultural technology raises yield per hectare.
- Total food production increases.
- A larger surplus becomes available for consumption, storage, or trade.
- The land can support a larger population, so its carrying capacity increases.
- The surplus may also connect the region to national or global markets.
Misconception check — “Carrying capacity is a permanent physical limit.” Carrying capacity is not fixed solely by soil and climate. Technology, infrastructure, management practices, and resource availability can raise or lower it; however, a technological increase may be temporary if it damages the soil or depletes water supplies.
Comparative advantage and agricultural trade
Comparative advantage is the ability of an individual, business, or country to produce a good or service more efficiently or at a lower opportunity cost than another producer. Opportunity cost is what must be given up to produce one additional unit of something else.
A country does not need to be the best at producing every product to benefit from trade. Countries may specialize in products they can produce most efficiently, then trade for other goods. Green Revolution technologies can create larger surpluses, allowing a country to export crops or redirect land and labor toward other products.
For example, if Country X can produce meat, dairy, and seafood relatively efficiently while Country Y produces grains, fruits, and vegetables at a lower opportunity cost, both countries may specialize and exchange products. Export data can reveal interdependence, but exports between only two countries do not by themselves measure a country’s entire level of economic development.
Costs of intensive production
The same practices that increase yields can create long-term problems. Monocropping, the cultivation of one crop over a large area, can reduce crop diversity and make farms more vulnerable to pests, disease, and market price changes. Heavy fertilizer and pesticide use can degrade soil and contaminate water, while irrigation can contribute to salinization or groundwater depletion.
Mechanization and economies of scale can also contribute to a decline in small farms. Large commercial farms may afford machinery, improved seeds, irrigation systems, and chemical inputs more easily than smallholders. As production becomes more specialized, the types of food produced may shift from diverse local crops toward export crops or a narrower set of high-yield commodities.
Key tension: The Green Revolution can increase short-term food supply and carrying capacity while reducing soil fertility, crop diversity, and long-term sustainability if inputs are poorly managed.
AP skills in action
This topic most directly develops Skill Category 1: Concepts and Processes, especially 1.A Identify geographic concepts, 1.B Describe geographic concepts, and 1.C Explain geographic concepts. A strong response defines carrying capacity or comparative advantage accurately and then connects the definition to a specific agricultural process.
It also develops Skill Category 2: Spatial Relationships, especially 2.A Describe spatial patterns, 2.B Explain spatial patterns, and 2.C Explain spatial relationships; Skill Category 3: Data Analysis, especially 3.A Identify types of data, 3.B Describe spatial patterns, and 3.C Explain patterns and trends; and Skill Category 5: Scale Analysis, especially 5.A Identify scales of analysis and 5.B Explain scales of analysis. For example, a response might connect a farm-level technology to national food supplies and then to global trade.
Retrieval check
A region adopts high-yield seeds, irrigation, fertilizer, and mechanized harvesting. State one effect on carrying capacity, one possible environmental cost, and one reason the region might become more connected to global markets. The strongest answer uses a causal chain: higher yields increase food surplus and potential carrying capacity; intensive inputs may reduce soil fertility or crop diversity; and surplus production can support specialization and trade.
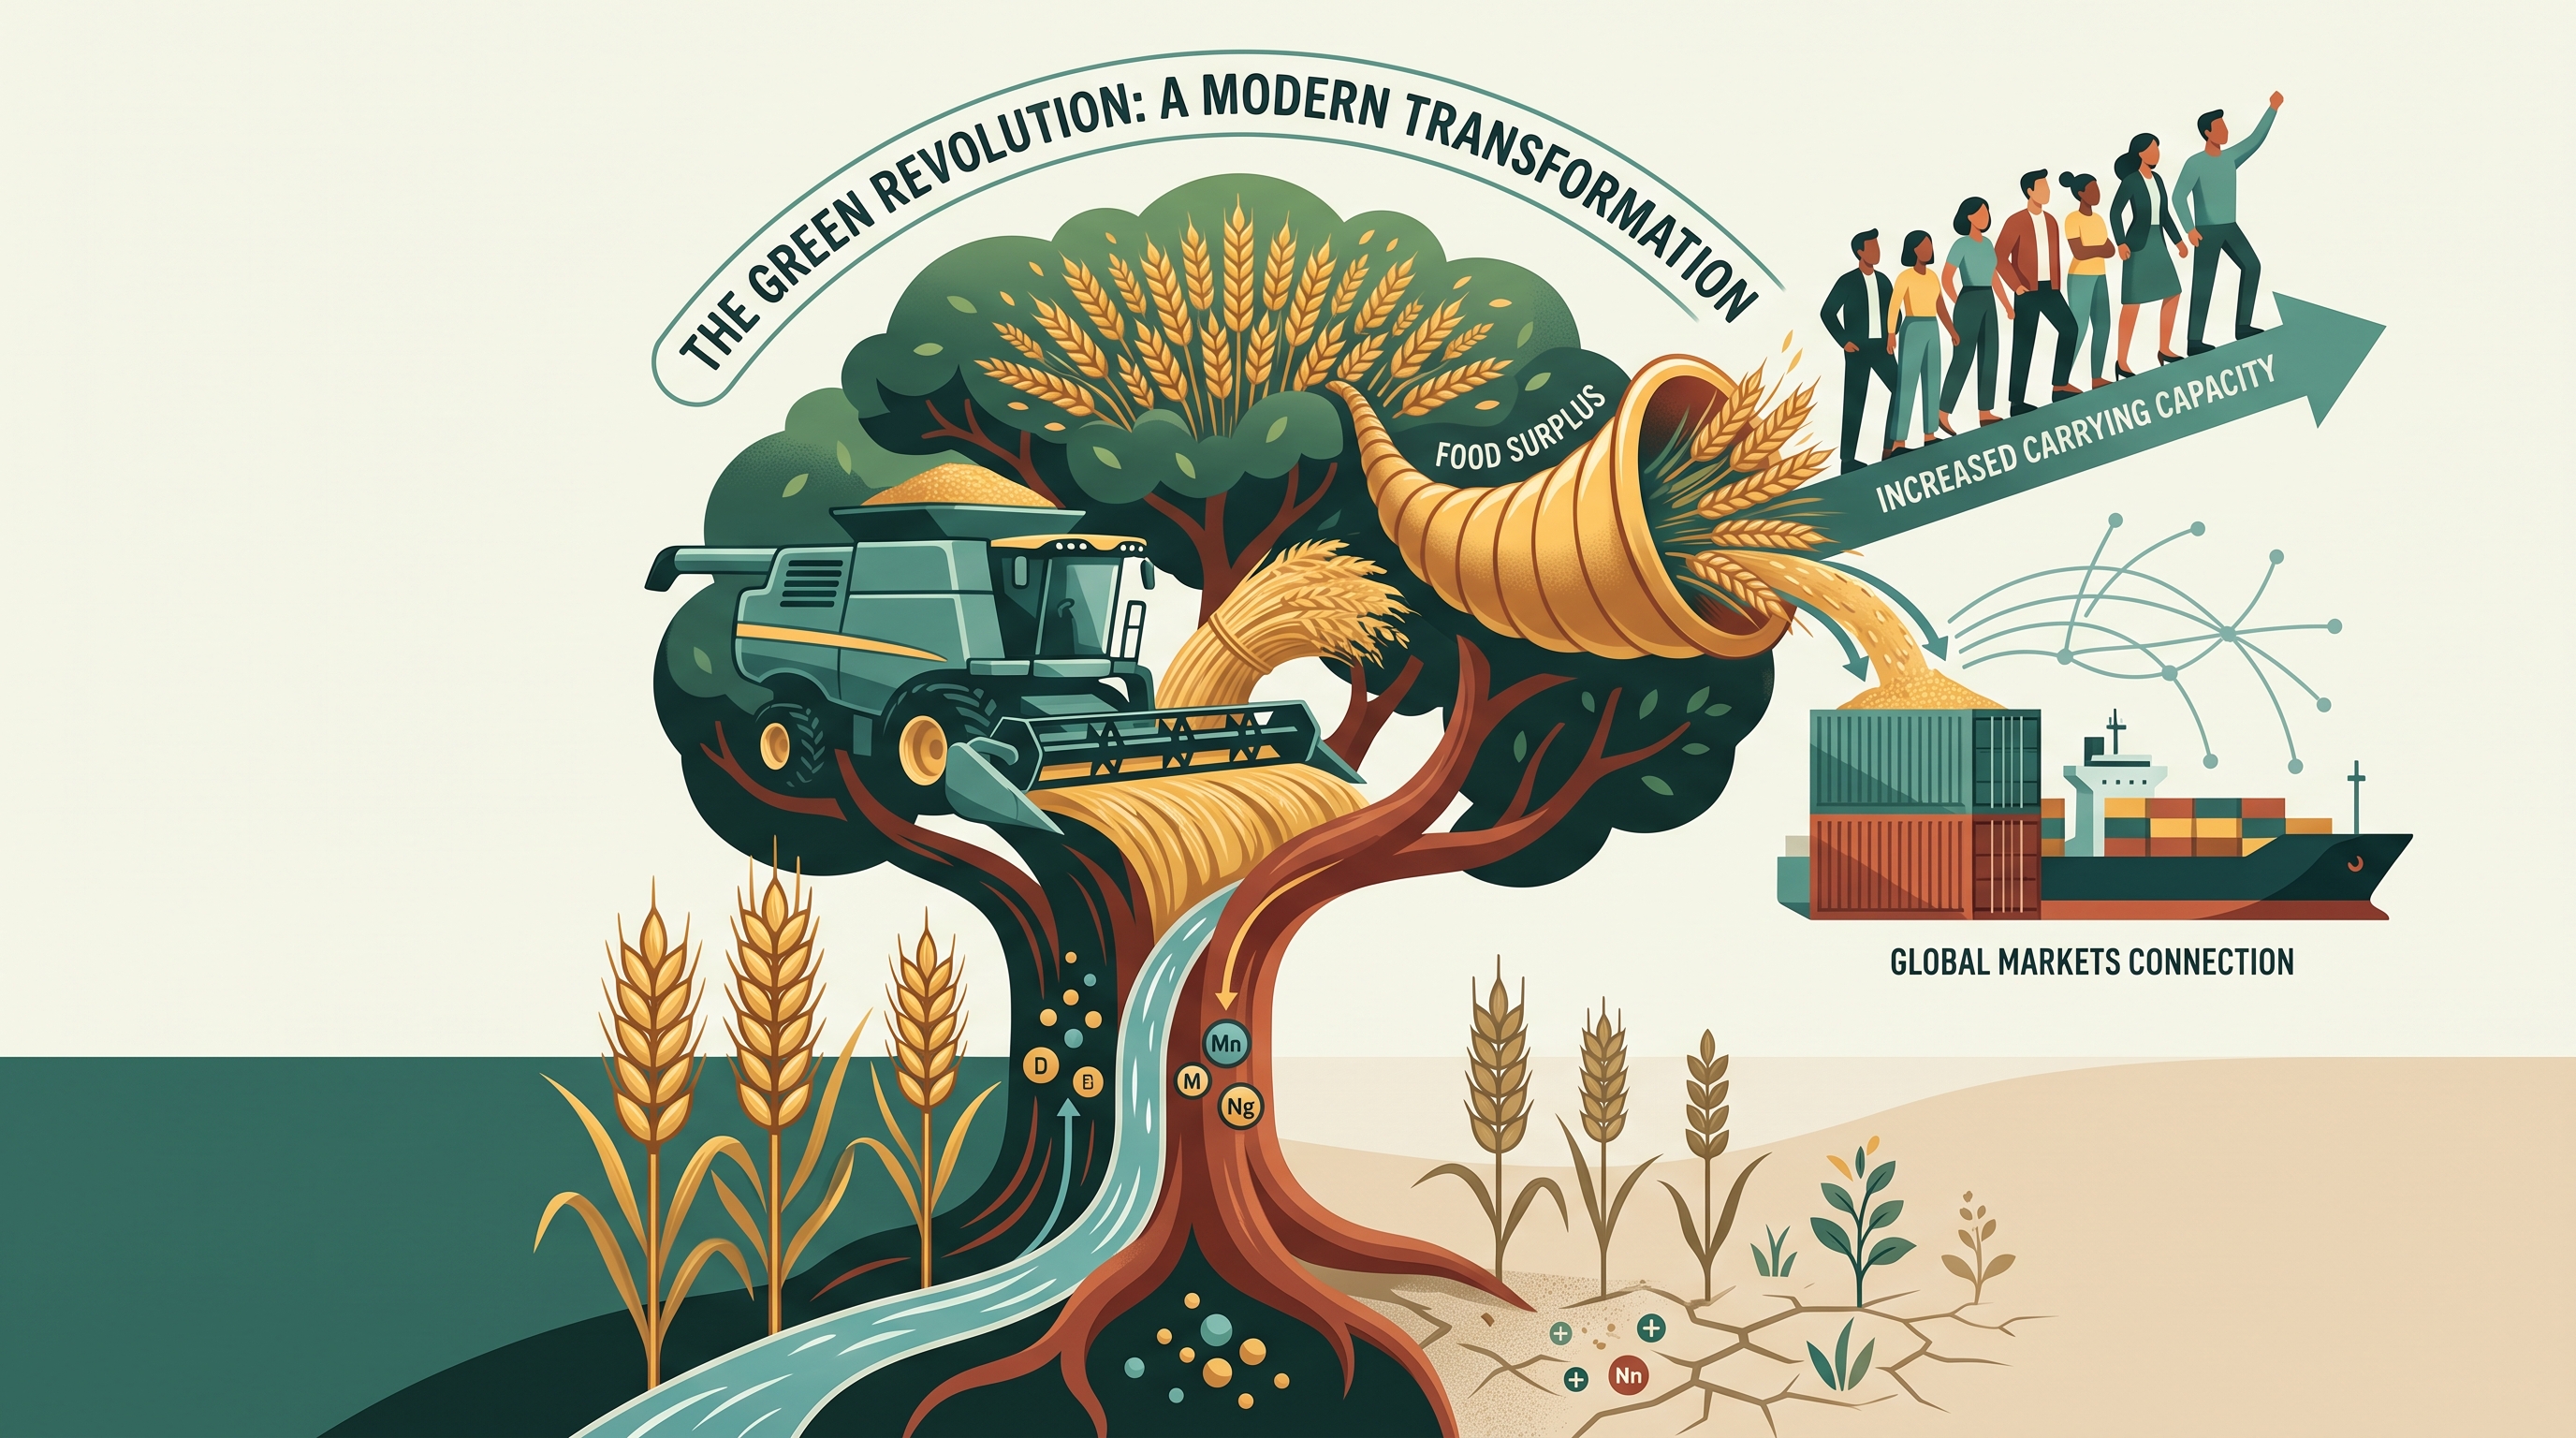
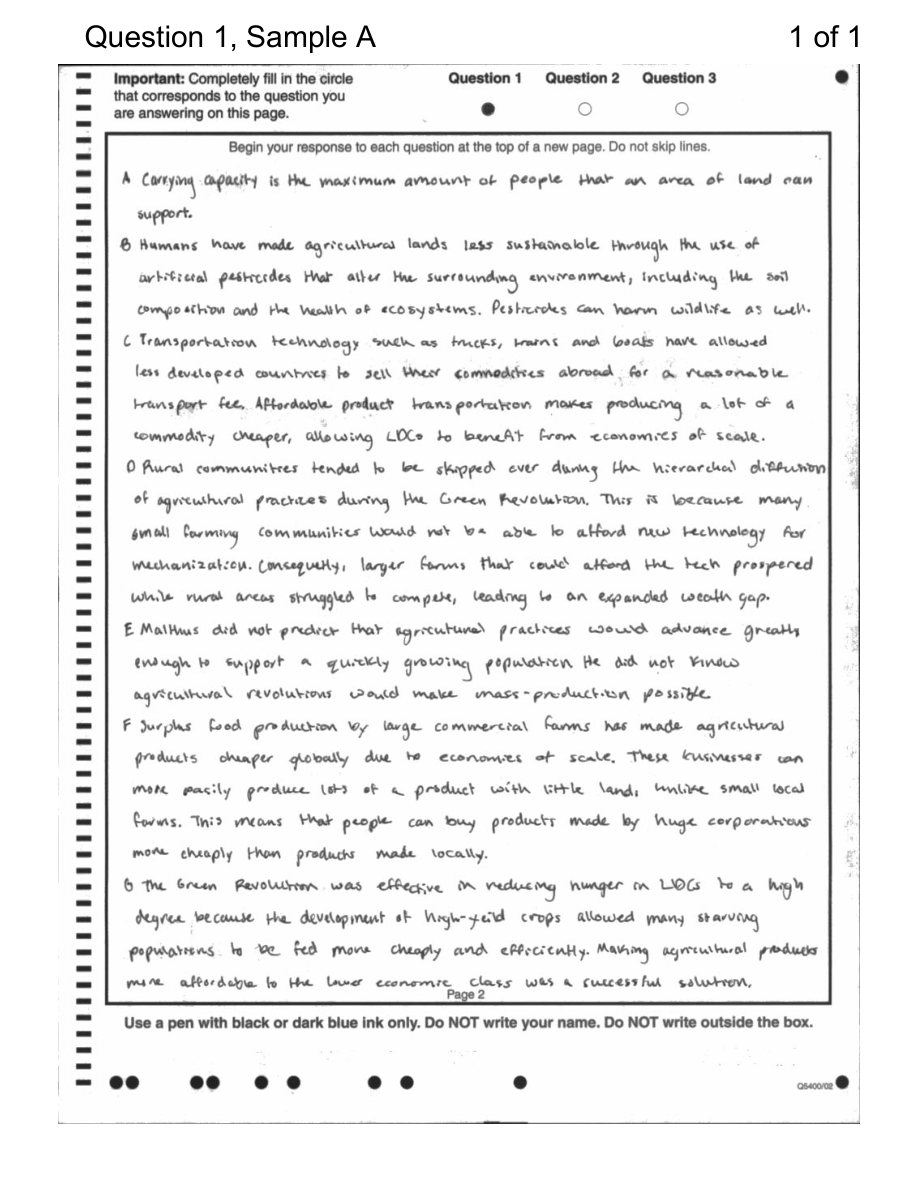
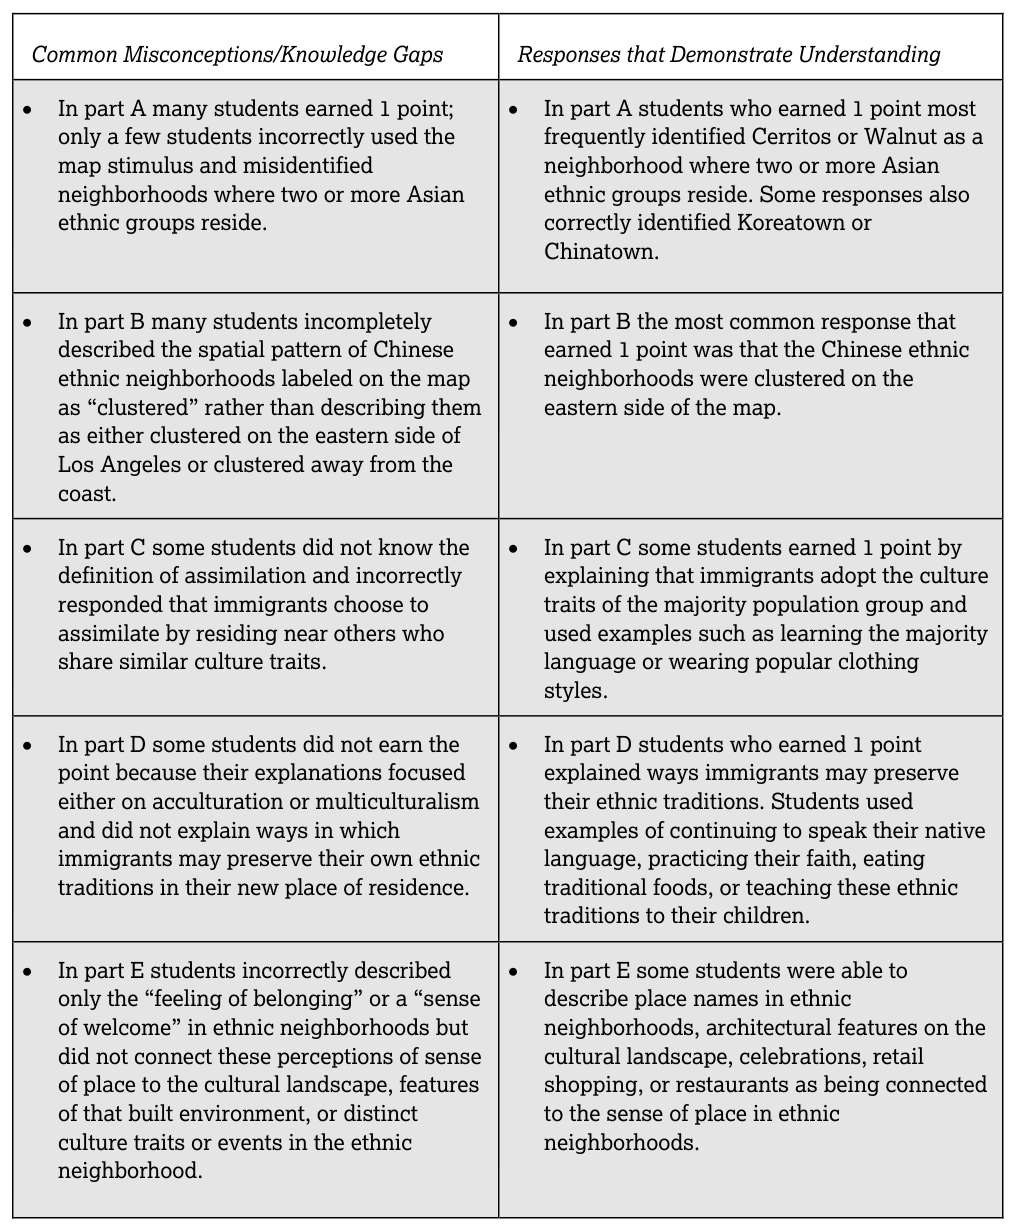
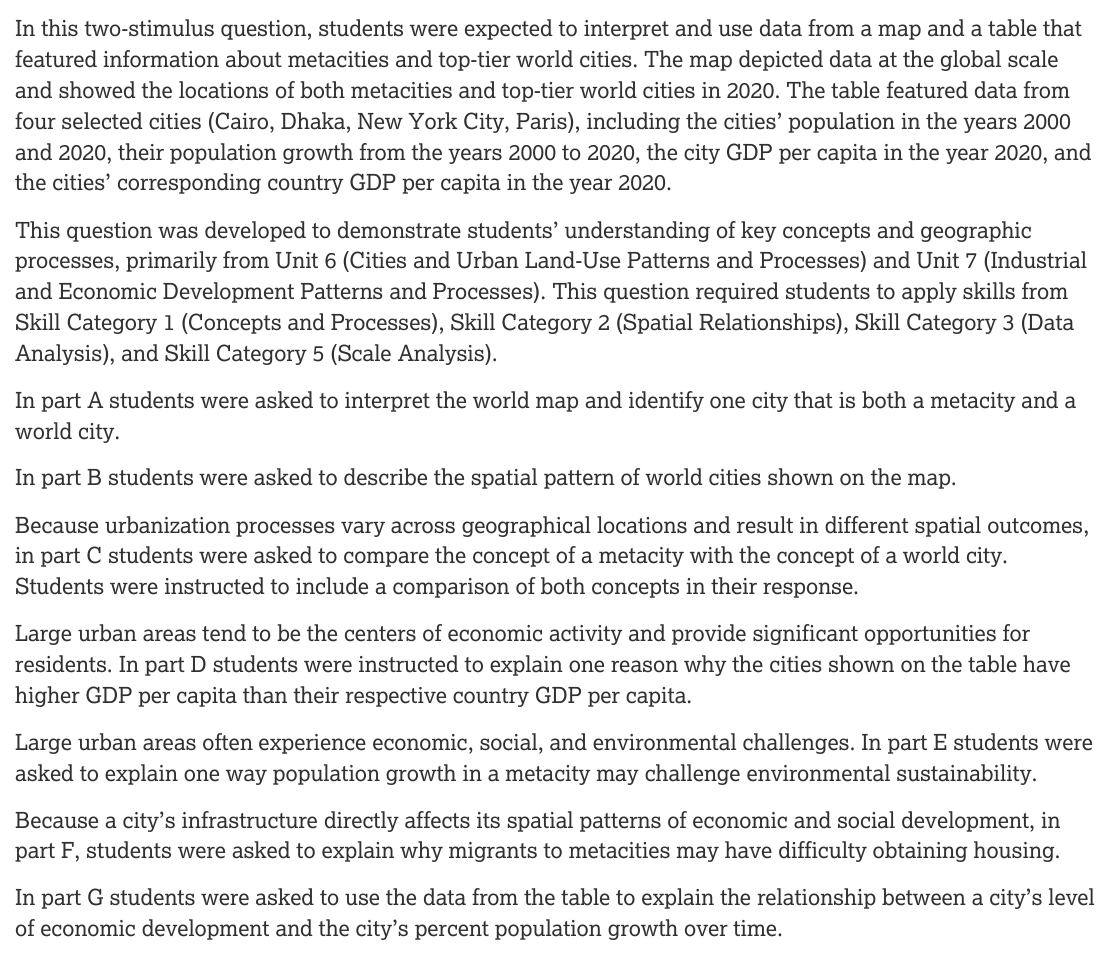
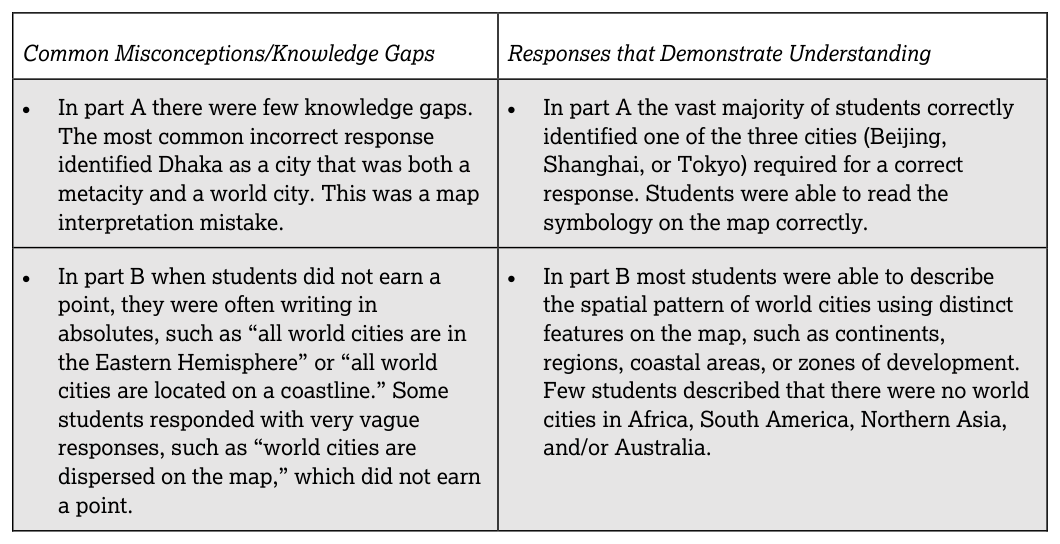
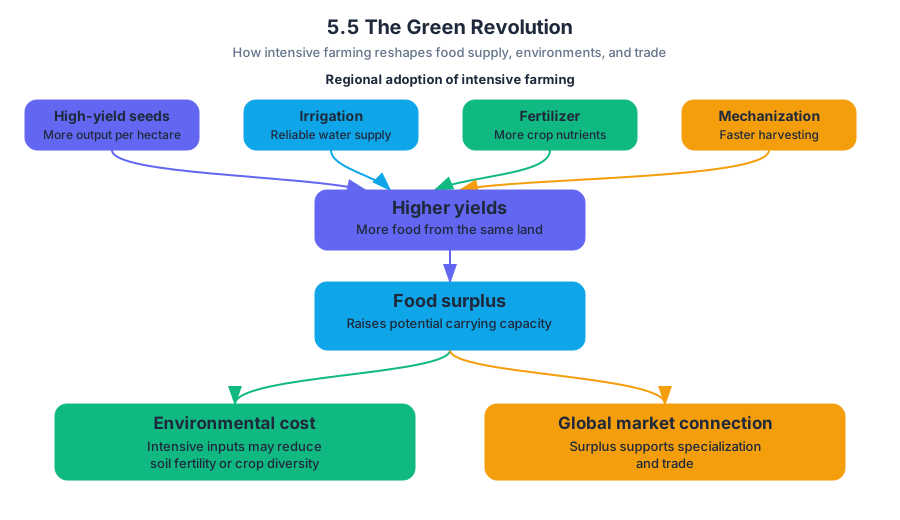
5.6 Agricultural Production Regions
Key concepts: Agricultural production regions · Availability of resources and cultural practices · Agricultural land-use patterns · Spatial relationships · Agricultural practices and landscape alteration · Slash-and-burn agriculture · Terrace farming and irrigation · Shifting cultivation and pastoral nomadism · Societal effects of agriculture · Spatial patterns of cow’s milk and pork production
Agricultural production regions are areas whose farming patterns reflect both economic purpose and cultural practice. A field system is never determined by climate or soil alone: farmers also respond to land costs, transportation, markets, dietary traditions, available labor, and the resources valued by a society.
5.6 Agricultural Production Regions
Agricultural production regions are areas whose farming patterns reflect both economic purpose and cultural practice. A field system is never determined by climate or soil alone: farmers also respond to land costs, transportation, markets, dietary traditions, available labor, and the resources valued by a society.
Enduring Understanding PSO-5: Availability of resources and cultural practices influence agricultural practices and land-use patterns.
Under Learning Objective PSO-5.C, the key task is to explain how economic forces influence agricultural practices. Essential Knowledge PSO-5.C.1 identifies agricultural production regions by the extent to which they reflect subsistence practices—production mainly for the farmer’s household or local community—or commercial practices—production for sale. A region may also be organized around monocropping, the large-scale cultivation of one major crop, when market demand makes specialization profitable.
Resources, culture, and land-use patterns
Resources shape what is possible, while cultural practices shape what is preferred or acceptable. Water availability encourages irrigation; steep slopes may encourage terracing; extensive grasslands support pastoral nomadism; and religious or dietary traditions influence which animals farmers raise. Economic forces then connect these choices to markets: a farmer may grow food for household consumption, produce a cash crop for export, or combine both strategies to reduce risk.
Essential Knowledge PSO-5.C.2 connects farming intensity to land costs through bid-rent theory. Intensive farming uses substantial labor, capital, or inputs on a relatively small area, making sense where land is expensive or scarce. Extensive farming uses more land with fewer inputs per unit of area, making sense where land is cheaper or population density is lower. These are tendencies, not rigid rules: technology, infrastructure, government policy, and culture can alter the pattern.
| Agricultural pattern | Main economic logic | Possible landscape expression |
|---|---|---|
| Subsistence farming | Feed the producer and household | Diverse small plots |
| Commercial farming | Produce for markets and profit | Large farms or specialized production |
| Monocropping | Concentrate on a profitable crop | Extensive single-crop fields |
| Intensive farming | Maximize output from costly land | Terraces, irrigation, dense labor |
| Extensive farming | Use broad areas where land is less costly | Ranching, pastoralism, large grain farms |
Agriculture alters landscapes and societies
Agricultural practices change physical landscapes. Slash-and-burn agriculture clears vegetation by cutting and burning it, temporarily releasing nutrients into the soil. In shifting cultivation, farmers move plots after soil fertility declines, allowing previously used land to recover. If population pressure shortens the fallow period, however, repeated clearing can contribute to deforestation, erosion, and declining soil fertility.
Other practices create different alterations. Terracing converts slopes into level steps that reduce runoff and make cultivation possible. Irrigation brings water to fields but can contribute to salinization when evaporation leaves salts behind. Wetland drainage creates farmland while removing habitats and natural flood storage. Pastoral nomadism uses seasonal movement across grazing areas; overgrazing can occur when herd size or land pressure exceeds the landscape’s capacity.
These practices also produce societal consequences, identified in IMP-5.A.2 and IMP-5.A.3. Agricultural change can alter diets, change the role of women in agricultural production, and shift agriculture’s economic purpose from household subsistence toward wage labor, commercial farming, or export production. These effects vary by region and scale rather than appearing everywhere in the same form.
Worked map comparison: cow’s milk and pork in Asia
A strong spatial analysis compares both maps. Suppose the cow’s-milk map shows medium or high production across most Asian countries, while the pork map shows high production concentrated in particular regions and low production elsewhere. The correct conclusion is not merely “cow’s milk is widespread” or “pork is concentrated.” The comparison is that cow’s-milk production has a broader distribution, whereas pork production is more localized.
Cultural practices help explain the contrast. Dietary traditions, including religious restrictions on pork in some societies, affect demand and therefore production. Cow’s milk production is widespread across most Asian countries, while pork production is concentrated in particular Asian regions. Resources, livestock traditions, market access, and the spatial diffusion of domesticated animals work together to produce these patterns.
Exam-quality comparison: Identify a specific region that shows similar production volumes on both maps, then identify a specific region where the volumes differ. Name the pattern on each map and explain the difference using a cultural, economic, or environmental factor.
Global interdependence
Contemporary agricultural regions are connected through globalization. Under Learning Objective PSO-5.E, food and agricultural products form part of a global supply chain (PSO-5.E.1); some countries depend heavily on one or more export commodities (PSO-5.E.2); and political relationships, infrastructure, and world-trade patterns influence distribution networks (PSO-5.E.3). A local land-use decision can therefore respond to demand, prices, transportation, or dietary change far beyond the producing region.
Misconception check
Misconception: “The map with the largest number of producing countries shows the greatest production.” A broad distribution does not necessarily mean the highest total volume. Always compare the mapped production levels, identify specific matching and differing regions, and then connect the spatial pattern to cultural practices, resources, markets, or animal diffusion.
Retrieval check
A region has steep slopes, expensive land, strong local demand for rice, and abundant seasonal water. Which practice is most likely—terracing, wetland drainage, or extensive ranching—and what resource and economic conditions explain your choice? Then state one environmental consequence that could result.
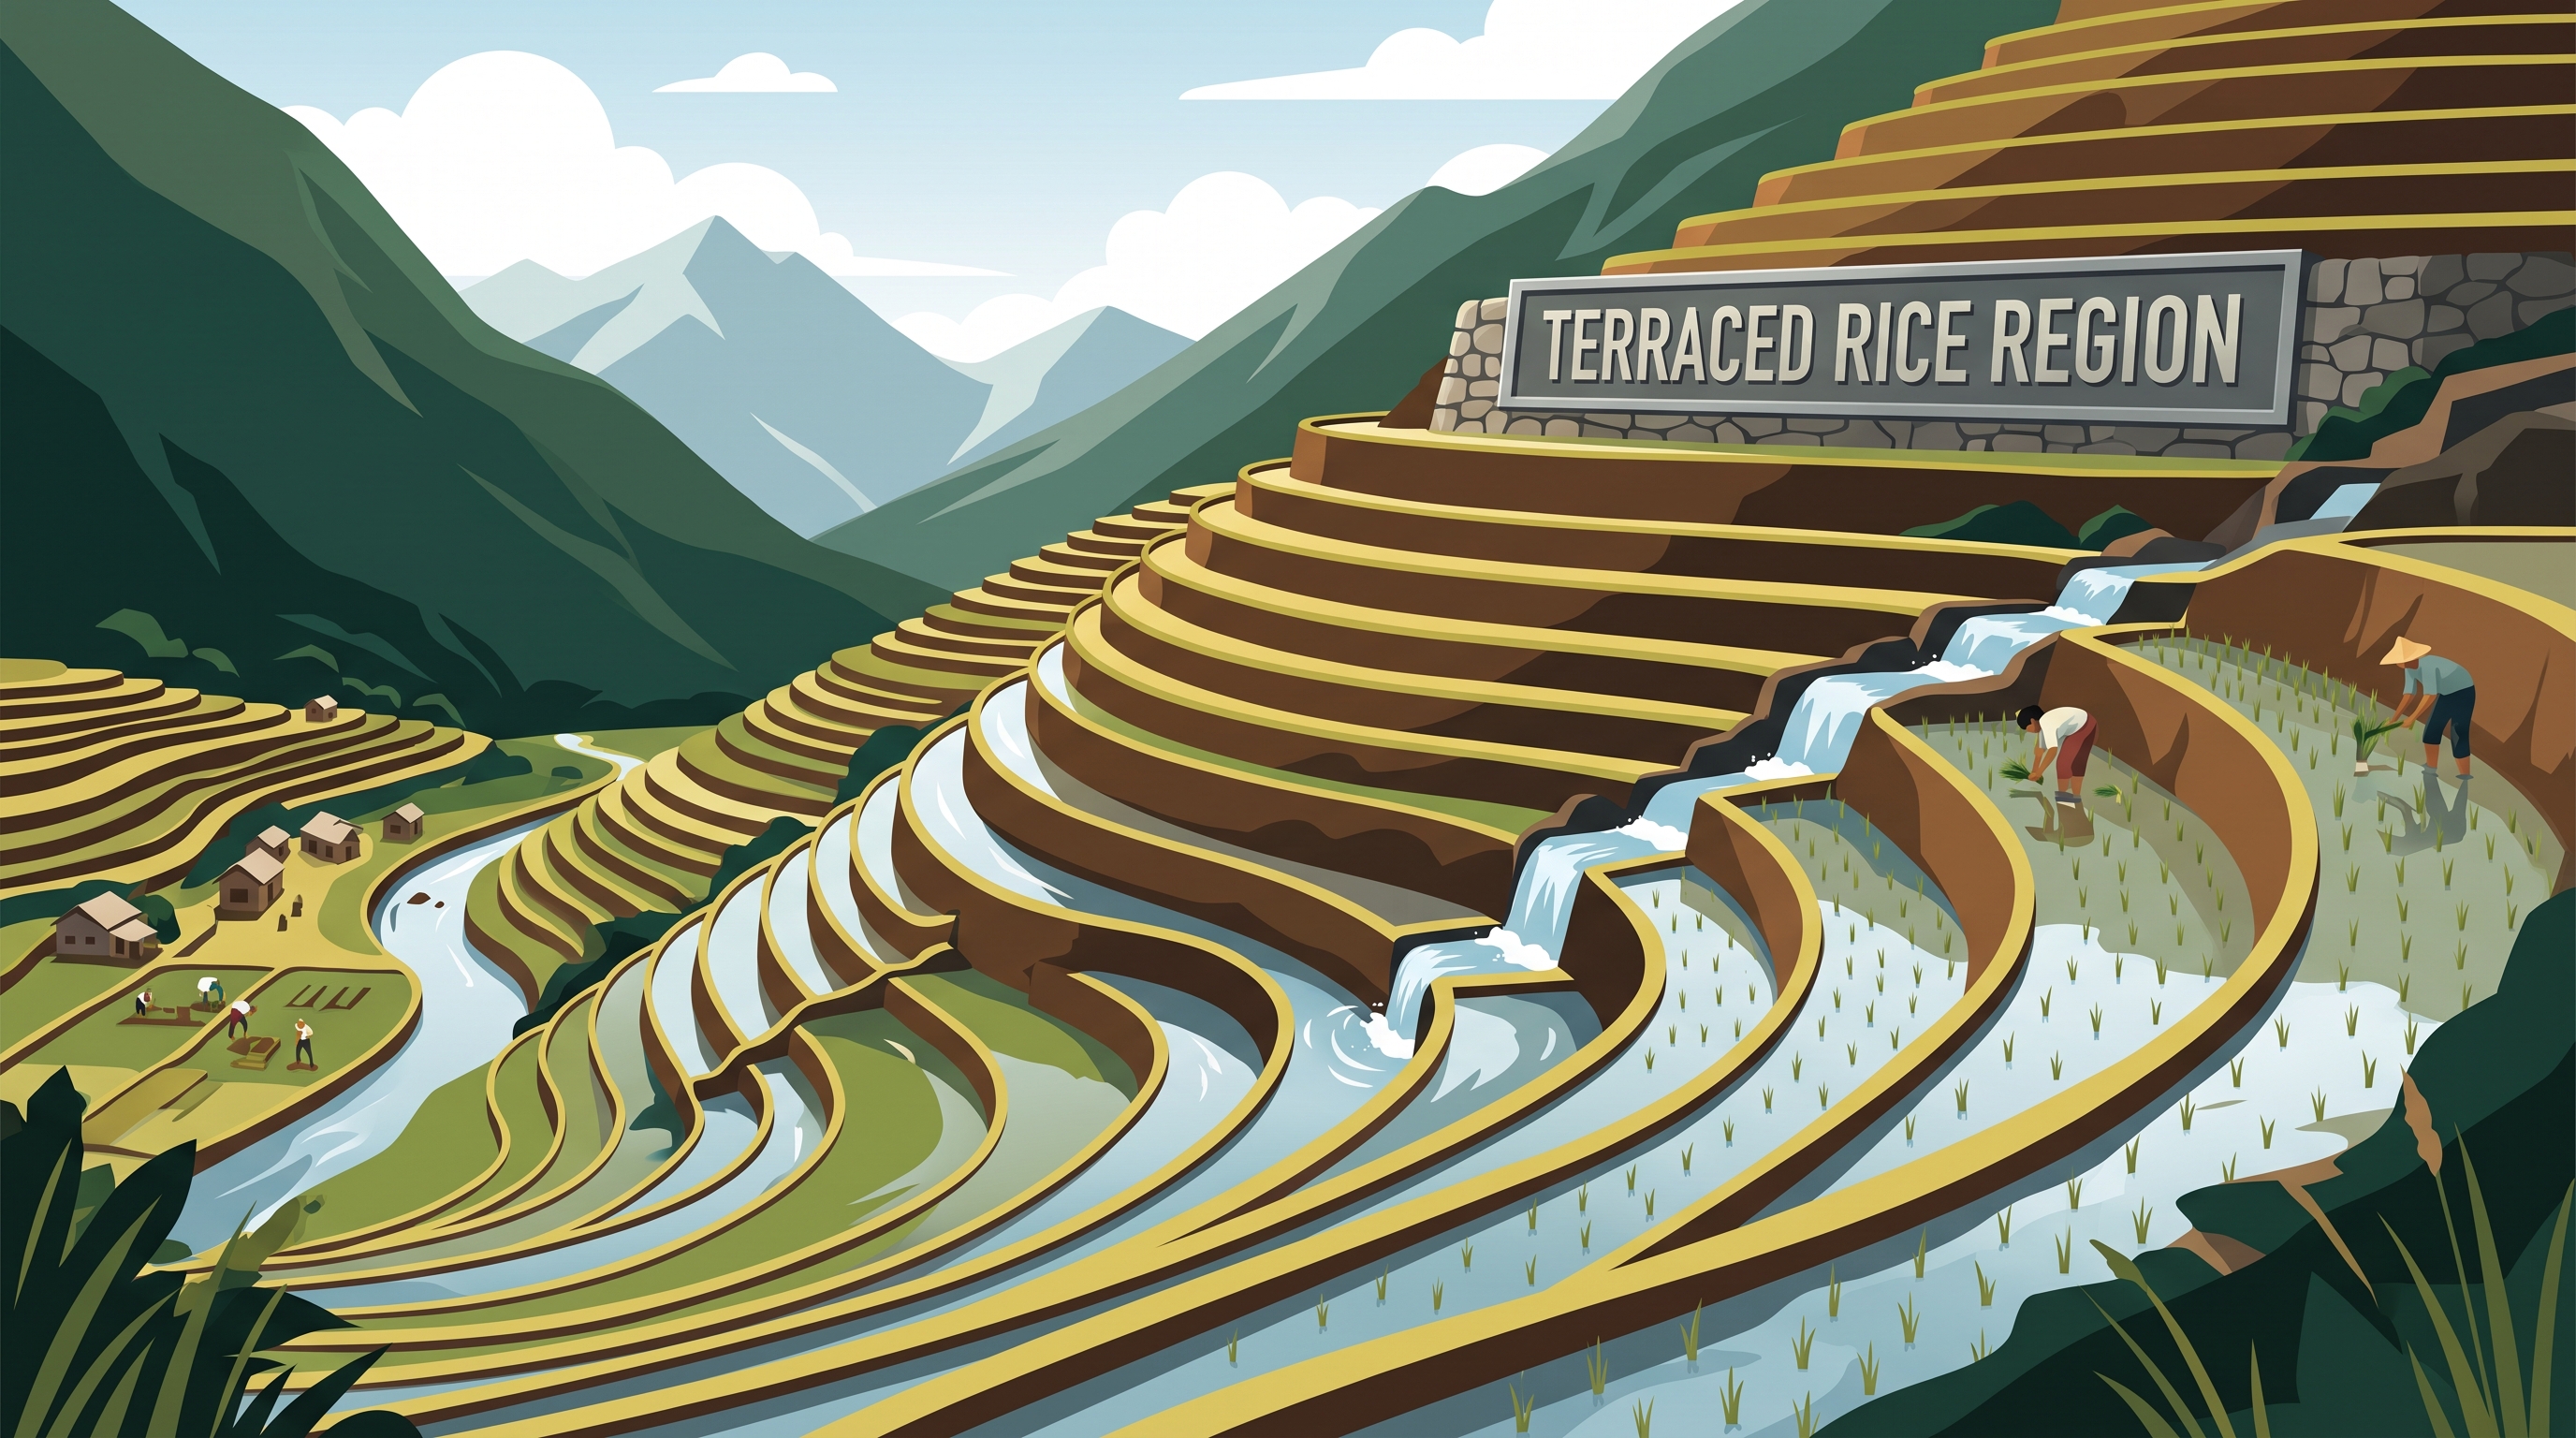
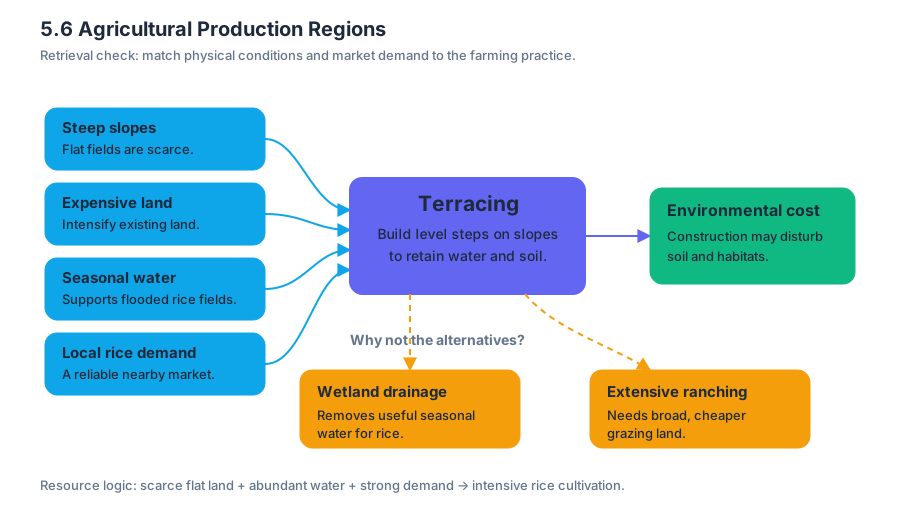
5.7 Spatial Organization of Agriculture
Key concepts: Spatial organization of agriculture · Availability of resources and cultural practices · Agricultural practices and land-use patterns · Economies of scale in agriculture · Carrying capacity of land · Agricultural technology and productivity · Hearths of domestication and crop diffusion · Food supply chains linking production and consumption · Scale analysis and spatial relationships · Conflicts between nomadic herders, conservation organizations, and governments
A farm’s location and size are shaped not only by soil and climate, but also by technology, culture, markets, transportation, and political rules. The same agricultural landscape can therefore produce very different results depending on who controls resources, what consumers prefer, and how efficiently products…
5.7 Spatial Organization of Agriculture
A farm’s location and size are shaped not only by soil and climate, but also by technology, culture, markets, transportation, and political rules. The same agricultural landscape can therefore produce very different results depending on who controls resources, what consumers prefer, and how efficiently products move from field to table.
Enduring Understanding PSO-5: “Availability of resources and cultural practices influence agricultural practices and land-use patterns.”
Learning Objective PSO-5.C: “Explain how economic forces influence agricultural practices.”
Essential Knowledge PSO-5.C.3: Large-scale commercial agricultural operations are replacing small family farms.
PSO-5.C.4: Complex commodity chains link production and consumption of agricultural products.
PSO-5.C.5: Technology has increased economies of scale in the agricultural sector and the carrying capacity of the land.
From resources and culture to land-use patterns
Spatial organization of agriculture means the way agricultural activities are arranged across space. Resource availability—such as fertile soil, water, pasture, labor, and transportation—creates opportunities and limits. Cultural practices then influence which opportunities people use: food preferences, religious restrictions, inherited farming traditions, and customary land-tenure systems all affect what is grown, raised, or avoided.
For example, a region with abundant grassland may support livestock herding, but that does not guarantee that every household will raise cattle. Cultural food preferences, market demand, access to irrigation, and government policies may instead encourage grain production or a different form of pastoralism. Physical resources create possibilities; economic and cultural decisions organize those possibilities.
Economies of scale and the changing farm
Economies of scale occur when the average cost of producing each unit falls as the size of an operation increases. A large commercial farm can spread the cost of tractors, irrigation systems, storage facilities, data systems, and processing contracts across many hectares or many units of output. Technology has strengthened this advantage through mechanized planting and harvesting, satellite-guided equipment, improved seeds, chemical inputs, and large-scale irrigation.
A simplified comparison shows the logic:
| Operation | Fixed technology cost | Output | Fixed cost per unit |
|---|---|---|---|
| Small farm | $100,000$ | $10,000$ units | $10$ per unit |
| Large farm | $400,000$ | $100,000$ units | $4$ per unit |
The large farm spends more overall, but its cost per unit is lower. That economic advantage can encourage consolidation: large-scale commercial operations may replace small family farms, especially when farms must compete in national or global markets. However, economies of scale do not mean that large farms are automatically more sustainable, equitable, or productive in every environment.
Technology, productivity, and carrying capacity
Agricultural productivity is the amount of agricultural output produced from a given quantity of inputs, especially land. Advances in agricultural technology can increase the resources produced by a fixed area through higher-yield seeds, irrigation, fertilizers, pest control, machinery, and improved management.
Carrying capacity is the largest population that an environment can support with its available resources and technology. If a hectare produces more food, the same area can support more people—at least while water, soil nutrients, infrastructure, and ecological conditions remain adequate.
Worked example: A valley initially produces enough food for $1{,}000$ residents. A new irrigation system and higher-yield crop increase output by $50%$. If food distribution and other resources keep pace, the valley’s potential carrying capacity may rise to roughly $1{,}500$ residents. The key chain is:
$$ \text{technology} \rightarrow \text{higher productivity} \rightarrow \text{more resources from the same land} \rightarrow \text{higher carrying capacity} $$
Named misconception — “Carrying capacity is fixed.” Carrying capacity is not a permanent biological number. It changes with technology, resource management, consumption levels, and environmental degradation. Technology can raise carrying capacity, but overuse may later reduce it through erosion, salinization, groundwater depletion, or habitat loss.
Commodity chains connect distant places
Agricultural products move through food supply chains, or linked stages connecting production and consumption. A product may involve farmers, input suppliers, processors, wholesalers, transport companies, retailers, and consumers located in different regions or countries.
This creates interdependence: production decisions in one place can affect prices, employment, diets, and food security elsewhere. A country that depends heavily on one or more export commodities may gain foreign income but also become vulnerable to price changes, crop disease, trade restrictions, or political conflict.
Diffusion from hearths of domestication
A hearth of domestication is an origin area from which crops or domesticated animals diffuse. Diffusion does not occur equally for every crop. Climate requirements, cultural preferences, transportation, disease resistance, and the availability of suitable land determine how widely a crop spreads.
A classic interpretation task asks which listed crop diffused the least from its hearth of domestication. In the cited comparison, the correct crop was the yam. The reasoning is not merely “identify the smallest symbol”; it is: locate the crop’s hearth, compare its production area with that origin, and select the crop showing the least spatial expansion.
Conflict over pastoral land
Nomadic herding can produce conflicts because herders depend on seasonal movement across grazing areas. Conservation organizations may oppose grazing in protected areas when livestock contribute to habitat degradation. Governments may also regulate or restrict cross-border migration, even though herders’ traditional routes may cross modern political boundaries.
The competing perspectives are spatially different: conservation groups emphasize habitat protection, governments emphasize territorial regulation, and herders emphasize livelihood and access to pasture. A strong geographic explanation identifies the resource, the spatial practice, and the institution affected.
AP skills in action
- Skill 2.C (Spatial Relationships): Explain how agricultural technology connects land productivity to carrying capacity.
- Skill 2.D (Spatial Relationships): Use the spatial organization of farms and supply chains to explain how economic forces produce geographic effects.
- Skill 3.A (Data Analysis): Identify the type of data shown when comparing crop diffusion or agricultural production.
- Skill 4.D (Source Analysis): Compare patterns and trends in visual sources to draw conclusions.
- Skill 5.D (Scale Analysis): Explain how agricultural relationships operate from the local farm scale to the global supply-chain scale.
Retrieval check: If irrigation allows the same area of land to produce twice as much food, which two concepts explain the likely population increase? Answer: higher agricultural productivity and increased carrying capacity. Why might the result still be temporary? Resource depletion or environmental degradation could later reduce the land’s capacity to support that population.
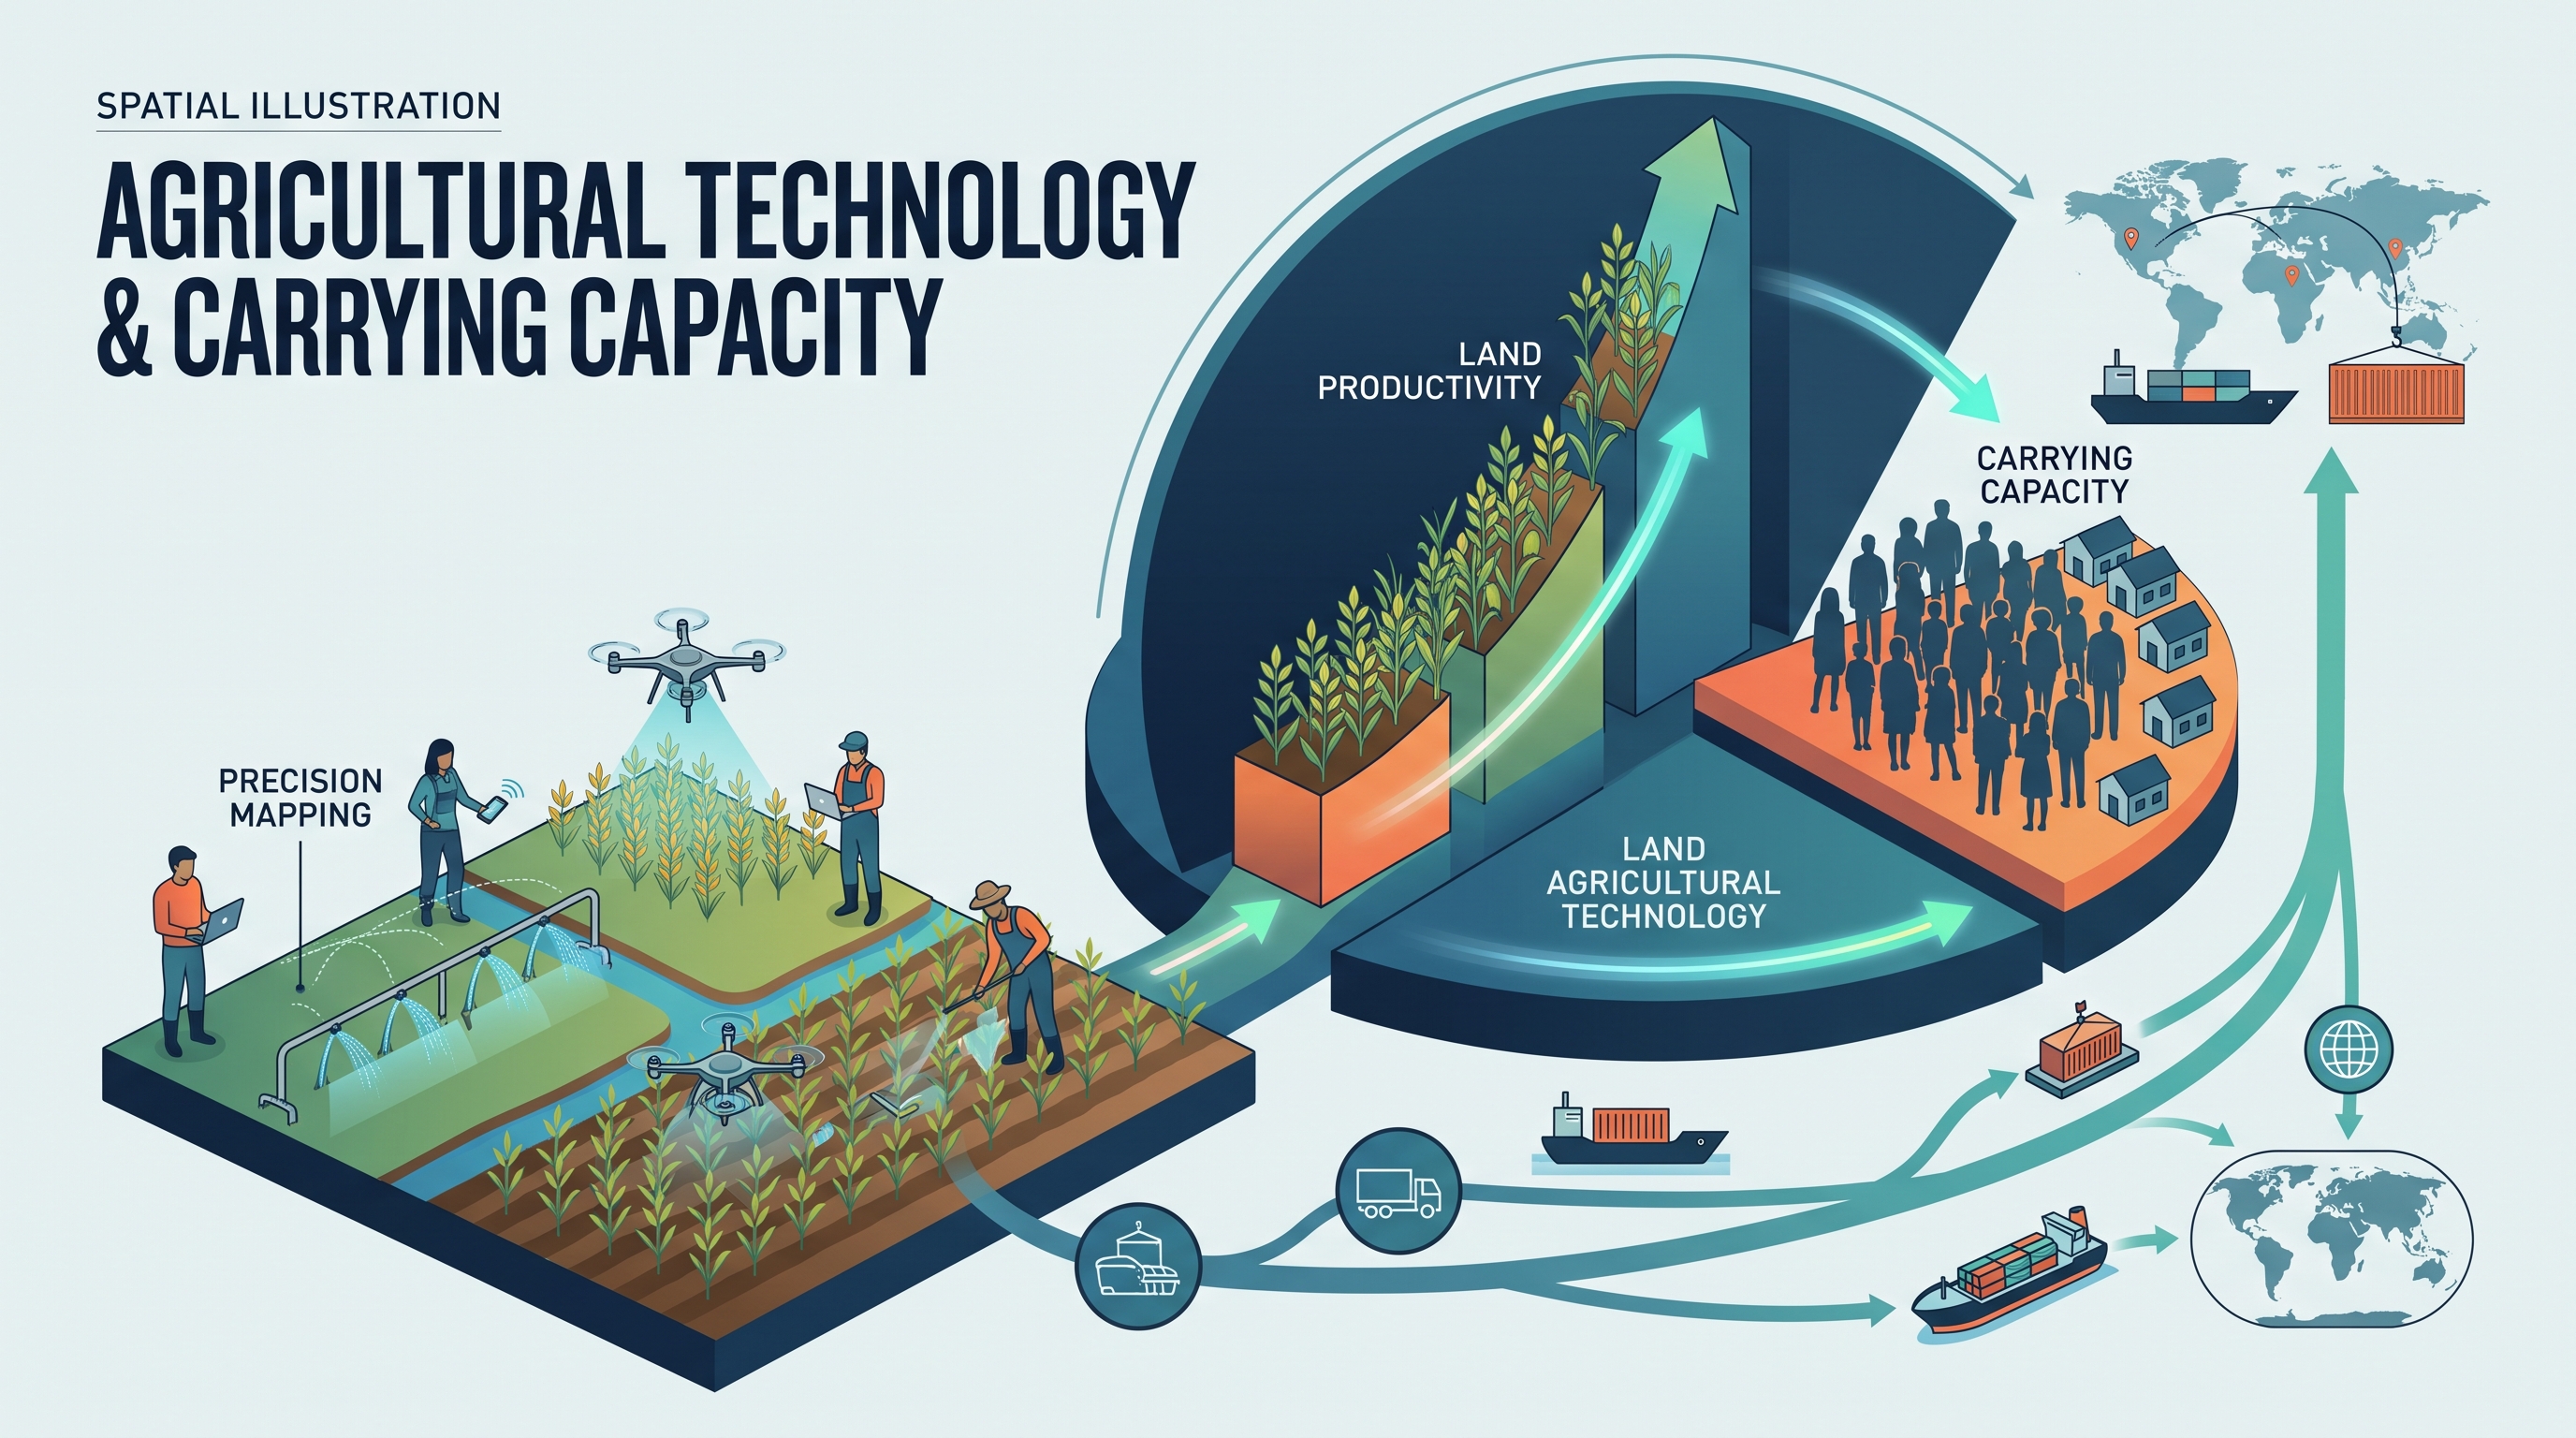
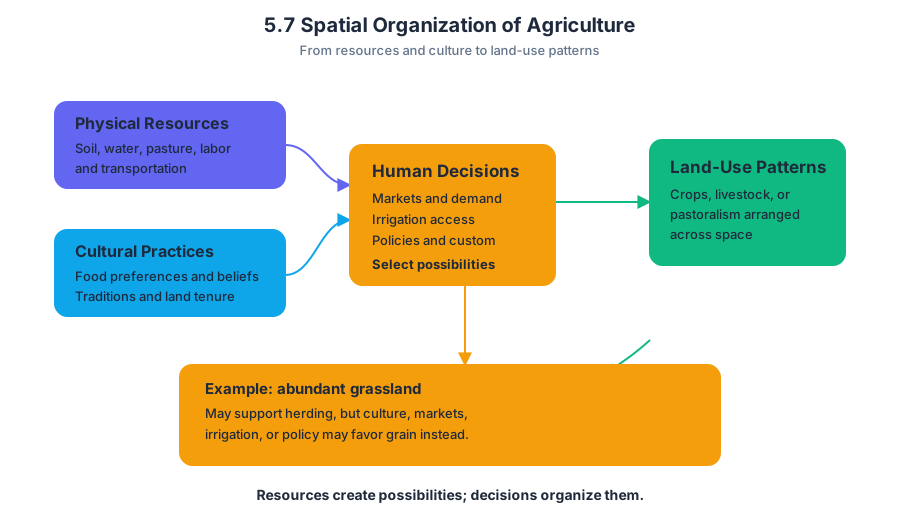
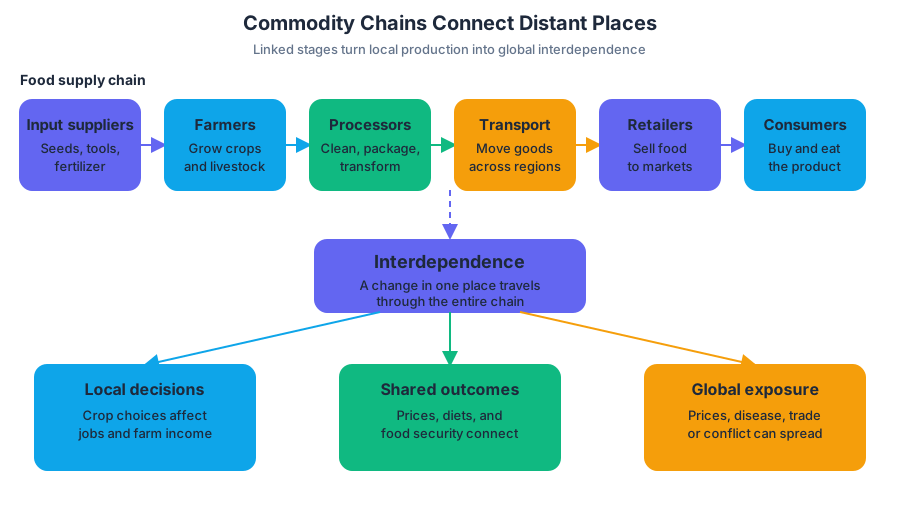
5.8 Von Thünen Model
Key concepts: Von Thünen model · Scale analysis · Geographic scales · Rural land use · Transportation costs · Distance from the market · Concentric rings · Regions of specialty farming · Spatial relationships · Geographic models and theories
A farm’s location can matter almost as much as its soil: perishable or bulky products usually become less profitable as they travel farther from the market.
5.8 Von Thünen Model
A farm’s location can matter almost as much as its soil: perishable or bulky products usually become less profitable as they travel farther from the market. The Von Thünen model explains this rural land-use pattern by connecting agricultural location to transportation costs and distance from the market.
Learning Objective PSO-5.D: Describe how the von Thünen model is used to explain patterns of agricultural production at various scales.
Essential Knowledge PSO-5.D.1: Von Thünen’s model helps explain rural land use by emphasizing the importance of transportation costs associated with distance from the market; however, regions of specialty farming do not always conform to von Thünen’s concentric rings.
The model’s central logic
Imagine a single city surrounded by agricultural land. A farmer near the city can deliver milk, vegetables, or flowers quickly, while a farmer farther away must spend more money transporting products. If the product is perishable, fragile, or expensive to move, proximity to the market becomes especially valuable.
The model represents rural land-use patterns as concentric rings around a central market. A concentric ring is a circular zone sharing the same center. In the simplified model, land uses requiring high market access tend to occupy the inner rings, while less perishable or less transport-sensitive activities can occur farther out.
| Distance from central market | Expected land use in the simplified model | Why it fits |
|---|---|---|
| Closest ring | Intensive gardening, dairy, or other perishable production | Products must reach consumers quickly; land rents near the market are high |
| Intermediate rings | Forestry or other bulky products | Transport costs matter because the products are heavy or expensive to move |
| Farther rings | Grain or field crops | Products are less perishable and can tolerate longer travel |
| Outermost ring | Extensive ranching or livestock production | Large areas of land are needed, and products can travel after processing |
These rings are not a prediction that every landscape will display perfect circles. They are a geographic model: a simplified representation used to identify and explain spatial patterns. Its value lies in making the relationship between market distance and land use visible.
Worked example: applying the model
Suppose a municipality contains four farming zones around a major food market. Zone A produces fresh lettuce, Zone B produces timber, Zone C grows wheat, and Zone D raises cattle on large grazing areas.
Step 1 — Identify the controlling factor. Distance from the market affects transportation costs.
Step 2 — Rank transport sensitivity. Lettuce is highly perishable; timber is bulky; wheat is comparatively durable; cattle ranching requires extensive land.
Step 3 — Match land uses to distance. The model would place lettuce closest to the market, timber next, wheat farther away, and ranching farthest away.
Step 4 — Explain the pattern geographically. The expected pattern results from the interaction of transportation costs, product characteristics, land value, and distance from the market—not simply from climate or soil.
Scale analysis: the key AP skill
Scale analysis examines how a geographic pattern changes when the size of the study area changes. Geographic scale may be global, regional, national, or local. A local-scale study area might be a neighborhood or municipality; a regional study area might include several municipalities and their shared market system.
The Von Thünen model should therefore be applied across scales rather than treated as a single fixed map.
- At the local scale, the model might explain why vegetable farms cluster near a municipal food market.
- At the regional scale, several cities may create overlapping market areas, producing a more complex pattern than one set of rings.
- At the national scale, transportation networks, national demand, and regional specialization may matter more than distance from one central market.
- At the global scale, refrigerated shipping and international trade can connect distant producers to consumers, weakening the original distance-based pattern.
The associated AP skills are 5.B — Describe spatial patterns and processes at different scales and 5.D — Explain how concepts, processes, and models are used across geographic scales. A strong explanation does more than name a ring: it states the scale, identifies the spatial relationship, and explains why the relationship changes—or remains visible—at that scale.
Strengths, limitations, and change over time
The model’s major strength is explanatory clarity. It helps identify patterns in rural land use by showing how transportation costs and market distance can organize agricultural production. It also gives students a structure for comparing places and asking why a real landscape resembles—or differs from—the ideal pattern.
Its limitations are equally important. The original model assumes a single central market, uniform physical geography, equal transportation access, and similar economic decision-making across the landscape. Real regions contain multiple markets, highways, railways, mountains, differing land values, government policies, and cultural preferences.
Specialty farming is a particularly important exception. A region may specialize in a crop because of a distinctive climate, cultural tradition, technology, or established market, even when that region lies far from the expected position in the concentric rings. The model identifies a tendency, not an unbreakable rule.
The assumptions and patterns may also change over time. Refrigeration, faster transportation, improved roads, online marketplaces, and changing consumer demand can reduce the penalty of distance. A pattern that fit the model in one period may become weaker or reorganized in another.
Misconception check and retrieval
Named misconception: “The Von Thünen model says all farms must form perfect circles.” Correction: the concentric rings are an idealized pattern. Use them as a starting point, then explain deviations through specialty farming, multiple markets, infrastructure, physical geography, and technological change.
Retrieval check: A distant region grows a high-value specialty crop despite high transportation costs. Which part of the model does this challenge, and what geographic factors could explain the exception? A complete answer should identify the distance-cost expectation, then explain how specialization, environment, culture, technology, or market demand can produce a different spatial pattern.
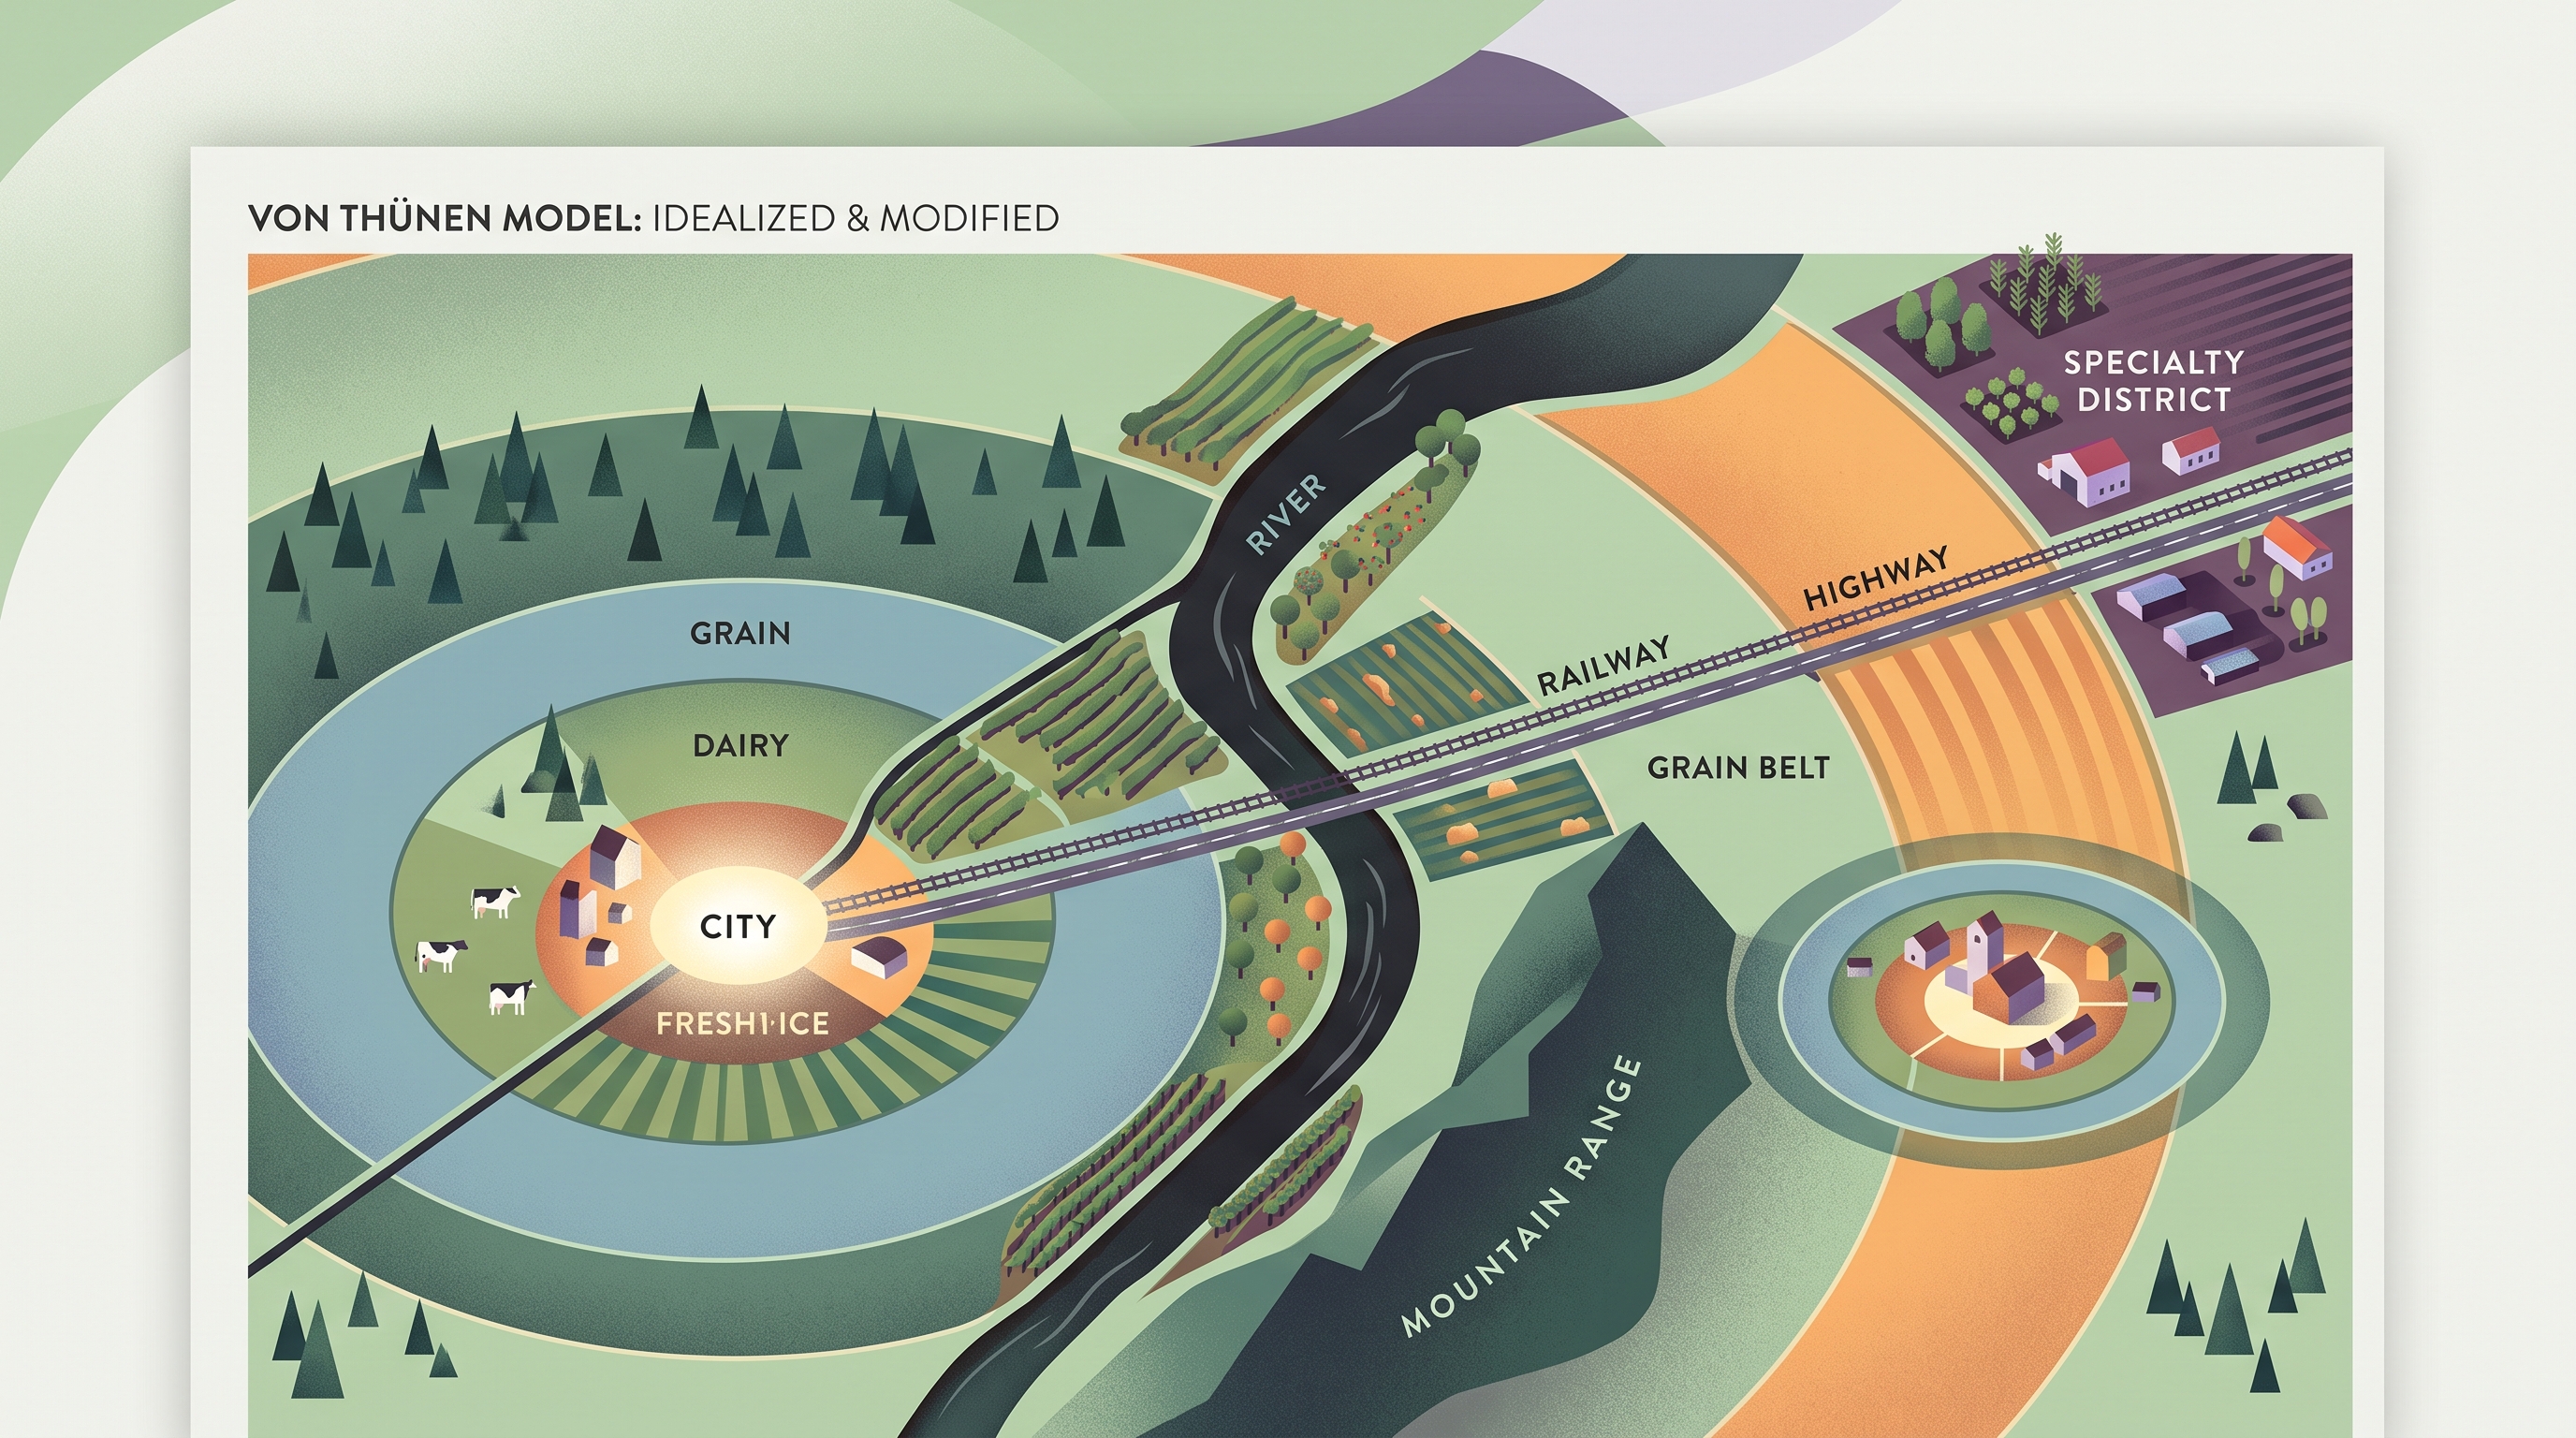
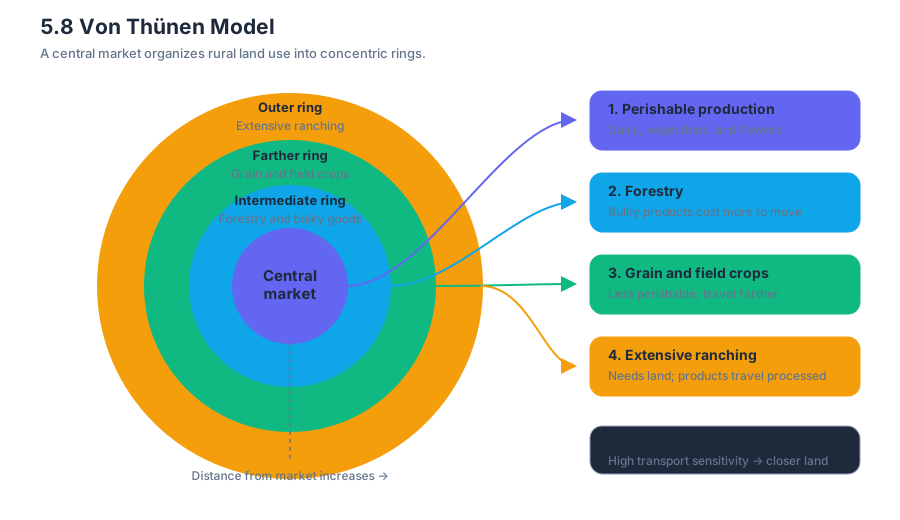
5.9 The Global System of Agriculture
Key concepts: Globalized agricultural system · Global food distribution networks · International trade and export commodities · Political relationships and infrastructure · Commodity chains · Commercial agriculture replacing family farms · Economies of scale · Carrying capacity · Spatial patterns of cow’s milk and pork production · Environmental and health impacts of intensive agriculture
A cup of coffee, a carton of milk, or a package of pork may cross several borders before reaching a consumer. Globalized agriculture is therefore an interconnected system in which production, processing, transportation, distribution, and consumption operate across multiple places and geographic scales.
5.9 The Global System of Agriculture
A cup of coffee, a carton of milk, or a package of pork may cross several borders before reaching a consumer. Globalized agriculture is therefore an interconnected system in which production, processing, transportation, distribution, and consumption operate across multiple places and geographic scales.
PSO-5.E: Agriculture functions as a global system shaped by trade, political relationships, infrastructure, and interdependence.
From local farm to global commodity chain
A commodity chain is the linked sequence of activities that moves an agricultural product from production to consumption. The chain may include farmers, input suppliers, processors, exporters, shipping companies, wholesalers, retailers, and consumers. Large commercial operations increasingly organize these stages across national borders.
Consider a simplified corn chain:
- Corn is grown in Brazil.
- It is transported through roads, railways, and ports.
- Processing occurs in China, where the corn may become animal feed or another food product.
- Finished goods move through international distribution networks.
- Multinational retailers sell those goods to consumers in many countries.
This example shows interdependence: Brazil depends on transportation and foreign buyers, China depends on imported agricultural inputs, retailers depend on reliable international logistics, and consumers depend on the entire chain functioning. A disruption at one point—such as a port closure, trade restriction, or conflict—can affect distant producers and consumers.
Economies of scale and commercial agriculture
Economies of scale occur when the average cost of producing each unit falls as the operation becomes larger. A large farm may spread the cost of machinery, storage, irrigation, data systems, and transportation across thousands of hectares or many animals. This economic advantage helps explain why large-scale commercial agricultural operations are replacing small family farms (PSO-5.C.3).
Technology has strengthened these economies of scale and increased the carrying capacity of land—the number of people or amount of activity that available resources can support under particular conditions (PSO-5.C.5). Mechanization, improved seeds, genetic modification, fertilizers, refrigeration, and digital logistics can raise output, but they may also make small farms less competitive when they cannot afford comparable equipment or access to large markets.
Common misconception: “Commercial agriculture” simply means farming for profit, while “family farming” does not.
Correction: A family farm can sell products commercially. The important distinction is that commercial agriculture is generally organized around large-scale production, markets, processing, and distribution, whereas small family farms often operate with fewer resources and less bargaining power in global commodity chains.
Distribution depends on more than physical geography
Global food distribution networks are shaped by political relationships, infrastructure, and patterns of world trade (PSO-5.E.3). Roads and railways connect farms to ports; refrigerated storage allows perishable products to travel farther; trade agreements influence tariffs and market access; and diplomatic relationships can encourage or restrict exchange.
Many countries depend heavily on one or more export commodities, such as coffee, bananas, cocoa, or another crop produced mainly for foreign markets. Export dependence can generate income and employment, but it also creates vulnerability: a fall in world prices, a disease outbreak, or a change in trade policy can affect national revenue and local livelihoods.
Reading agricultural patterns at multiple scales
The global system must be analyzed at more than one scale, applying geographic concepts, processes, models, or theories across local, national, regional, and global contexts (Skill 5.D: Scale Analysis). A global map may show where production is concentrated, but it does not by itself explain why that pattern exists or who controls the movement of the product.
The Food and Agriculture Organization’s 2018 global choropleth maps illustrate this distinction. Cow’s milk production varied considerably by country, as did pork production. Comparing the maps requires describing spatial patterns—such as concentrations and areas of lower production—then connecting those patterns to population, markets, infrastructure, cultural practices, environmental conditions, and trade relationships.
A country may produce large quantities of a commodity without consuming most of it. Conversely, a country may consume substantial amounts while importing much of its supply. Production maps therefore reveal only one stage of the commodity chain; they do not automatically measure food security, consumption, income, or trade dependence.
The system’s trade-offs
Increasing international trade can produce global economic, social, cultural, and environmental outcomes. It can connect producers to larger markets and raise carrying capacity through technology, while also encouraging intensive operations and specialized production. These effects must be evaluated as consequences of agricultural practices rather than assumed from production totals alone.
Retrieval check
A country grows coffee for export, but its main port is unreliable and a new trade agreement raises tariffs. Explain how infrastructure, political relationships, and world trade could affect the country’s commodity chain and export dependence. For full credit, connect each factor to a specific stage between production and consumption.
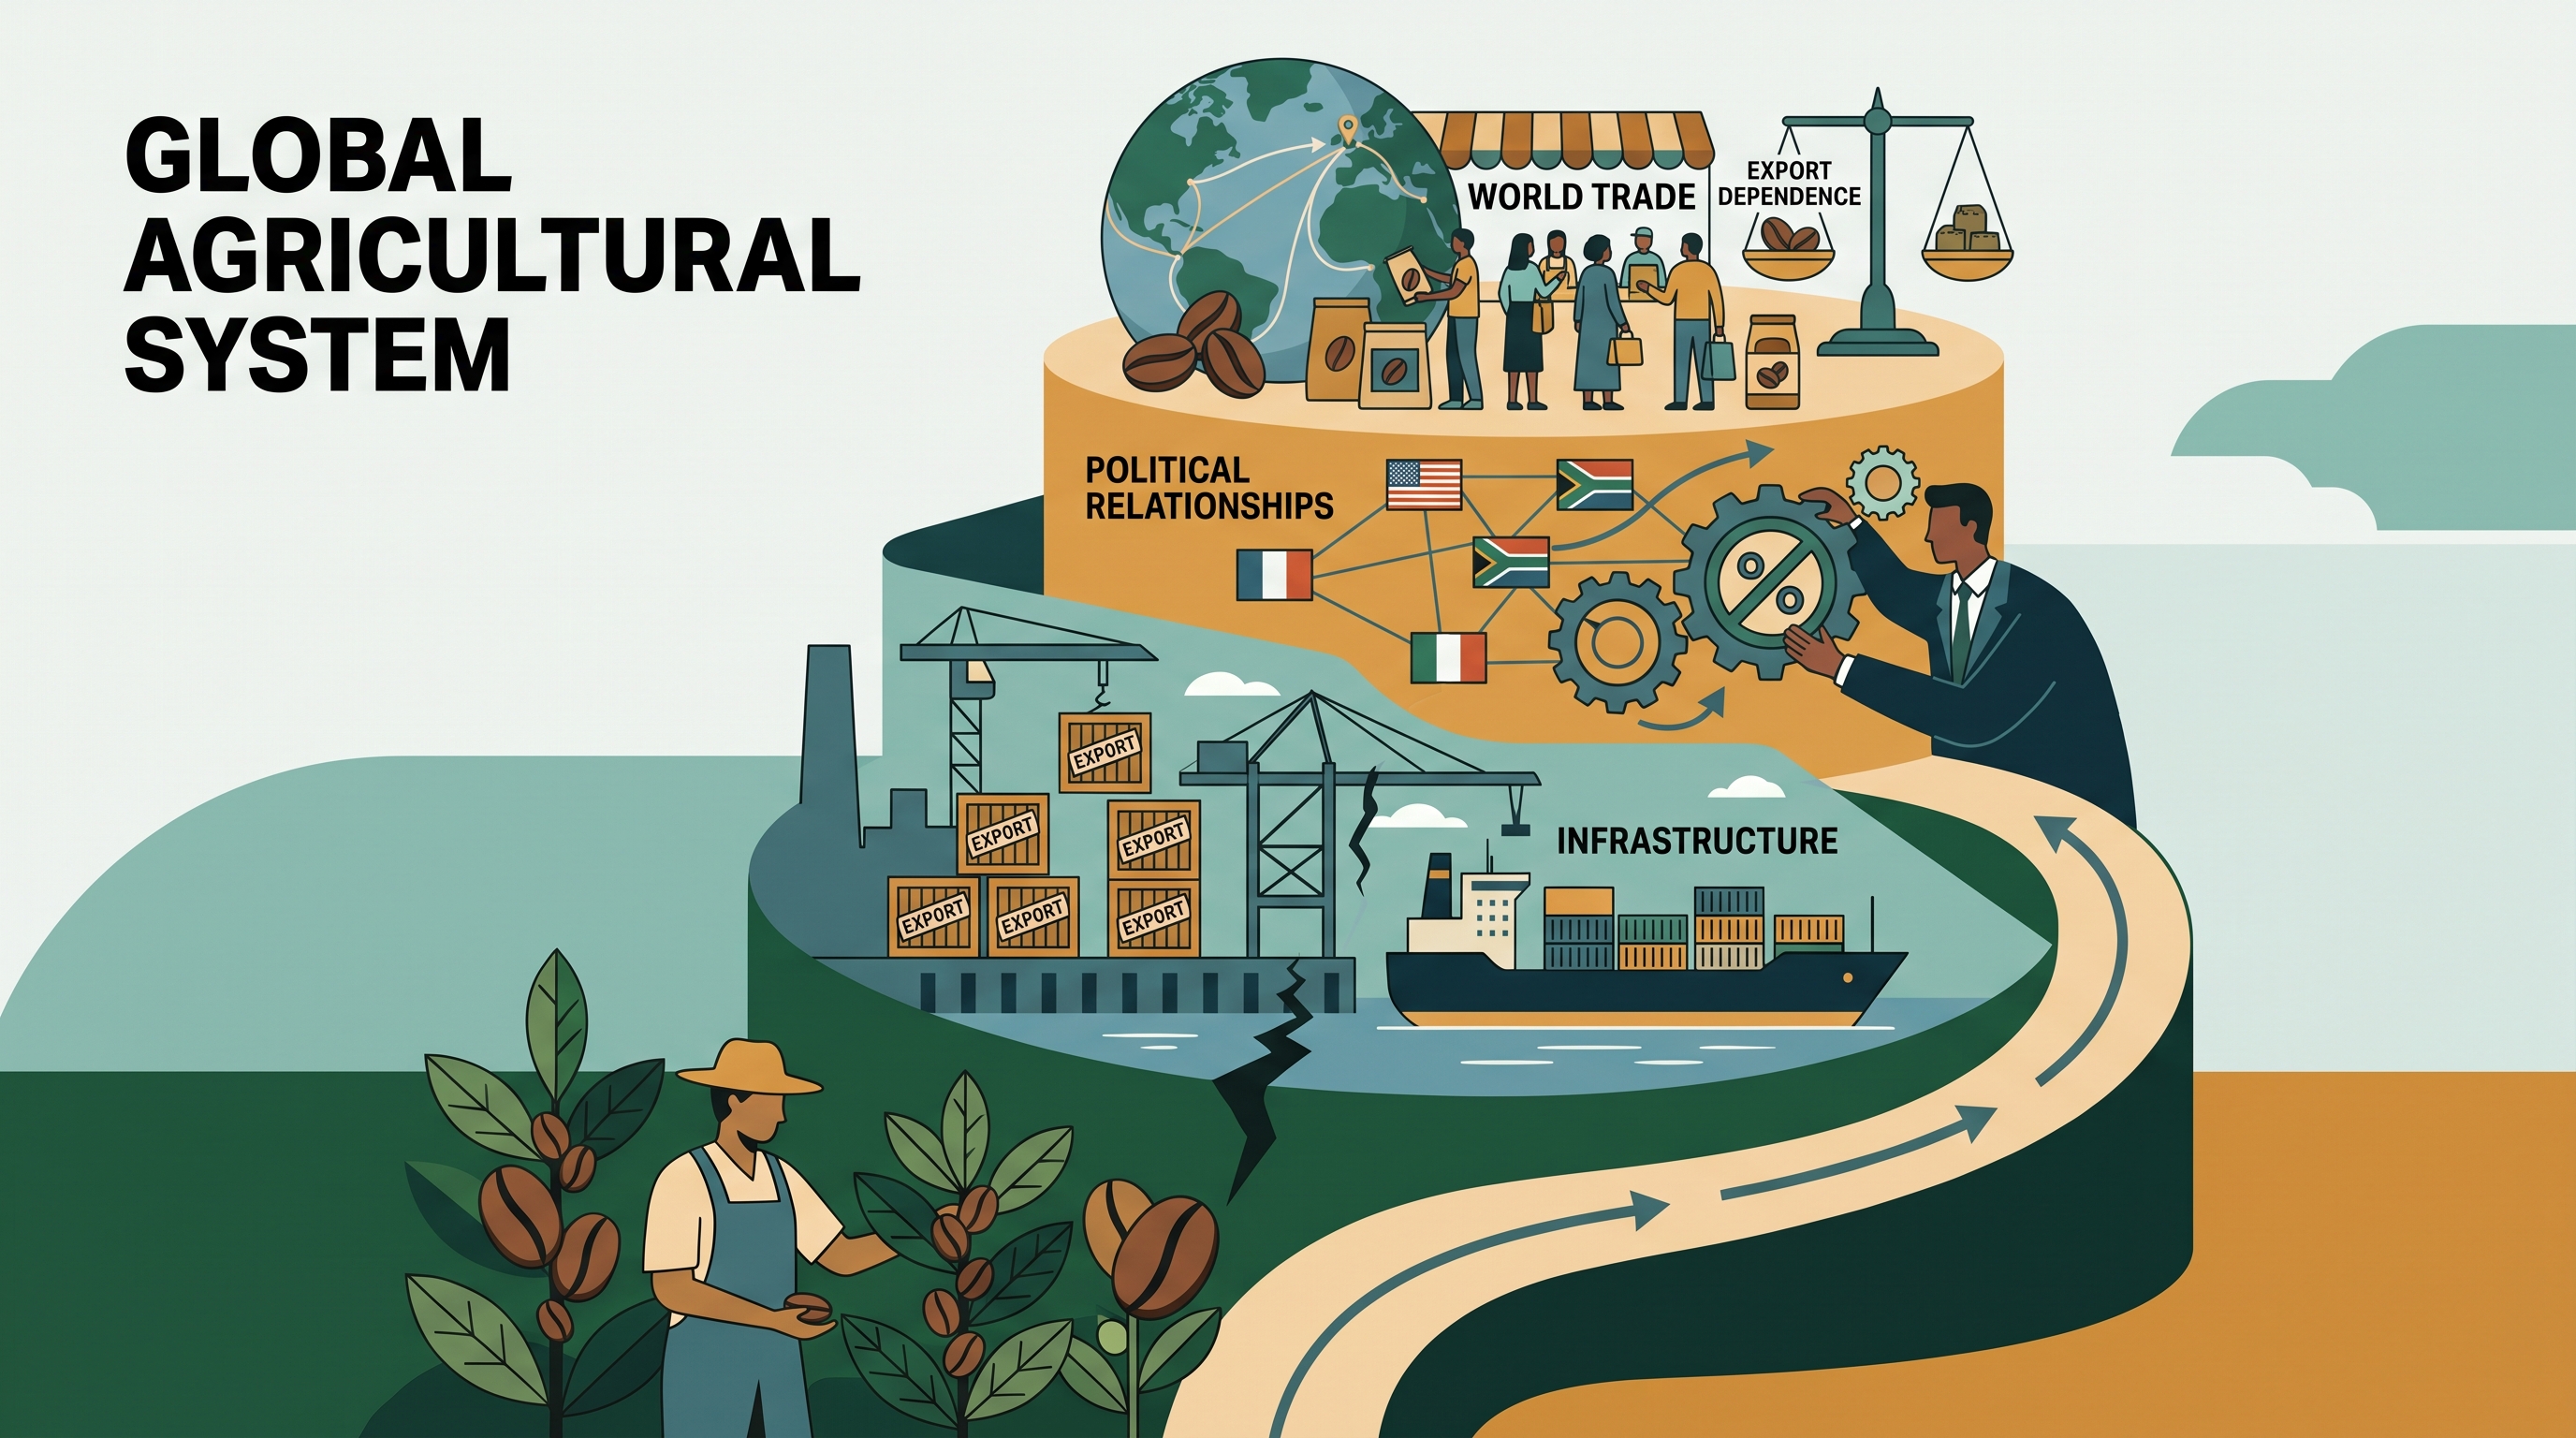



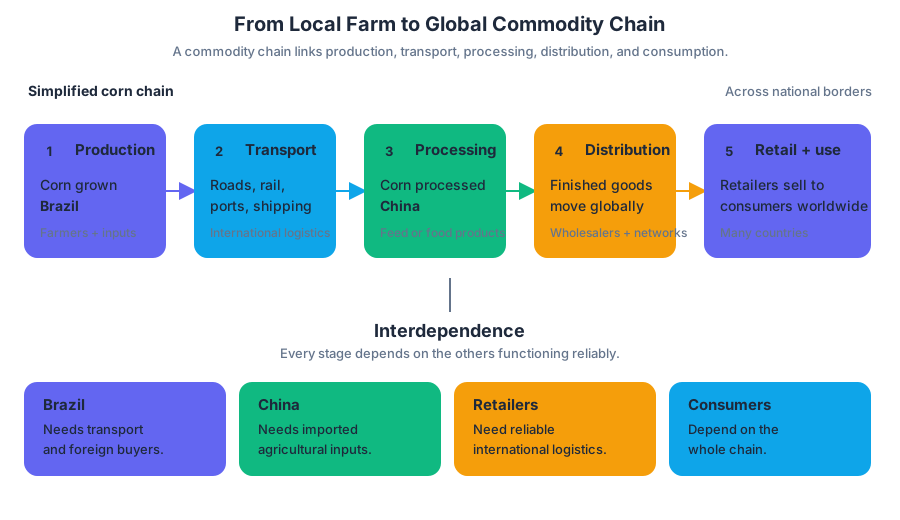
5.10 Consequences of Agricultural Practices
Key concepts: Environmental effects of agricultural land use · Pollution from agricultural practices · Agricultural land-cover change · Desertification · Soil salinization · Conservation efforts · Slash-and-burn agriculture · Terrace farming · Irrigation and water-resource use · Sustainable agricultural practices
Agriculture does not simply use landscapes; it actively reshapes them. A field may produce food while also changing vegetation, soil chemistry, water supplies, and local ecosystems.
5.10 Consequences of Agricultural Practices
Agriculture does not simply use landscapes; it actively reshapes them. A field may produce food while also changing vegetation, soil chemistry, water supplies, and local ecosystems. The central question is: when does agricultural production become environmental damage, and how can farming remain productive without exhausting the resources it depends on?
Learning Objective IMP-5.A: Explain how agricultural practices have environmental and societal consequences.
Essential Knowledge IMP-5.A.1: Environmental effects of agricultural land use include pollution, land-cover change, desertification, soil salinization, and conservation efforts. Essential Knowledge IMP-5.A.2: Agricultural practices—including slash-and-burn, terraces, irrigation, deforestation, draining wetlands, shifting cultivation, and pastoral nomadism—alter the landscape.
How agricultural practices alter environments
Agricultural impacts often follow a chain: a farming method changes land or water, that change affects an environmental process, and the process creates consequences for people and ecosystems.
Worked example: irrigation and soil salinization
- Farmers divert river water or pump groundwater to irrigate crops.
- Some of the irrigation water evaporates, especially in hot, dry environments.
- The water leaves behind dissolved salts in the upper soil.
- Salt concentrations rise until crops have difficulty absorbing water.
- Soil fertility and agricultural productivity decline.
This process is called soil salinization, the accumulation of salts in soil that can reduce its ability to support crops. Irrigation can therefore increase food production in the short term while undermining future production if drainage and water management are inadequate.
Environmental effects: a visual comparison
| Agricultural practice | Immediate purpose | Environmental consequence |
|---|---|---|
| Slash-and-burn agriculture | Clear land and release nutrients from vegetation ash | Deforestation, smoke pollution, and possible soil degradation when fallow periods become too short |
| Terrace farming | Create level planting surfaces on steep slopes | Can reduce erosion, but construction alters slopes and drainage |
| Irrigation | Supply crops with water | Water depletion and soil salinization |
| Deforestation | Expand farmland or pasture | Habitat loss, land-cover change, and increased erosion |
| Draining wetlands | Create fields or settlements | Loss of wetland habitat and reduced natural water storage |
| Shifting cultivation | Move cultivation as soil fertility declines | Can be sustainable with adequate fallow periods, but damaging when population pressure shortens the cycle |
| Pastoral nomadism | Move livestock between grazing areas | Can fit variable environments, but overgrazing may contribute to vegetation loss and desertification |
Desertification is the degradation of dryland environments so that land becomes less biologically productive. Overgrazing, removal of vegetation, drought, and poorly managed cultivation can expose soil to wind and water erosion. Desertification is not simply “a desert expanding”; it is a decline in the land’s capacity to support plants, animals, and people.
Pollution and land-cover change
Agriculture can pollute water, soil, and air. Chemical fertilizers and pesticides may enter streams through runoff, while animal operations can release waste into surrounding water systems. Smoke from slash-and-burn clearing affects air quality. These effects are spatial: pollution may begin on one farm but spread downstream or downwind.
Land-cover change occurs when one type of surface—such as forest, wetland, or grassland—is replaced by cropland or pasture. The change can increase food production, but it may also reduce biodiversity, alter water flow, and remove habitats. A map showing agricultural expansion is therefore not merely showing where farms are located; it may also reveal where ecological systems have been transformed.
Conservation and environmental sustainability
Environmental sustainability means meeting present needs while maintaining the resources and ecological conditions required in the future. Sustainable agriculture does not mean eliminating all environmental effects. It means reducing long-term damage while preserving productive capacity.
Several practices support this goal:
- Crop rotation varies crops across fields and can maintain soil fertility, interrupt pest cycles, and avoid large-scale environmental damage.
- Fallowing leaves farmland uncultivated temporarily so soil can recover.
- Erosion control—such as maintaining vegetation or using carefully designed terraces—helps conserve topsoil.
- Decreased irrigation reduces water demand and lowers the risk of salinization.
- Extracting less water from aquifers or groundwater resources helps protect local water supplies.
- Restoring environmentally damaged areas through sustainable agricultural practices can rebuild soil, vegetation, and local resource systems.
A common misconception is that shifting cultivation is automatically destructive. In reality, its environmental effects depend on the length of the fallow period and the pressure placed on the land. A long recovery period can allow vegetation and soil nutrients to regenerate; a shortened cycle may produce deforestation, erosion, and declining fertility.
Skill connection — 2.E Spatial Relationships: Explain how an agricultural practice changes a landscape and how that change produces environmental consequences. Strong geographic reasoning connects practice → process → outcome, rather than merely naming “pollution” or “desertification.”
Retrieval check: A dry region experiences falling crop yields after years of intensive irrigation. Identify the likely environmental process and explain the mechanism in one sentence. Then name one practice that could improve sustainability.
Answer: The process is soil salinization: evaporation leaves salts behind in the soil, reducing crop productivity. Decreasing irrigation, extracting less groundwater, improving drainage, rotating crops, fallowing, or controlling erosion could improve sustainability.
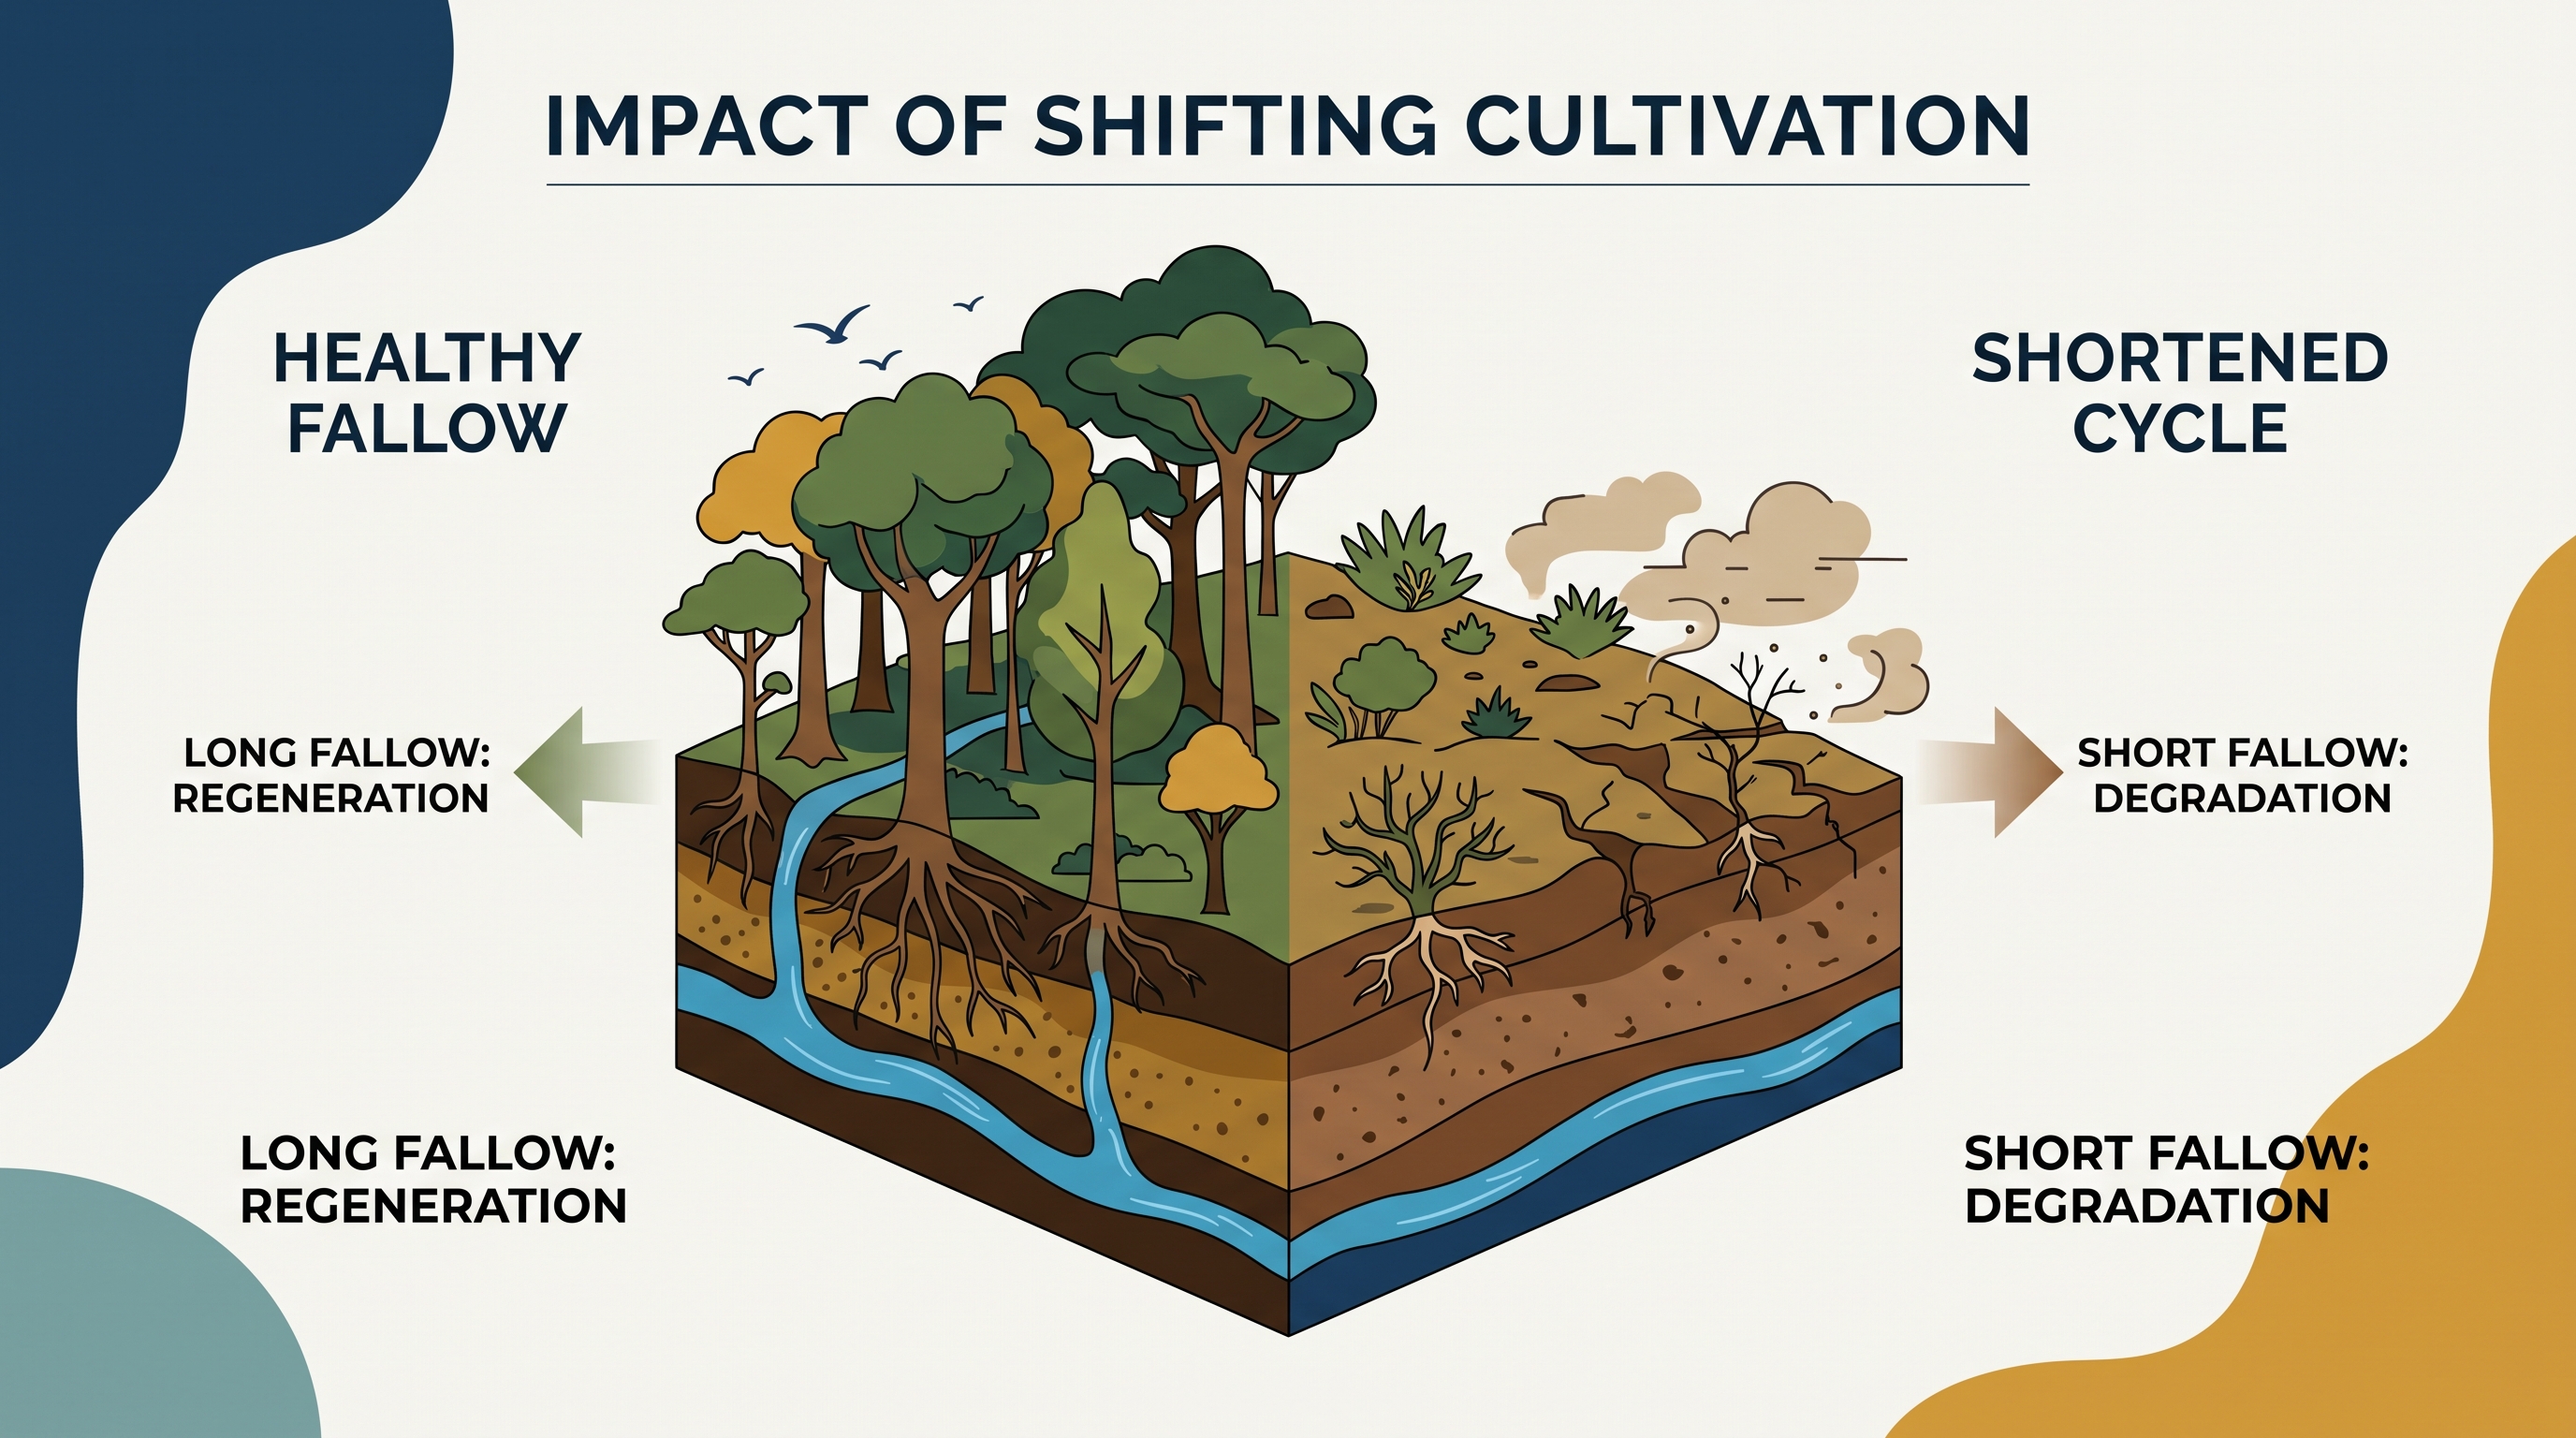
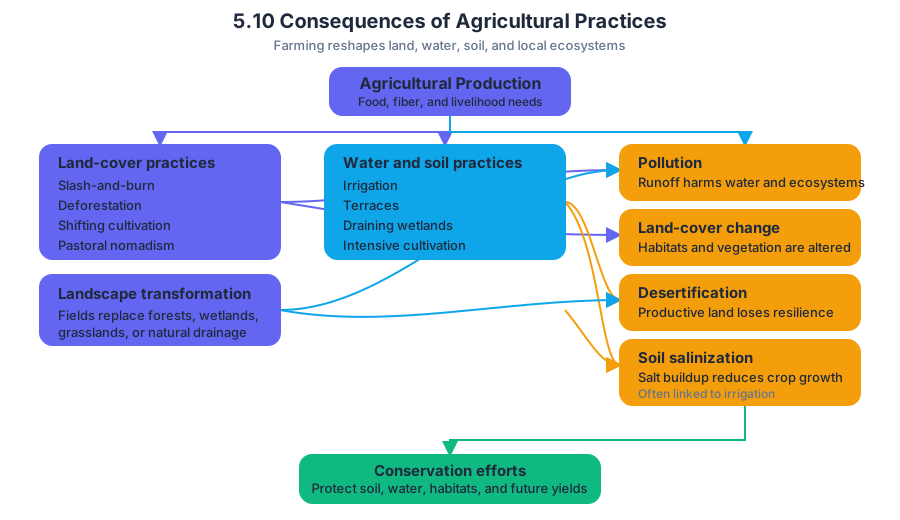
5.11 Challenges of Contemporary Agriculture
Key concepts: Contemporary agriculture · Agricultural production patterns · Agricultural consumption patterns · Environmental opportunities and challenges · Social opportunities and challenges · Economic opportunities and challenges · Cultural opportunities and challenges · Variation by location · Agricultural practices · IMP-5 enduring understanding
Agriculture is no longer shaped only by soil, climate, and traditional farming methods: biotechnology, global trade, aquaculture, and changing consumer preferences now connect farms, ecosystems, markets, and cultures across great distances.
5.11 Challenges of Contemporary Agriculture
Agriculture is no longer shaped only by soil, climate, and traditional farming methods: biotechnology, global trade, aquaculture, and changing consumer preferences now connect farms, ecosystems, markets, and cultures across great distances. The central geographic question is therefore: How can the same agricultural practice create an opportunity in one location and a challenge in another?
Enduring Understanding [IMP-5]: “Agricultural production and consumption patterns vary in different locations, presenting different environmental, social, economic, and cultural opportunities and challenges.”
The learning target for this topic is [IMP-5.B]: “Explain challenges and debates related to the changing nature of contemporary agriculture and food-production practices.” The suggested skill is 2.E Spatial Relationships, which asks students to explain how effectively a geographic concept, process, model, or theory explains effects in different contexts and regions of the world.
Production and consumption vary by location
Agricultural production patterns describe where and how food is produced. They vary because places differ in climate, water availability, land quality, labor costs, technology, infrastructure, government policy, and access to markets. Agricultural consumption patterns describe what people eat and how much they consume; these are influenced by income, culture, religion, prices, urbanization, advertising, and food availability.
For example, a coastal region may produce farmed shrimp because warm water, investment capital, and export ports make aquaculture—the commercial raising of aquatic organisms—profitable. Consumers in distant cities may purchase the shrimp because refrigerated transport and global trade make it available year-round. The same production system can create jobs and export income while also generating debates about water pollution, habitat conversion, labor conditions, and dependence on external markets.
A production map and a consumption map may therefore look very different. A country can produce large quantities of a crop for export while importing much of the food its population eats. This reflects agricultural interdependence: places rely on one another for food, inputs, technology, labor, or markets.
Contemporary innovations and environmental debates
[IMP-5.B.1] Agricultural innovations such as biotechnology, genetically modified organisms, and aquaculture can increase yields, improve resistance to pests or drought, and expand food production in locations with physical limitations. However, these innovations have generated debates over sustainability, soil and water usage, reductions in biodiversity, and extensive fertilizer use.
A genetically modified crop engineered to resist insects may reduce crop losses and lower the need for some insecticides. Yet if farmers plant one dominant variety across a large area, biodiversity may decline, and pests may eventually adapt. The geographic effect depends on scale and context: a practice that improves food security for a farm or region may create ecological vulnerability across a larger landscape.
Key distinction: “More food” is not automatically the same as “more sustainable food.” Sustainability requires considering long-term environmental effects alongside immediate production gains.
Social and cultural opportunities and challenges
Agriculture creates social opportunities through employment, rural services, food access, and community stability. It can also produce social challenges when land consolidation displaces small farmers, when agricultural labor is poorly protected, or when unequal access to land, irrigation, machinery, seeds, and credit prevents some groups from benefiting from innovation.
Agriculture also has cultural consequences. Food preferences, religious restrictions, livestock traditions, and regional cuisines influence what farmers produce and what consumers demand. Global food systems can broaden choices and spread crops, cooking styles, and technologies, but they may also weaken local food traditions or replace culturally important crops with profitable export commodities.
Economic opportunities and trade-offs
Agricultural specialization can generate export earnings, attract processing industries, and connect rural producers to global markets. It can also expose producers to price swings, trade restrictions, transportation costs, and unequal bargaining power between farmers, corporations, and retailers.
Consider a region that shifts from subsistence grains to an export fruit. Higher-value exports may increase household income and foreign exchange earnings. However, local residents may then face higher food prices or shortages if land and water are redirected toward exports. The economic benefit is real, but its distribution—and its effect on local consumption—must be analyzed.
A spatial-analysis method
To apply 2.E Spatial Relationships, connect the practice to its geographic effects rather than listing advantages and disadvantages:
- Identify the practice: for example, aquaculture, biotechnology, or export-oriented farming.
- Locate its production and consumption: ask where inputs, products, workers, and consumers are situated.
- Compare contexts: examine how the effects differ between local, regional, national, and global scales.
- Explain the relationship: connect the practice to environmental, social, economic, and cultural outcomes.
Named misconception check — “One practice has one universal effect.” Agricultural practices do not produce identical outcomes everywhere. Irrigation may support food production in a dry region, but excessive withdrawal can deplete groundwater; export farming may raise incomes, but it can also increase local food insecurity. Strong geographic explanations specify where, for whom, and at what scale an effect occurs.
Retrieval check: A region adopts high-yield seeds and expands fertilizer use to increase food exports. Name one environmental opportunity, one environmental challenge, and one economic or social challenge. Then explain why the balance of effects might differ between the producing region and the consumers’ region.
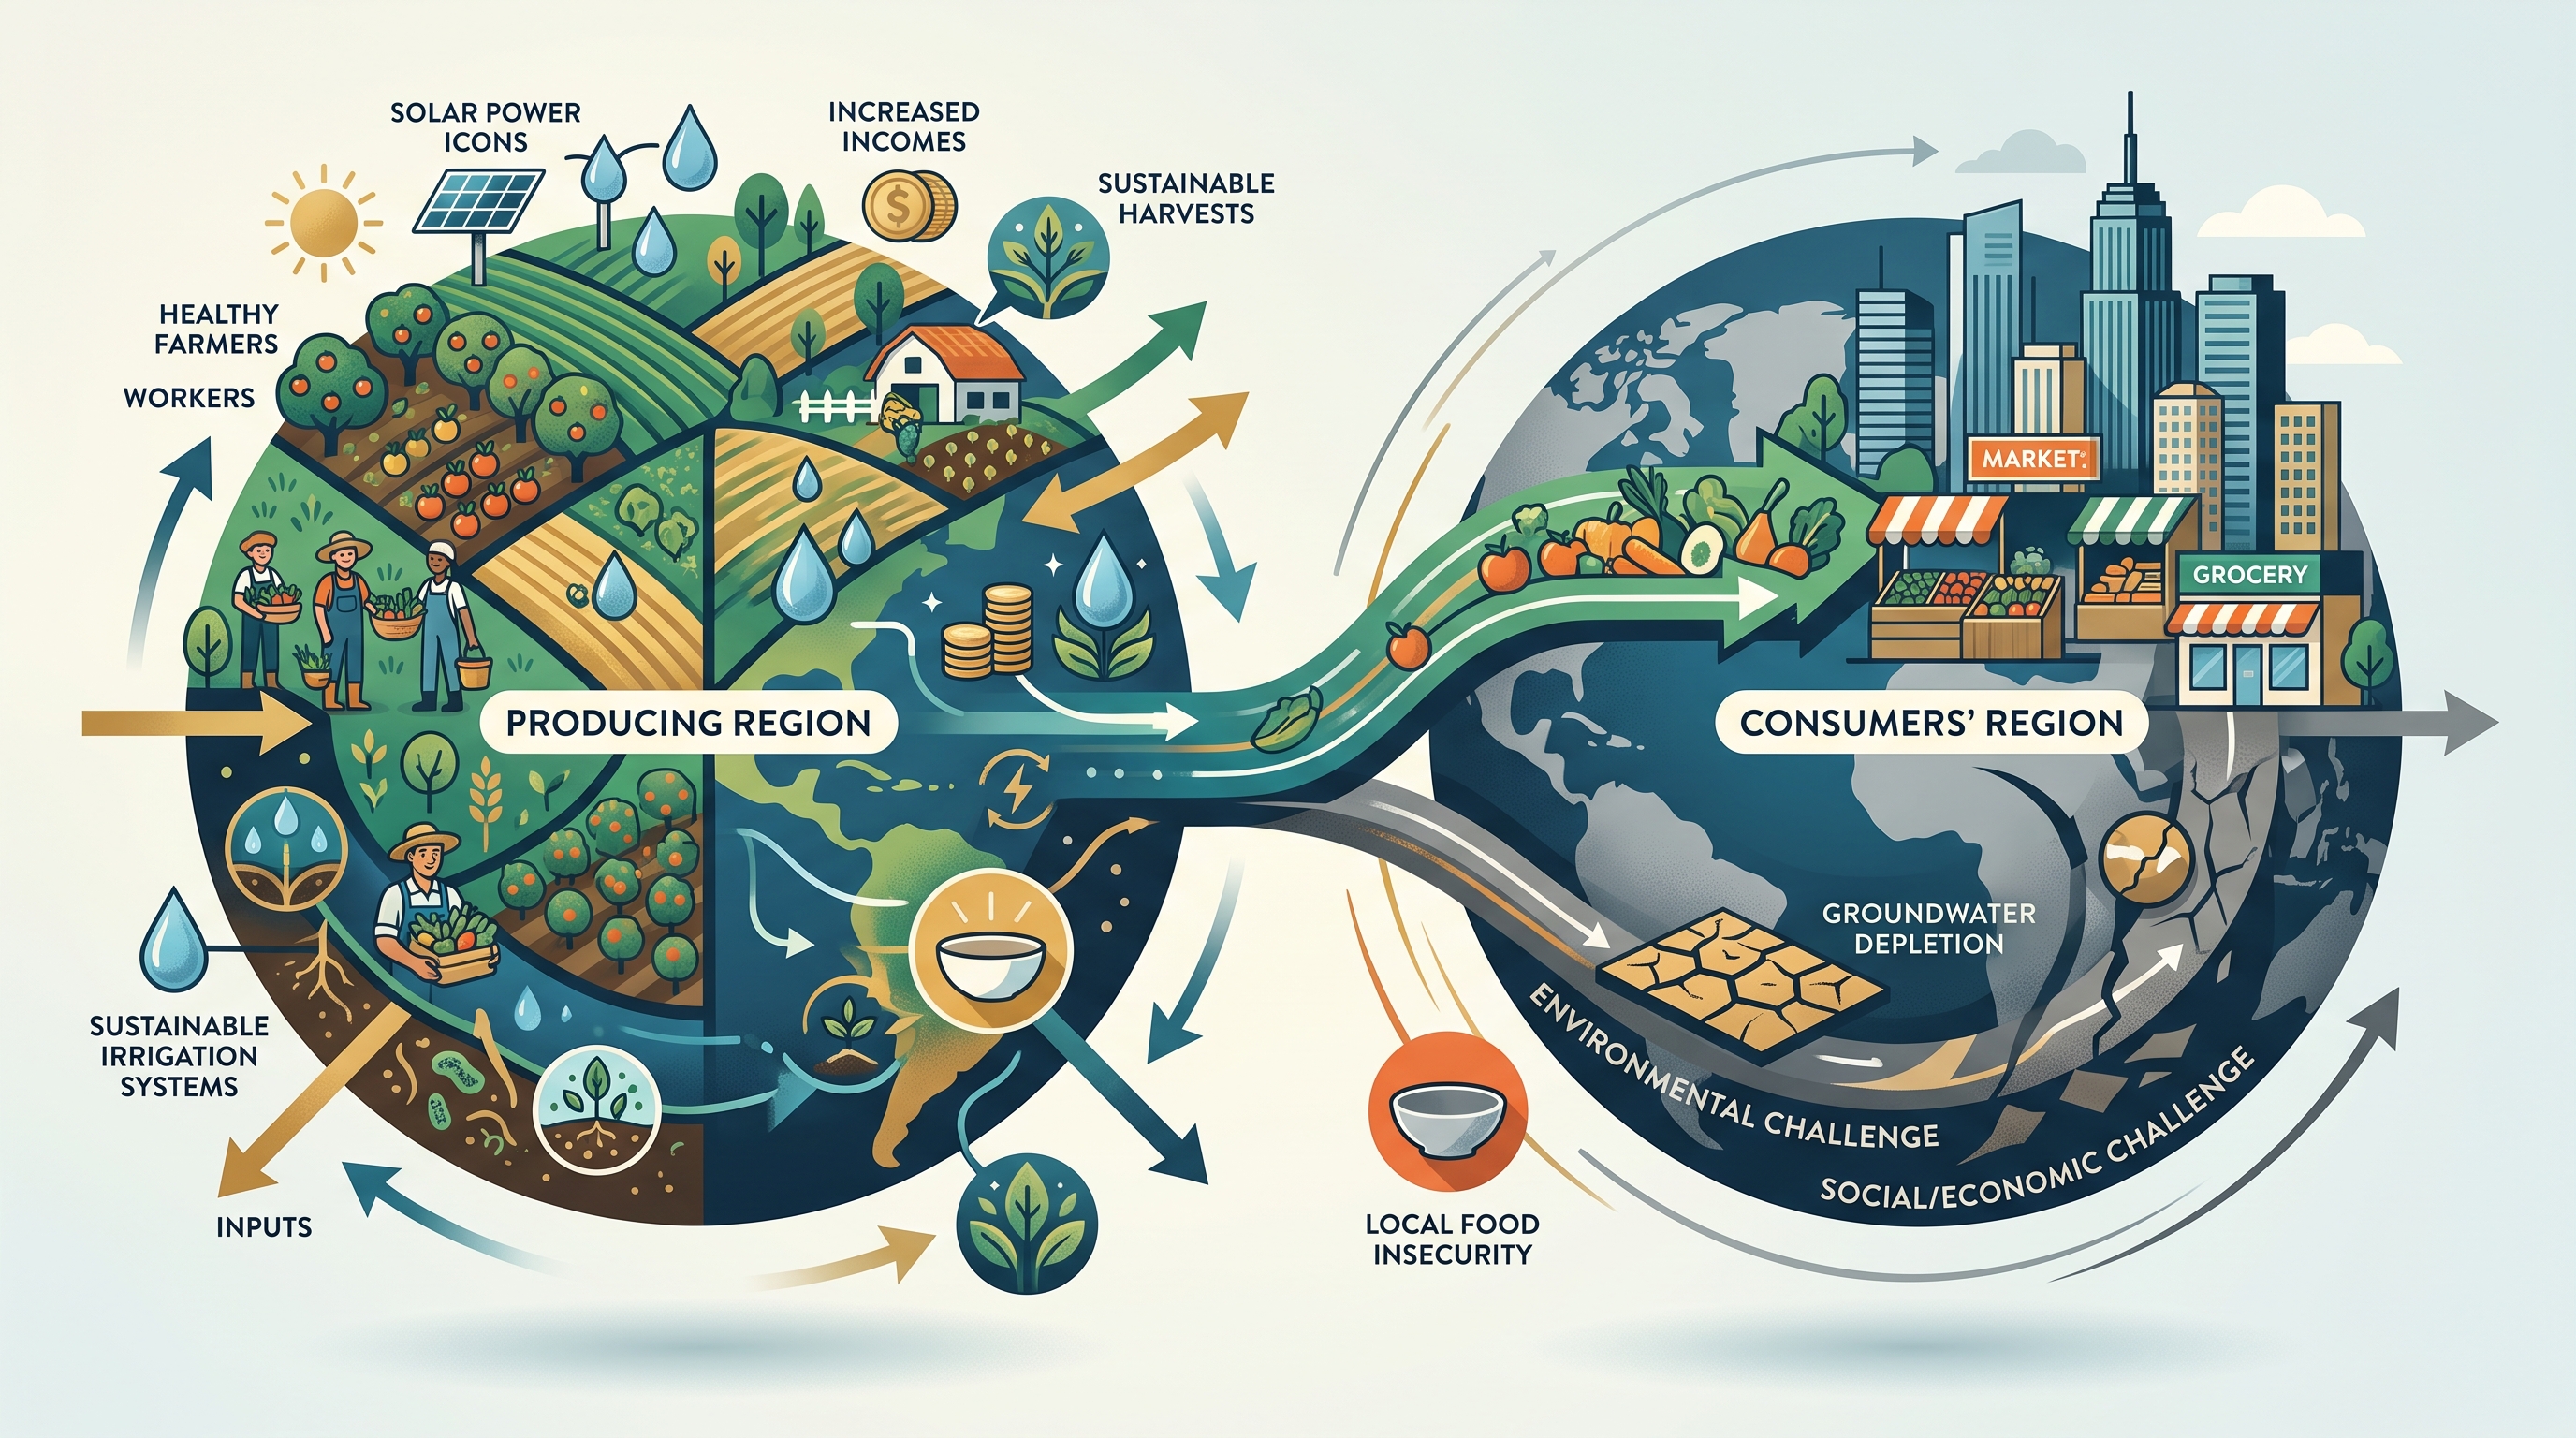
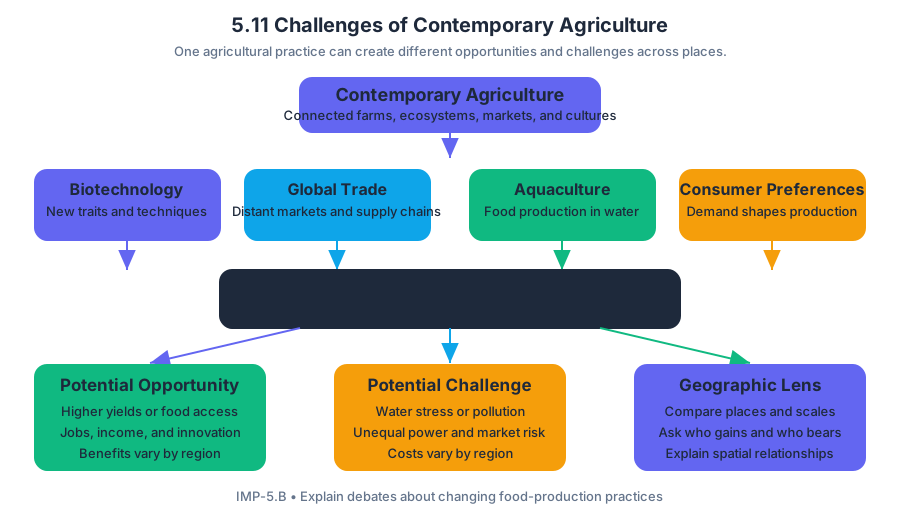
6.1 The Origin and Influences of Urbanization
Key concepts: Urbanization · Population growth · Economic growth and industrialization · Infrastructure · Quality of life · Transportation and communication systems · Government development policies · Zoning and urban planning · Informal settlements · Urban governance
Urbanization is the increasing share of a population living in urban areas, together with the physical expansion and growing importance of cities. A city rarely grows for just one reason: people, jobs, infrastructure, government decisions, and connections to other places reinforce one another.
6.1 The Origin and Influences of Urbanization
Urbanization is the increasing share of a population living in urban areas, together with the physical expansion and growing importance of cities. A city rarely grows for just one reason: people, jobs, infrastructure, government decisions, and connections to other places reinforce one another.
Why cities begin and continue to grow
Population growth can drive urbanization because a larger population creates greater demand for housing, schools, healthcare, utilities, shops, transportation, and other urban services. Growth may come from natural increase—births exceeding deaths—or from migration into cities. When rural residents move to cities for employment, education, or services, the urban population can increase even if the country’s total population grows slowly.
Economic growth, trade, and industrialization also pull people and investment toward cities. Factories, offices, ports, financial institutions, universities, and commercial districts tend to cluster because businesses benefit from access to workers, customers, suppliers, transportation, and information. As employment expands, metropolitan areas—large urban regions made up of a central city and connected surrounding communities—often grow beyond the original city boundary.
The process is therefore circular:
- New jobs attract workers.
- More workers increase demand for housing and services.
- New businesses serve the growing population.
- Tax revenue and investment support additional infrastructure.
- Better connections and services attract still more people and firms.
This feedback loop explains why a small settlement near a productive port, factory zone, or transportation junction can become a major urban center. Its situation—its location relative to other places—can influence its function and growth by connecting it to markets, resources, labor, and flows of goods.
Transportation, communication, and access
Transportation and communication systems make urban growth possible across distance. Roads, railways, ports, airports, electricity networks, internet connections, and mobile communications connect people to jobs, goods, education, healthcare, and government services. A new railway station, for example, can make a previously peripheral area attractive for factories, warehouses, housing, and retail.
These systems do not simply respond to urbanization; they also shape its pattern. Highways may encourage outward expansion and suburban development, while rail stations may concentrate dense growth around transit corridors. Digital communication can connect firms and workers across regions, but it does not eliminate the importance of physical infrastructure such as power, water, roads, and sanitation.
Government, planning, and the geography of growth
Government development policies, zoning, and urban planning influence where and how cities expand. Zoning divides land into permitted uses—such as residential, commercial, industrial, agricultural, or protected open space. Planning decisions can encourage compact development near transit, preserve green space, separate hazardous industries from homes, or direct investment toward neglected districts.
Planning can also produce unequal outcomes. If authorities extend utilities and roads to one district while leaving another without reliable water or public transportation, the location of infrastructure affects who can reach opportunity. Urban growth is not automatically orderly or equitable; it reflects political choices about land, investment, and access.
Infrastructure and quality of life
Infrastructure is the basic physical and organizational system that supports daily life, including roads, water pipes, sewers, electrical grids, schools, hospitals, commercial buildings, and waste-management systems. Its quality and location directly affect societal development and quality of life, meaning people’s access to conditions that support health, safety, education, employment, and well-being.
High-quality schools improve educational opportunity. Healthcare facilities and clean-water systems promote public health and sanitation. Commercial buildings, reliable utilities, and transportation allow residents to reach jobs, goods, and services. Infrastructure is therefore more than construction: it determines whether urban residents can participate fully in economic and social life.
When urban growth outruns urban capacity
Rapid urbanization occurs when urban populations or built-up areas grow faster than institutions and infrastructure can adapt. The result may include shortages of food, water, and energy; loss of green space; traffic congestion; pollution; inadequate sanitation; and informal settlements such as slums. Aging pipes, unreliable electricity, limited housing, and ineffective governance can turn ordinary urban growth into serious health and maintenance problems.
For example, imagine a metropolitan area whose population rises sharply after a new industrial zone opens. If jobs expand but water treatment, housing construction, and public transportation do not, workers may settle in informal neighborhoods near employment. The city has experienced economic growth, but inadequate infrastructure prevents that growth from producing equal improvements in quality of life.
Worked geographic reasoning
Suppose City A’s population increases by $30%$ after factories and a rail terminal are built, while City B grows by only $5%$ because it has fewer new jobs and weaker transportation links. A strong explanation connects the variables rather than merely naming them: industrialization creates employment; rail access connects workers and goods; population growth increases demand for housing and services; and government planning determines whether infrastructure keeps pace.
This explanation applies PSO-6.A.2 by linking the spatial organization of urban growth to transportation, infrastructure, policy, and situation. It also uses Skill 2.C (Spatial Relationships) to explain how places and systems are connected, and Skill 3.D (Data Analysis) when evidence from a table or graph is used to support a claim. SPS-6.B.1 becomes visible when rapid growth produces societal changes such as informal settlements, resource shortages, or unequal access.
Misconception check
Misconception: “Urbanization means only that a city’s population increases.” Population growth is one driver, but urbanization also involves changing land use, expanding metropolitan influence, increasing economic activity, and transforming transportation and service networks. A city can grow through migration and industrialization, while a rapidly growing population can still experience declining quality of life if infrastructure and governance fail to keep pace.
Retrieval check
A city gains factories and a highway, attracts migrants, and then develops water shortages and informal settlements. Identify one driver of urbanization, one system that supported its growth, and one consequence of growth exceeding infrastructure capacity. A complete answer should connect each factor through cause and effect rather than listing three unrelated terms.
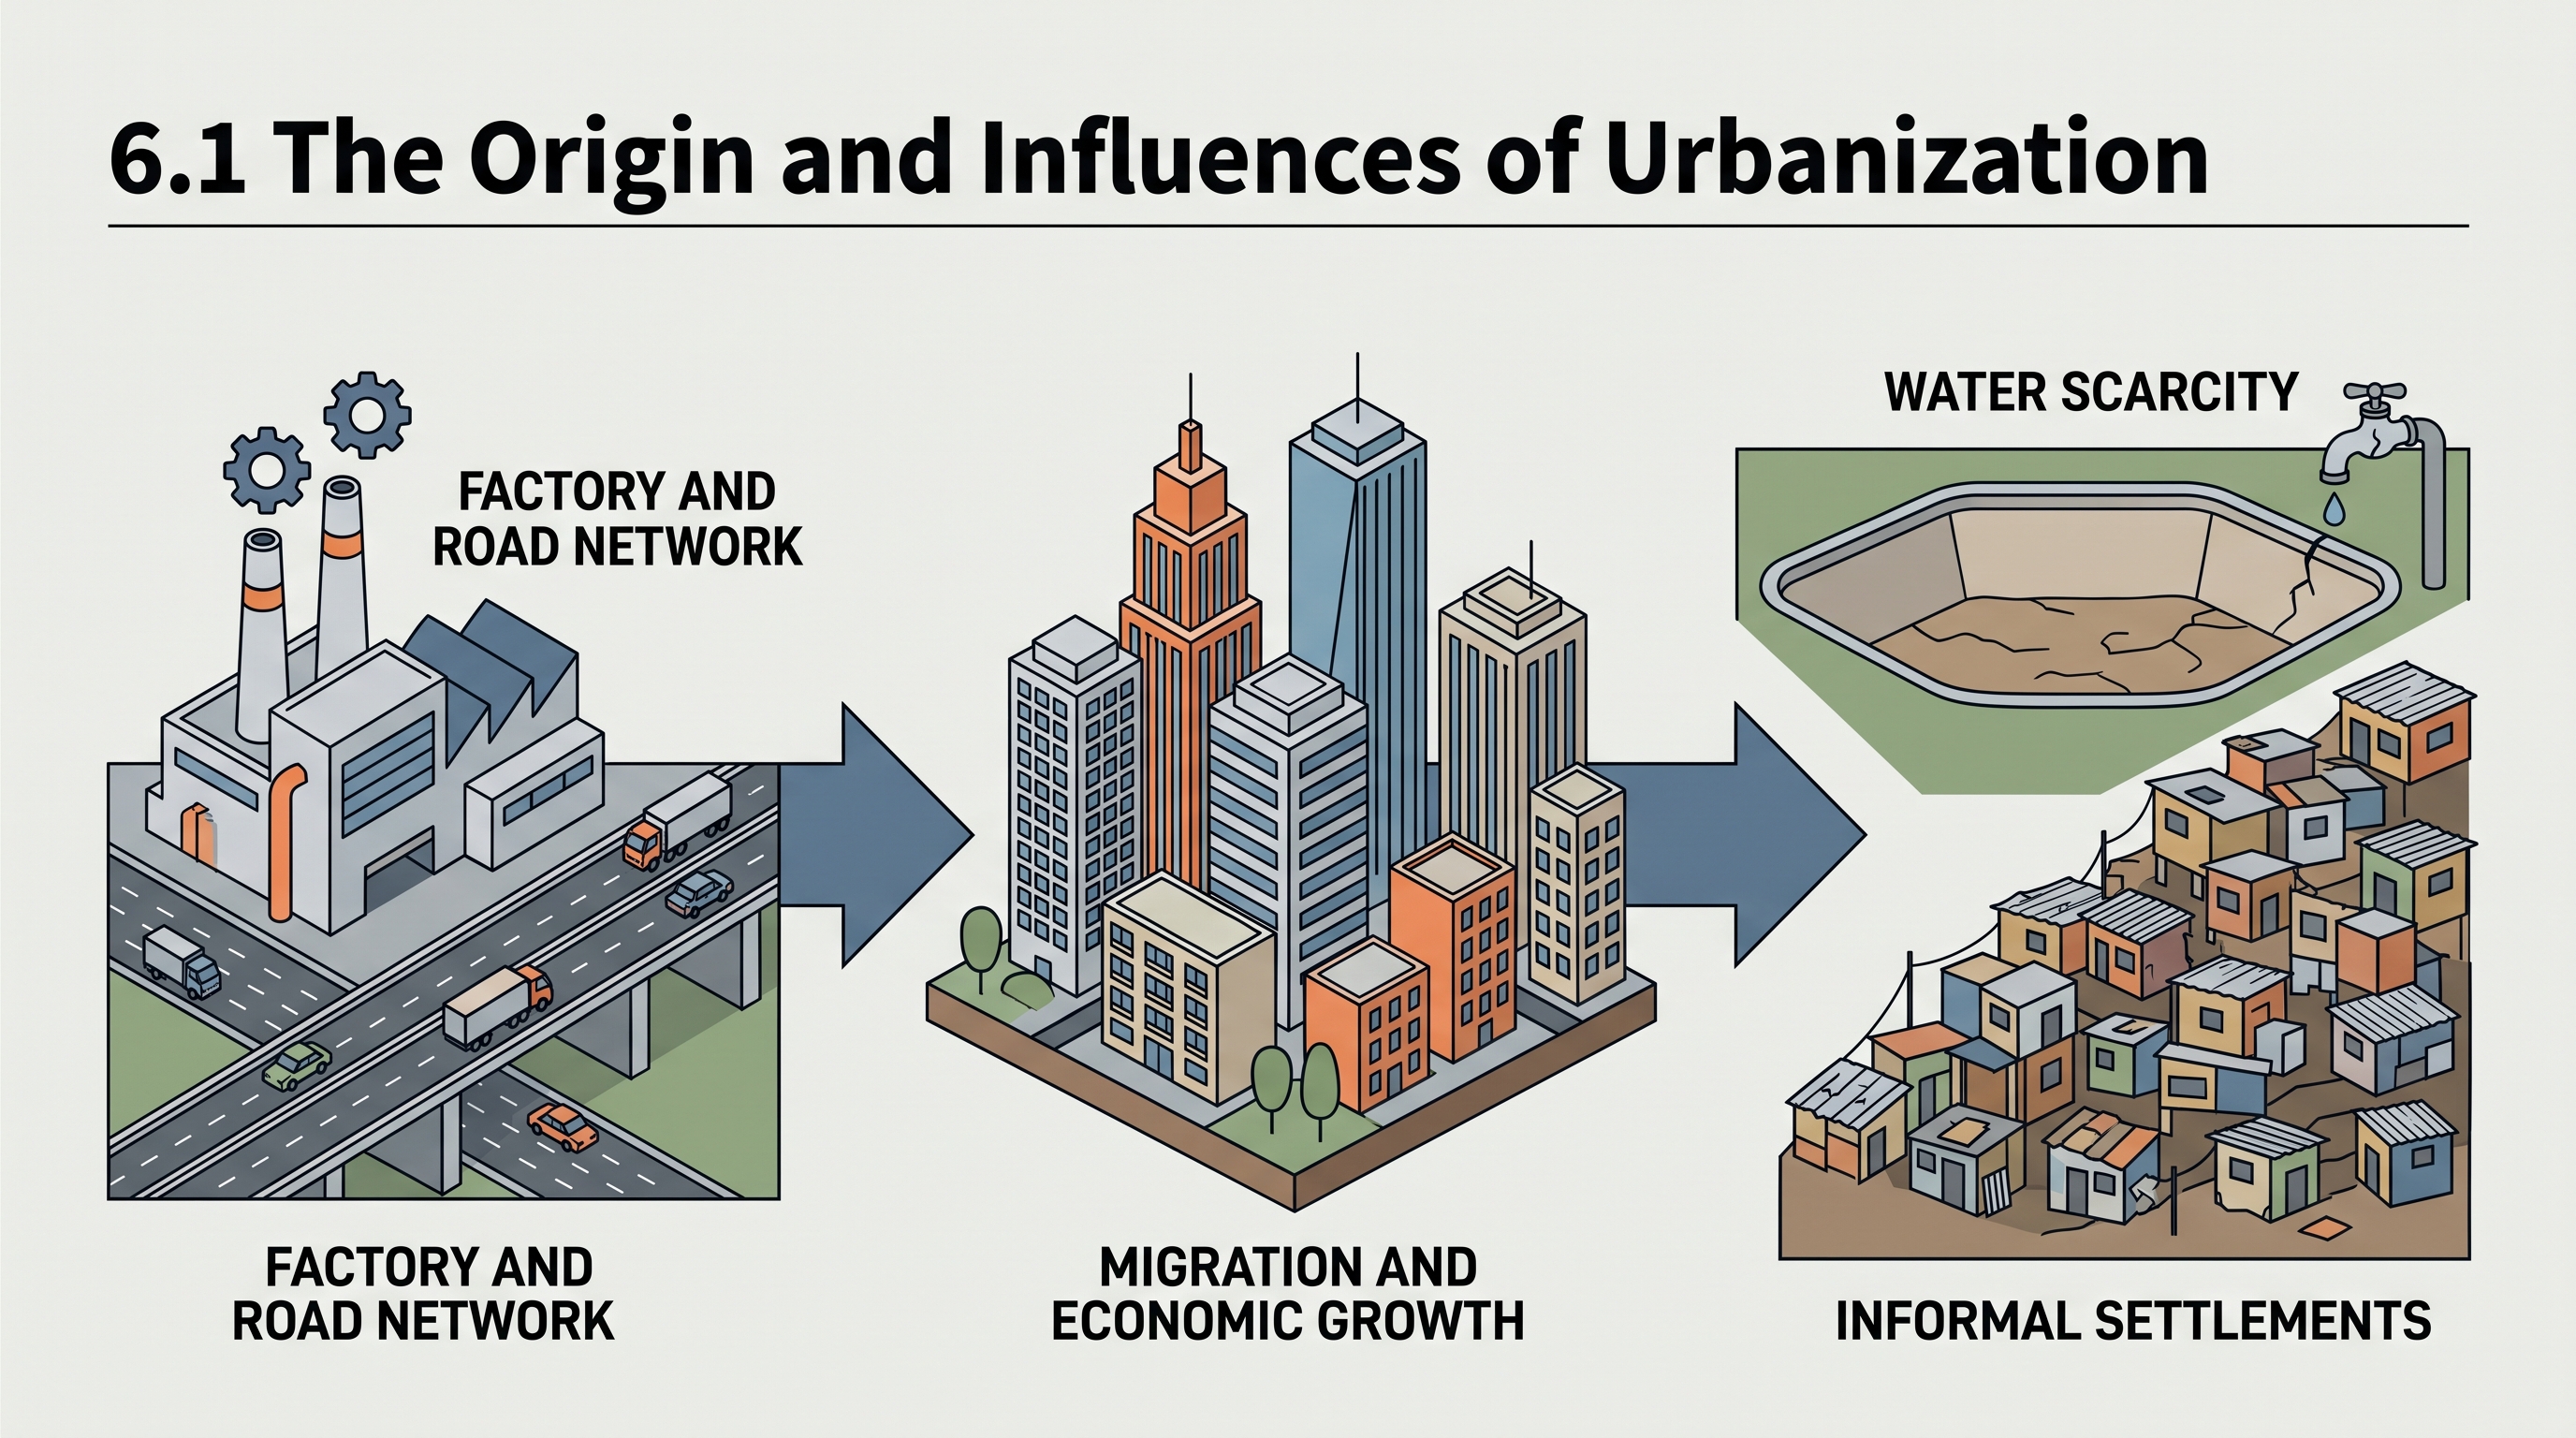
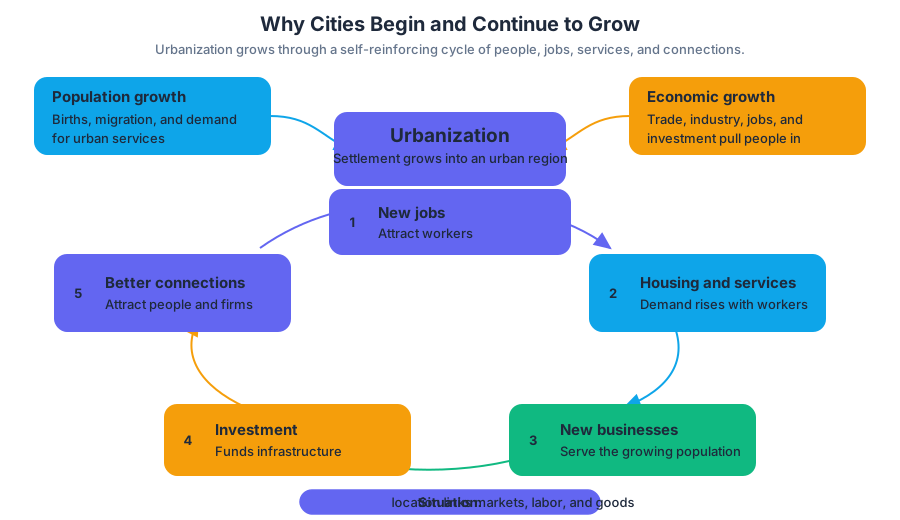
6.2 Cities Across the World
Key concepts: Cities across the world · Urbanization · Suburbanization · Edge cities · Exurbs · Urbanism · Greenbelts · Slow-growth cities · Sustainable urban options · Spatial relationships and geographic similarities and differences
A city is not simply a large settlement: it is a spatial concentration of people, activities, institutions, and connections whose form reflects both physical geography and human choices.
6.2 Cities Across the World
A city is not simply a large settlement: it is a spatial concentration of people, activities, institutions, and connections whose form reflects both physical geography and human choices. The same process—urbanization—can produce a dense metropolitan core in one region, a sprawling highway corridor in another, or a rapidly expanding megacity in a peripheral country.
PSO-6 — Enduring Understanding: The presence and growth of cities vary across geographical locations because of physical geography and resources.
Urbanization, suburbanization, and urbanism
Urbanization is the growth in the number and share of people living in urban areas, accompanied by the expansion of urban land uses and urban economies. It changes not only population distribution but also employment, transportation, housing, political influence, and access to services.
Suburbanization is the movement of people, residences, businesses, and services from a central city toward surrounding areas. It often results from rising incomes, automobile ownership, improved roads, desire for larger homes, perceived safety, or the search for lower-density environments. When development spreads outward in a discontinuous or low-density pattern, it is called sprawl; when activities and decision-making move away from the historic central city, the process is decentralization.
Urbanism means the patterns of social life, culture, institutions, and human interaction shaped by urban environments. Dense apartment districts may encourage frequent encounters, public transit, and mixed cultural exchange, while automobile-oriented suburbs may produce more private, household-centered routines. Urbanism therefore differs among city forms: the physical layout of a city helps shape how people work, socialize, obtain services, and participate in public life.
New urban forms created by outward growth
PSO-6.A — Learning Objective: Explain the processes that initiate and drive urbanization and suburbanization. Suburbanization and sprawl do not merely enlarge an existing city; they create new land-use forms with distinct relationships to the central city.
- An edge city is a concentrated node of offices, retail, entertainment, and other economic activity that develops on the outskirts of a metropolitan area, often near major highways. It may have more jobs and commercial space than housing and can function as a secondary urban center.
- An exurb is a lower-density settlement beyond the suburbs. Exurbs remain connected to a metropolitan economy but are more distant, less urban in appearance, and often dependent on long-distance commuting.
- A boomburb is a rapidly growing suburban municipality that becomes city-sized in population but may lack the traditional downtown, density, or historic identity of an older central city.
- A greenbelt is a band of open or protected land surrounding or separating urbanized areas. It can limit outward expansion, preserve farmland or ecosystems, and create a sharper boundary between city and countryside.
- A slow-growth city is a city or municipality that deliberately restricts or moderates development through land-use regulations, growth limits, zoning, or infrastructure controls.
The forms can be read as a spatial sequence:
central city → suburbs → edge city → exurbs → rural or protected land
This sequence is not universal. A greenbelt may interrupt it, a new edge city may rival the historic core, and a slow-growth policy may redirect development into neighboring jurisdictions rather than eliminate regional growth.
Cities in different world regions
PSO-6.A.3 — Essential Knowledge: Megacities and metacities are distinct spatial outcomes of urbanization increasingly located in countries of the periphery and semiperiphery. A megacity is an urban agglomeration with at least $10$ million residents. A metacity is an even larger urban agglomeration, generally exceeding $20$ million residents. These categories describe population scale, not automatically wealth, density, governance quality, or sustainability.
Cities in core regions often have older infrastructure, established suburban systems, and slower population growth, although they may experience redevelopment, immigration, or renewed central-city growth. Cities in semiperipheral and peripheral regions may grow much faster because of rural-to-urban migration, natural increase, industrial expansion, and concentration of education, employment, health care, and government services. Rapid growth can generate innovation and opportunity, but it can also outpace housing, sanitation, transportation, and formal employment.
Worked comparison: Imagine comparing a mature core-region metropolitan area with a rapidly growing peripheral-region megacity. The core-region city may show a historic central business district, extensive suburbs, edge cities, and a regulated greenbelt. The peripheral-region city may show a dense formal core beside informal housing, intense migration inflows, and expanding infrastructure at the urban edge. Both are urbanizing, but their different rates of growth, resource access, governance capacity, and physical settings produce different landscapes and challenges.
Social change, livability, and sustainability
Changing social values influence urban form. Preferences for privacy, larger homes, environmental protection, cultural amenities, safety, or walkable neighborhoods can shift demand toward suburbs, exurbs, compact central districts, or protected greenbelts. Access to universities, jobs, hospitals, and reliable transportation also attracts people and investment, reinforcing particular urban locations.
Options for improving urban livability—the quality, safety, accessibility, and comfort of daily life—include reliable public transit, affordable housing, mixed-use neighborhoods, pedestrian infrastructure, parks, clean water, effective waste systems, and equitable access to schools and health care. Sustainability requires weighing present needs against long-term environmental and social effects, such as energy use, congestion, air pollution, water demand, and loss of farmland.
Applying spatial relationships
2.D — Spatial Relationships: Explain the significance of geographic similarities and differences among different locations and/or at different times. To apply this skill, do more than state that two cities are “similar” or “different.” Identify a pattern, connect it to a geographic process, and explain why location, resources, scale, or regional position produces the outcome.
The urban-growth-of-cities resource can be analyzed as a visual record of these processes. Look for the direction of expansion, changes in density, the appearance of peripheral development, transportation corridors, and remaining open land. Then ask: Is growth compact or sprawling? Is the city connected to a greenbelt? Are new districts functioning as edge cities? Does the pattern suggest a core, semiperipheral, or peripheral urban context?
Misconception check: A megacity is not automatically a “global city,” and suburbanization does not mean that the entire population leaves the central city. These terms describe different dimensions: population scale, global economic connections, and the relocation or decentralization of urban activities.
Retrieval check: A metropolitan region contains a historic downtown, a highway-centered office-and-retail cluster, distant low-density settlements, and a protected ring of open land. Identify the edge city, exurbs, and greenbelt, then explain one way this arrangement could affect urbanism and one policy that could improve sustainability.
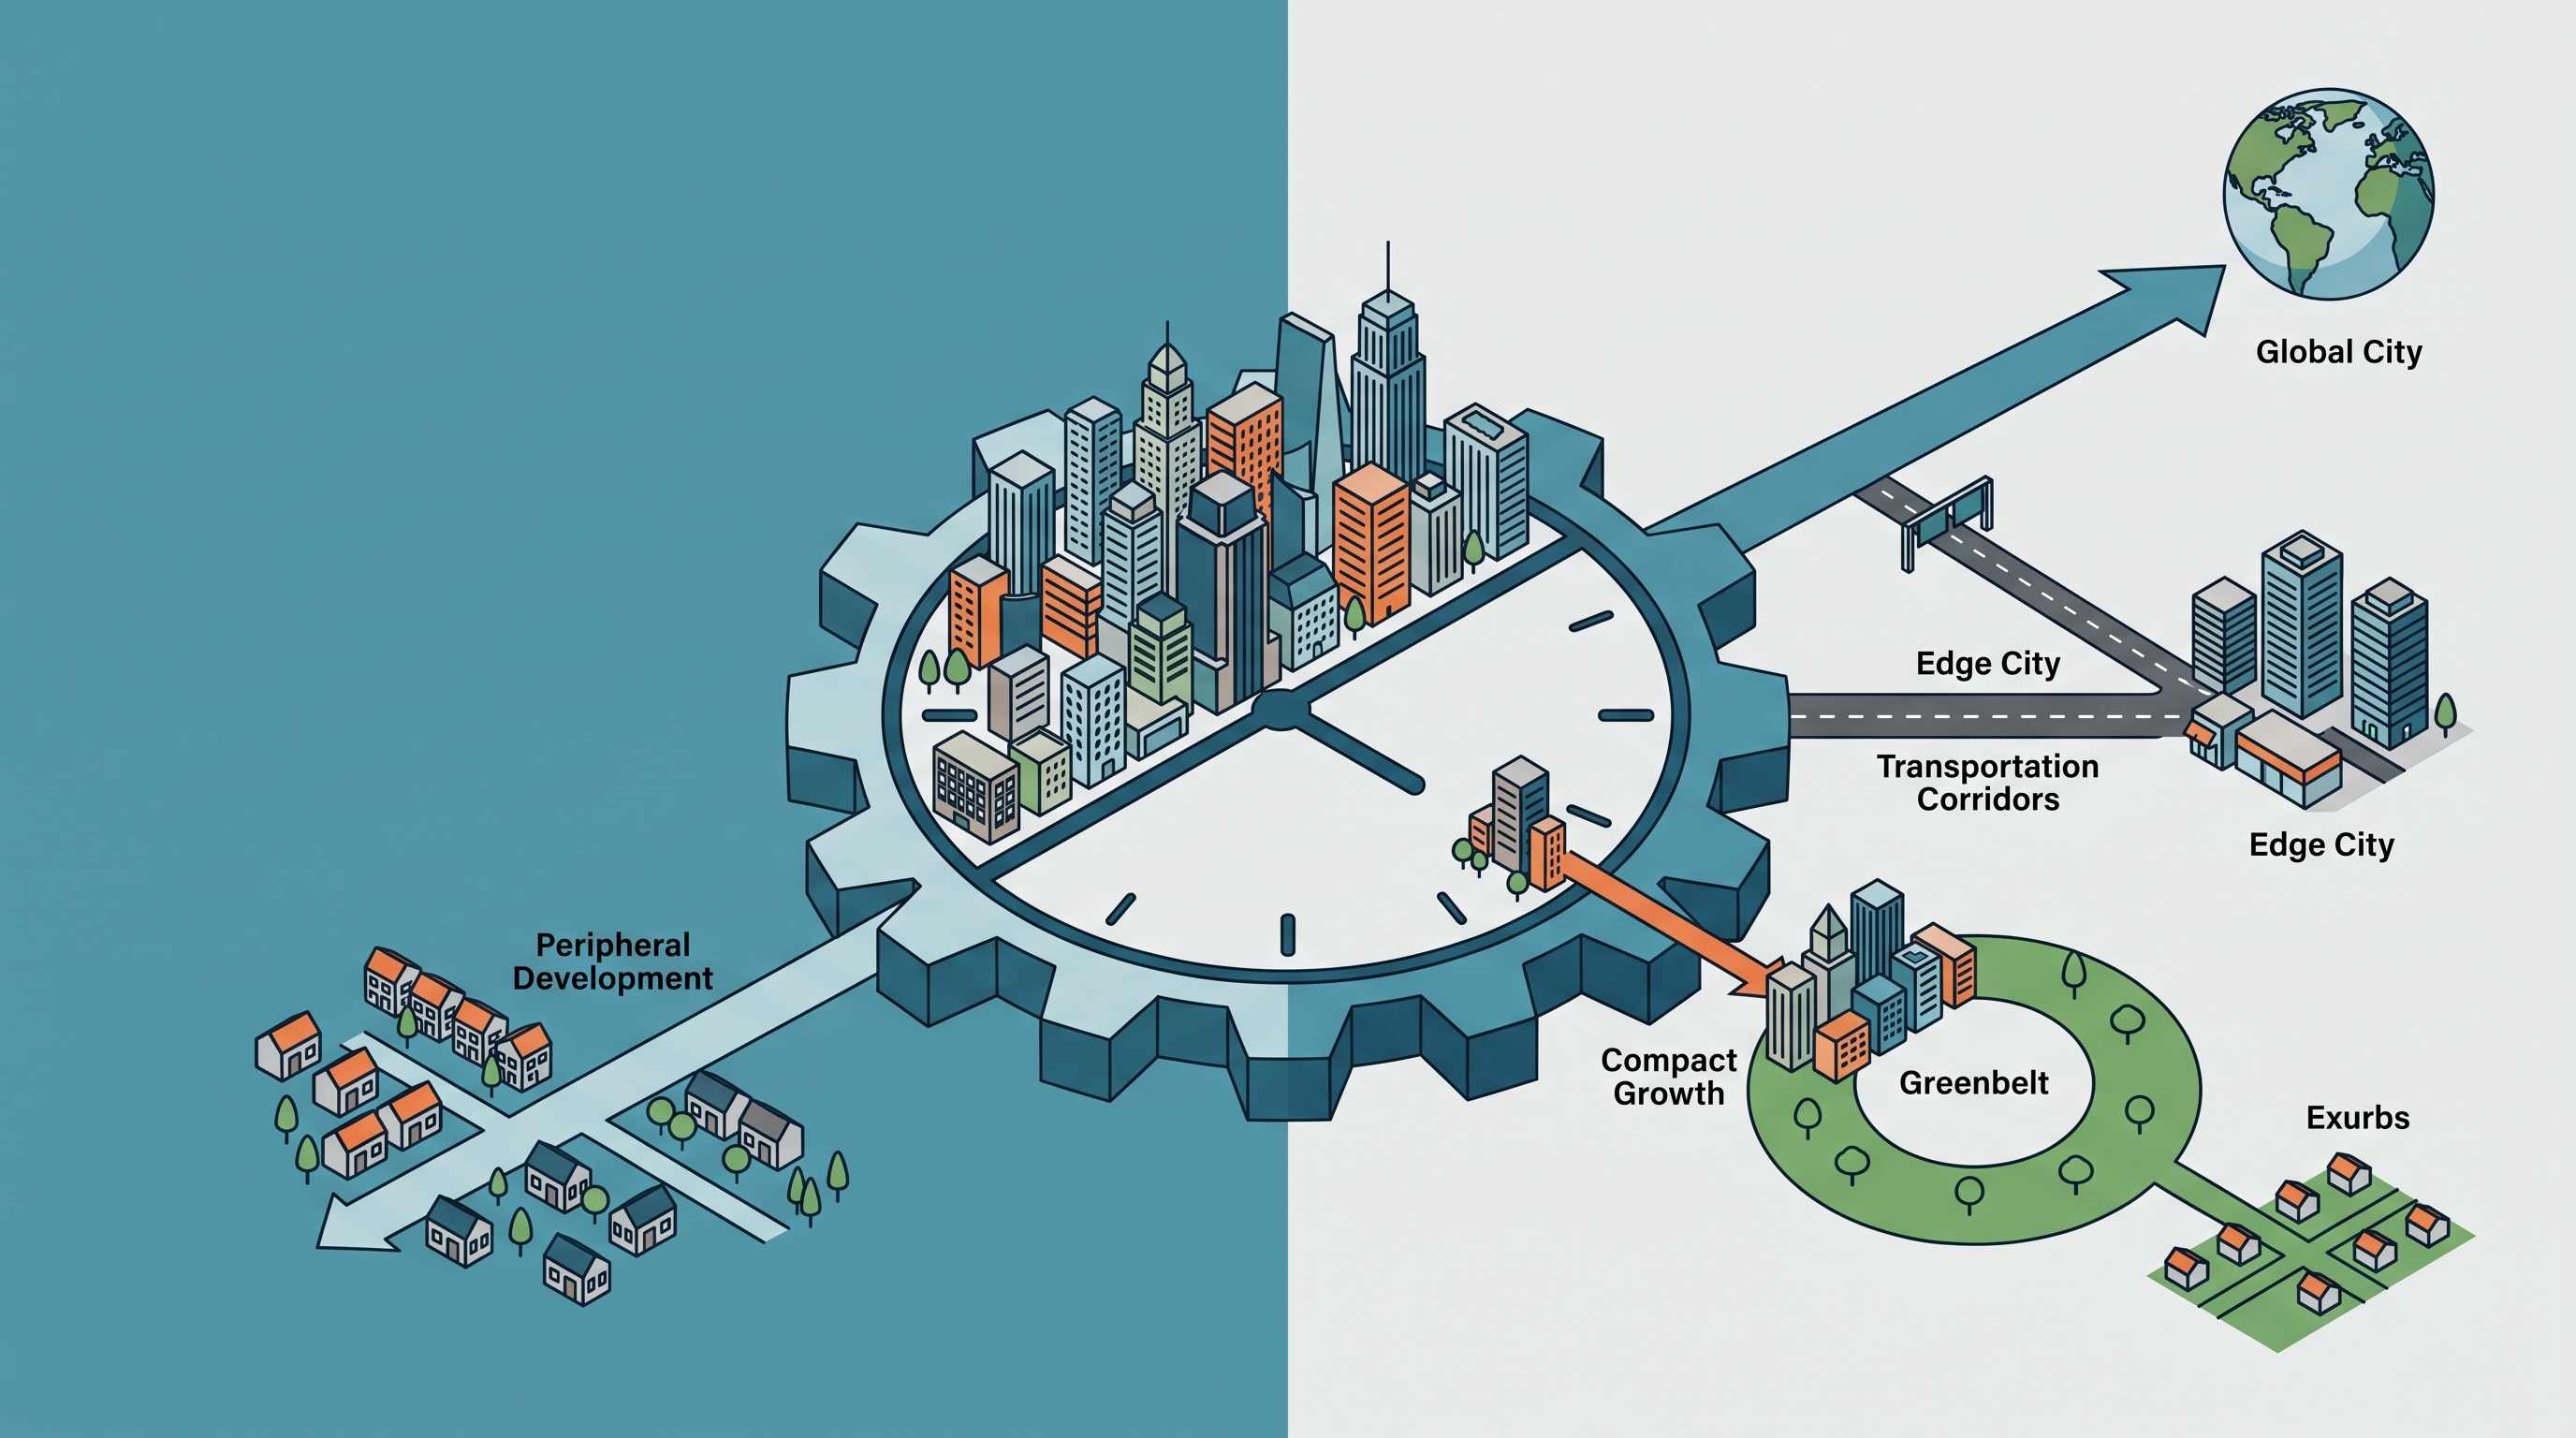
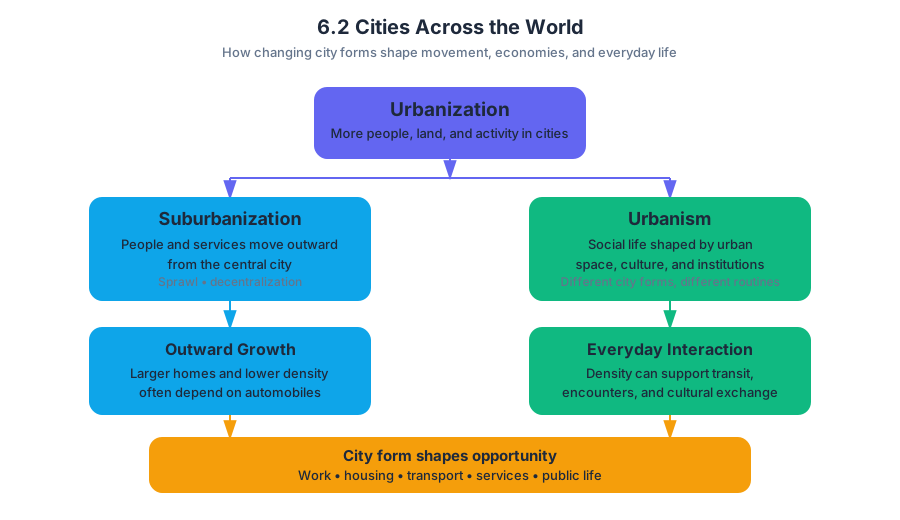
6.3 Cities and Globalization
Key concepts: Deindustrialization · International division of labor · Economic sector shift · Core countries · Higher-paying jobs · Outsourcing · Offshoring · Economic restructuring · Globalization · Metacities
Globalization links cities through production networks, but it does not distribute the same kinds of work or income evenly around the world. A shirt may be designed in a core-country city, manufactured in a newly industrialized country, shipped through several ports, and marketed through a global financial center.
6.3 Cities and Globalization
Globalization links cities through production networks, but it does not distribute the same kinds of work or income evenly around the world. A shirt may be designed in a core-country city, manufactured in a newly industrialized country, shipped through several ports, and marketed through a global financial center.
From deindustrialization to an international division of labor
Deindustrialization is the decline of manufacturing employment and industrial activity in a place. It does not necessarily mean that every factory disappears; rather, manufacturing becomes a smaller share of employment and economic output. As factories close, automate, or relocate, cities must adjust to a new economic role.
An international division of labor is the geographic separation of stages of production among countries. Core countries often retain higher-paying work such as corporate management, research and development, finance, design, and advanced technical services. Newly industrialized or semiperipheral countries may gain manufacturing, assembly, call-center, logistics, and other jobs that require lower labor costs.
The process can be visualized as a chain:
Core-country city → product design, finance, management
Newly industrialized city → assembly, manufacturing, processing
Global transport network → shipping, ports, distribution
Consumer markets → retail, advertising, digital sales
This arrangement creates interdependence: cities are connected because each performs a different function, not because they all possess the same economic power.
Economic sector shift
Deindustrialization also produces an economic sector shift—a movement in employment and output from the primary and secondary sectors toward the tertiary and quaternary sectors.
| Earlier industrial emphasis | Growing postindustrial emphasis |
|---|---|
| Factory production | Finance and business services |
| Steel, machinery, and textiles | Information technology and research |
| Large industrial workforces | Specialized professional employment |
| Warehouses and production plants | Offices, laboratories, and service hubs |
A city that once depended on steel mills may replace some industrial jobs with software firms, medical research, higher education, tourism, or corporate headquarters. These newer activities can generate substantial wealth, but they may not replace the same number of jobs or provide equal access to workers who previously held industrial positions.
Outsourcing, offshoring, and economic restructuring
Outsourcing occurs when a company contracts work to another company rather than performing that work internally. Offshoring occurs when a company moves an activity to another country. The two processes can overlap: a firm might outsource customer support to an independent company located overseas, making the activity both outsourced and offshored.
Together with economic restructuring, these processes have contributed to globalization. Economic restructuring means reorganizing an economy or firm so that production, employment, investment, and services operate differently. The result may be a decline in industrial jobs in core countries and an increase in manufacturing or service employment in newly industrialized countries.
Consider a simplified example. A company based in a core-country city closes its local assembly plant, contracts production to a factory abroad, and keeps product design and corporate finance at home. The core city loses factory wages and possibly tax revenue, while the overseas city gains jobs, investment, and industrial infrastructure. The original city may then convert the factory site into offices or apartments and offer lower taxes to attract replacement businesses.
How restructuring changes cities
Economic restructuring changes more than a city’s job titles. It can alter:
- Employment base: industrial jobs decline while service, managerial, and technical jobs grow.
- Land use: factories and rail yards may become offices, housing, retail districts, or abandoned brownfields.
- Tax revenue: the city may lose business and wage taxes when plants close, then seek new firms to restore its revenue base.
- Income distribution: higher-paying professional work may expand while displaced workers face unemployment or lower-wage service work.
- International position: the city may shift from a production center to a headquarters, finance, design, logistics, or innovation center.
A city can therefore become more globally connected while also experiencing local economic hardship. Globalization may increase investment and high-income employment in one district while leaving former industrial neighborhoods with unemployment, vacancy, and declining public services.
Misconception check
Common misconception: Deindustrialization means that a country has stopped being economically important.
Deindustrialization means that manufacturing has declined as a share of the economy or workforce—not that all industry has vanished or that the country has become poor. Core countries may lose routine factory jobs while retaining highly paid control functions. The key question is which activities remain, where they are located, and who benefits from them.
AP skill lens: Topic 6.3
This topic is especially suited to 1.A Define a concept, process, or model, 1.B Explain a concept, process, or model, 2.B Explain spatial relationships, 2.C Explain a spatial pattern using concepts, processes, or models, 3.B Explain patterns and trends in geographic data, and 5.B Explain spatial relationships across scales. A strong response connects a process to a spatial consequence: outsourcing or offshoring changes where jobs occur; deindustrialization changes the economic sector mix; restructuring changes the city’s land use and global role.
Retrieval check
A core-country city loses routine manufacturing jobs but gains corporate headquarters, research laboratories, and financial services. Identify one process causing the employment change and explain one resulting spatial consequence.
Answer: Deindustrialization, outsourcing, offshoring, or economic restructuring may cause the loss of manufacturing jobs. The city may shift toward higher-paying management and research functions, while former factories are redeveloped or abandoned and production expands in newly industrialized countries.

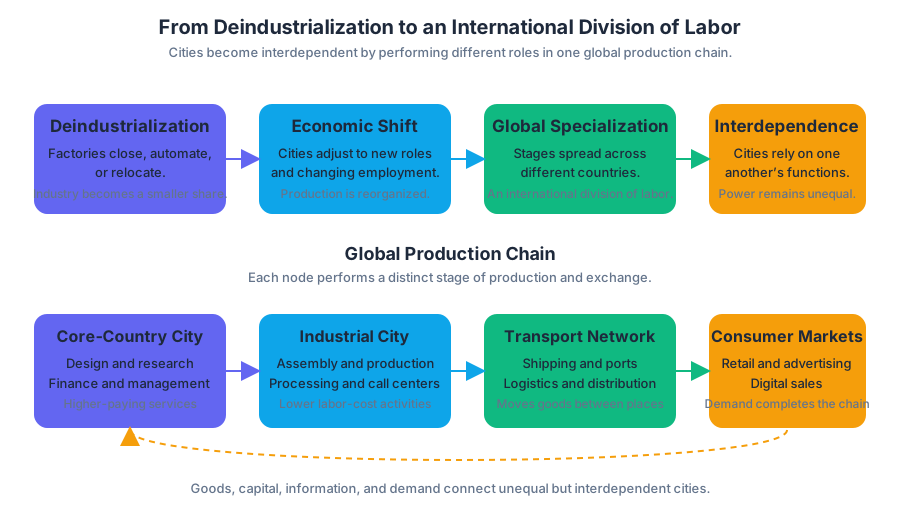
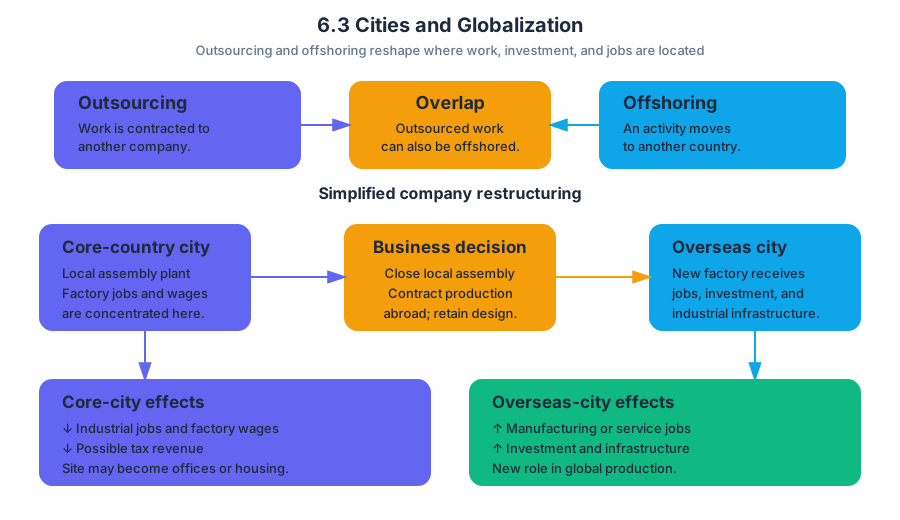
6.4 The Size and Distribution of Cities
Key concepts: Urban hierarchy · Urban interdependence · Relative city size · City spacing · Primate city · Gravity model · Christaller’s Central Place Theory · Distribution, size, and interaction of cities · Central place theory and supermarket location · Urban concepts and geographic models
Cities are not scattered randomly across space: they form systems in which settlements differ in size and function, connect to one another, and occupy locations shaped by distance, resources, and access.
6.4 The Size and Distribution of Cities
Cities are not scattered randomly across space: they form systems in which settlements differ in size and function, connect to one another, and occupy locations shaped by distance, resources, and access.
PSO-6.C — Learning Objective: Identify the different urban concepts such as hierarchy, interdependence, relative size, and spacing that are useful for explaining the distribution, size, and interaction of cities.
The required knowledge for this objective is PSO-6.C.1: principles useful for explaining the distribution and size of cities include the rank-size rule, the primate city, the gravity model, and Christaller’s central place theory. The associated suggested skill is Spatial Relationships, Skill 2.C: Explain a likely outcome in a geographic scenario using geographic concepts, processes, models, or theories.
Four ways to read an urban system
A city system can be analyzed through four related but distinct questions: How large and important is each city? How do cities interact? How far apart are they? What functions does each settlement perform?
| Concept | Main question | What it reveals |
|---|---|---|
| Urban hierarchy | How are cities ranked by size and function? | The organization of settlements from small centers to large metropolitan areas |
| Relative size | How large is one city compared with others? | Whether a system follows the rank-size rule or is dominated by a primate city |
| Urban interdependence | How do cities rely on and connect with one another? | Flows of people, goods, money, information, and services |
| City spacing | How are cities distributed across territory? | Whether settlements are clustered, dispersed, or arranged at regular intervals |
Hierarchy is an ordered system. A village may provide basic daily goods, a town may offer larger stores and secondary services, and a major city may contain specialized hospitals, universities, financial institutions, and government offices. The higher a settlement is in the hierarchy, the larger its market area and the less frequently people usually need its specialized services.
Relative size: rank-size and primate cities
The rank-size rule predicts that a city’s population is approximately equal to the largest city’s population divided by its rank. In simplified form, if the largest city has population $P_1$, the city ranked $r$ should have population:
$$P_r \approx \frac{P_1}{r}$$
Suppose a country’s largest city contains $4$ million people. Under the rank-size rule, the second-largest city would contain roughly $2$ million, the third-largest about $1.33$ million, and the fourth-largest about $1$ million. The rule is a general pattern, not a physical law; terrain, political history, colonial development, transportation, and economic change can produce major deviations.
A primate city is disproportionately larger and more influential than the other cities in its country. It often dominates political decision-making, higher education, finance, transportation, media, and cultural institutions. A primate-city pattern therefore differs from a rank-size distribution: the largest city is not merely first in rank but overwhelmingly dominant.
Misconception check: A primate city is not simply any country’s largest city. It is a city whose size and influence greatly exceed those of the next cities in the hierarchy.
Urban interdependence and interaction
Urban interdependence describes the connections among cities and the ways settlements rely on one another. A smaller city may send workers and students to a larger city, while the larger city depends on smaller places for labor, food, recreation, specialized manufacturing, or regional markets.
These relationships create spatial interaction: movement or communication between places. Interaction may include commuting, migration, tourism, freight shipments, investment, telephone calls, internet traffic, or patient visits to specialized medical facilities. Cities can compete for investment while remaining interdependent through shared transportation and economic networks.
The gravity model
The gravity model predicts that interaction between two places increases as their populations or economic masses increase and decreases as distance increases. A simple version is:
$$I_{ij} = G\frac{P_iP_j}{D_{ij}^{,b}}$$
Here, $I_{ij}$ represents interaction between cities $i$ and $j$, $P_i$ and $P_j$ represent their sizes, $D_{ij}$ is the distance between them, $G$ is a constant, and $b$ describes how strongly distance reduces interaction. The model does not claim that every pair of cities behaves identically; it provides a way to explain likely patterns.
For example, a large metropolitan area and a nearby medium-sized city may exchange more commuters and goods than two small, distant towns. However, a mountain range, international border, poor roads, language difference, or high transportation cost can reduce interaction below what population and distance alone would predict.
Spacing and Christaller’s central place theory
City spacing concerns the geographic distance between settlements and the pattern formed by their distribution. Cities may cluster near coasts, rivers, transport corridors, fertile land, or mineral resources; they may also be more evenly spaced when settlements serve surrounding rural populations in a regional service network.
Christaller’s central place theory explains how settlements of different sizes can be distributed according to the services they provide. A central place is a settlement that supplies goods and services to the surrounding area, called its market area or hinterland.
The theory rests on an idealized landscape: a flat, evenly populated surface with similar transportation in every direction and consumers who travel to the nearest service. Under these assumptions, low-order services—such as convenience groceries—have small thresholds and short ranges, while high-order services—such as specialized surgery or major financial services—require larger populations and draw customers from farther away.
Christaller’s model is often represented with nested market areas. Smaller settlements are more numerous and more closely spaced because people need basic services frequently. Larger settlements are fewer and farther apart because their specialized services require larger customer bases.
Key insight: A settlement’s size is connected to its function. The city that offers rare, specialized services generally needs a larger market area than the town that sells everyday necessities.
Worked application: locating a new supermarket
A grocery company must choose between two sites: Site A is near a large city but faces several competing supermarkets; Site B lies between several smaller towns and has fewer competitors. Central place reasoning asks whether enough customers live within a practical travel range to support the store.
The likely evaluation proceeds as follows:
- Estimate the threshold, or minimum number of customers needed to keep the supermarket operating.
- Estimate the store’s range, or the maximum distance most customers will travel for groceries.
- Map nearby settlements and competing stores.
- Compare accessibility, roads, population density, and purchasing power.
- Choose the location with a sufficiently large underserved market area.
If Site B is easily reached by several towns and lies beyond the normal range of existing supermarkets, it may capture customers from a broad area. Site A may have a larger nearby population, but competition and congestion could shrink its effective market area. The best location is therefore not automatically the site with the largest population; it is the site where population, distance, accessibility, and competition combine to produce adequate demand.
Misconception check: Central place theory does not predict perfectly spaced hexagonal cities in the real world. Its geometric pattern is an analytical model, while physical geography, historical boundaries, unequal wealth, transportation, and technology make actual urban systems irregular.
Skill application: predicting an outcome
To apply Skill 2.C: Explain a likely outcome in a geographic scenario using geographic concepts, processes, models, or theories, name the model, identify the relevant evidence, and connect the evidence to the predicted outcome. For example: If a new high-speed rail link connects two large cities, interaction between them will likely increase because reduced travel time lowers the effective distance in the gravity model.
The same scenario may also change hierarchy and spacing. A smaller city located along the rail line could gain higher-order services and investment, strengthening its position in the urban hierarchy. The connection may increase interdependence even though the physical distance between cities has not changed.
Retrieval check
A country has one city of $8$ million people, a second city of $1.5$ million, and several much smaller cities. Which concept best describes this pattern, and what evidence supports the answer?
Answer: The pattern suggests a primate city because the largest city is disproportionately larger than the second-largest city. A rank-size pattern would predict the second city to be closer to $4$ million under the simplified rule $P_2 \approx P_1/2$; the observed $1.5$ million is far smaller.

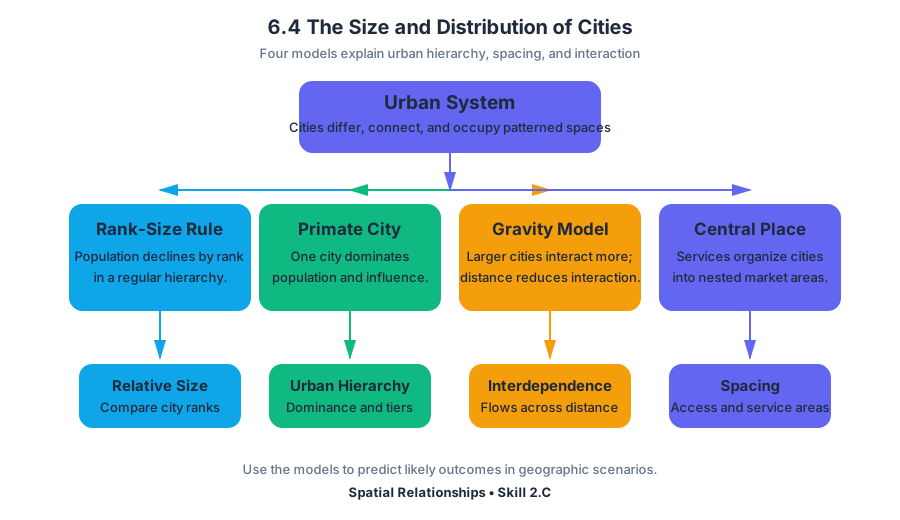
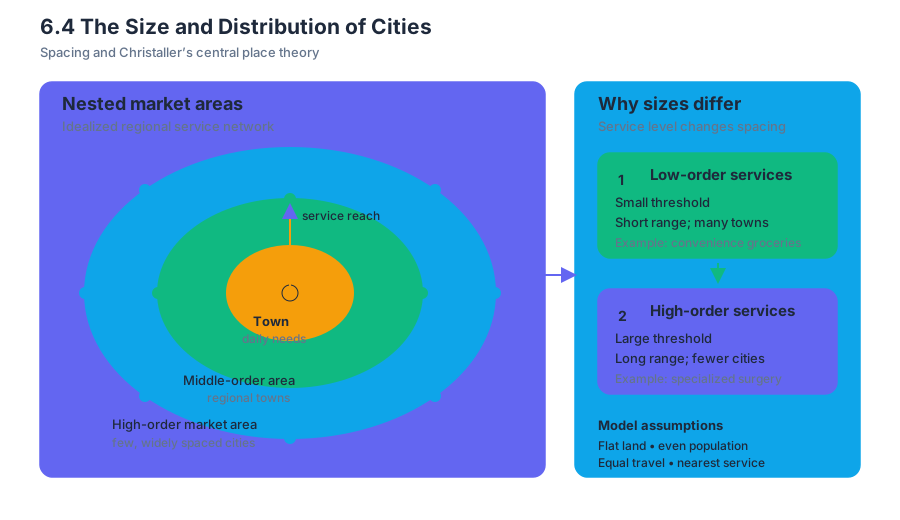
6.5 The Internal Structure of Cities
Key concepts: Internal structure of cities · Urban models and theories · Burgess concentric-zone model · Hoyt sector model · Harris and Ullman multiple-nuclei model · Physical geography and resources · Geographic variation in cities · Limitations of urban models · Quantitative urban data · Qualitative urban data
A city is not internally uniform: housing, industry, commerce, transportation, and government occupy different spaces because land values, accessibility, physical geography, historical development, and environmental resources vary across the urban area.
6.5 The Internal Structure of Cities
A city is not internally uniform: housing, industry, commerce, transportation, and government occupy different spaces because land values, accessibility, physical geography, historical development, and environmental resources vary across the urban area.
A useful mental image is a city as a set of magnets competing for space. A downtown business district pulls offices and retail toward highly accessible land; factories seek transportation routes and room to expand; households balance land cost against commuting time; and natural features such as rivers, mountains, coastlines, and floodplains constrain the possible arrangement.
LEARNING OBJECTIVE (PSO-6.D): Explain the internal structure of cities using various models and theories.
ESSENTIAL KNOWLEDGE (PSO-6.D.1): Models and theories that are useful for explaining internal structures of cities include the Burgess concentric-zone model, the Hoyt sector model, the Harris and Ullman multiple-nuclei model, the galactic city model, bid-rent theory, and urban models drawn from Latin America, Southeast Asia, and Africa.
Urban models: useful patterns, not perfect maps
An urban model is a simplified representation of how land uses and social groups are arranged within a city. Models help geographers identify spatial patterns and propose explanations, but they are not literal maps of every city.
The central AP skill is 1.E: Explain the strengths, weaknesses, and limitations of different geographic models and theories in a specified context. A strong explanation does more than name a model: it identifies the pattern the model predicts, connects that pattern to a cause, and then evaluates whether the specified city actually fits.
| Model or theory | Main predicted pattern | Important explanatory idea |
|---|---|---|
| Burgess concentric-zone model | Rings surrounding a central business district | Distance from the center and competition for land |
| Hoyt sector model | Wedges or corridors extending from the center | Transportation routes and directional growth |
| Harris and Ullman multiple-nuclei model | Several specialized centers | Distinct activities develop around separate nuclei |
| Galactic city model | A dispersed metropolitan area with peripheral nodes | Highways, suburbs, and edge-centered development |
| Bid-rent theory | Land value changes with accessibility and permitted use | Different users can pay different amounts for accessible land |
| Regional urban models | Distinct patterns associated with Latin America, Southeast Asia, or Africa | Local history, colonialism, informality, culture, and uneven development |
Burgess concentric-zone model
The Burgess concentric-zone model represents the city as a series of rings expanding outward from the central business district, or CBD, where commercial activity and accessibility are greatest. In the classic model, the inner rings contain zones of transition and lower-income housing, while more affluent residential areas occur farther from the center.
The model’s mechanism is competition. Because central land is accessible but expensive, businesses and residents compete for it; land uses that need maximum accessibility can justify high rents, while activities needing more space may relocate outward. As the city grows, redevelopment and filtering can produce changing rings of land use.
Worked interpretation: Suppose a city’s CBD occupies the center of a circular plain. A ring immediately outside it contains older apartments, warehouses, and recently arrived migrants; a second ring contains established working-class housing; and a third ring contains newer, lower-density housing. This arrangement broadly resembles Burgess because land use changes with distance from the center.
Its limitation is equally important: real cities are rarely circular. Rivers, coastlines, highways, zoning laws, suburban employment centers, and historic boundaries interrupt rings. A city with a major industrial corridor may show a wedge rather than a complete ring.
Hoyt sector model
The Hoyt sector model modifies the ring pattern by showing urban land uses as wedges, or sectors, radiating outward from the CBD. High-income housing, low-income housing, and industry may extend along particular transportation routes rather than forming complete circles.
Transportation creates the model’s directional logic. Railways, highways, ports, and major roads increase accessibility along a corridor, encouraging factories, warehouses, or commercial development to grow outward in that direction. Residential sectors may then follow the same corridor or avoid it, depending on environmental quality and land prices.
Example: If a railway leaves a CBD toward the southwest, industrial land may form a southwest wedge. If the city’s cleanest and highest ground lies northeast, affluent residential development may extend northeast instead of appearing evenly around the center.
Harris and Ullman multiple-nuclei model
The Harris and Ullman multiple-nuclei model explains cities as systems containing several centers, or nuclei, rather than one dominant CBD. A university district, airport, industrial park, suburban shopping center, medical complex, or government center can each attract related activities.
The model reflects modern metropolitan growth, in which people may travel between suburban employment centers without passing through downtown. Certain land uses cluster because they benefit from one another, while others separate because they conflict: heavy industry may seek rail access but avoid expensive office districts, and airports require large sites away from dense residential areas.
Strength: the model can explain polycentric metropolitan regions better than a single-center model. Limitation: it may describe the pattern without identifying which nucleus appeared first, how powerful each nucleus is, or how physical barriers and public policy shaped its location.
Galactic city, bid-rent theory, and regional models
The galactic city model, also called the peripheral model, describes a dispersed metropolitan area in which suburban activity centers and transportation nodes surround or connect to the older core. Edge cities near highway interchanges may contain offices, retail, hotels, and entertainment, reducing dependence on the historic CBD.
Bid-rent theory explains why different users occupy different locations by focusing on the maximum rent each user is willing and able to pay. Highly accessible land near the CBD often has high commercial value, while households or industries may choose locations farther away if they need larger sites or can tolerate longer travel distances. The theory predicts a relationship, not a guaranteed land-use map.
Regional models are essential because cities develop through different historical and cultural processes. Urban models drawn from Latin America, Southeast Asia, and Africa may account for colonial planning, informal settlements, rapid migration, mixed land uses, unequal infrastructure, and the continuing influence of indigenous or local urban forms. Applying a model developed from one region uncritically to another can hide rather than explain urban reality.
Physical geography and resources
The presence and growth of cities vary across geographical locations because of physical geography and resources. Harbors support port functions; rivers can provide transportation and water but also create flood risk; mountains constrain expansion; fertile plains support food production; and mineral or energy resources can attract specialized industries.
Physical geography does not mechanically determine urban form. Human decisions, technology, infrastructure, zoning, investment, and political power can overcome some constraints or intensify others. A city may build tunnels through mountains, elevate roads above floodplains, or redirect growth toward safer land—but these choices have costs.
Investigating internal structure with evidence
Geographers combine quantitative data and qualitative information to investigate internal structure. Quantitative evidence might include population density, land values, commuting flows, building heights, household income, or the percentage of land devoted to different uses. Qualitative evidence might include interviews, field observations, planning documents, photographs, and residents’ descriptions of neighborhood change.
Worked contextual example: Imagine that land-value data show the highest prices in the CBD and along two rail corridors, while a map of employment shows three major clusters: downtown offices, an airport logistics zone, and a suburban technology center. Field observations also find informal housing near industrial land and newer affluent housing near a protected hillside.
The evidence supports a combination of models rather than one perfect fit. The CBD and rail corridors resemble the Burgess and Hoyt models; the airport and technology center support the multiple-nuclei and galactic city models; and the hillside and protected land demonstrate how physical geography and regulation redirect growth. The correct conclusion is not “the city is a Burgess city,” but “different models explain different parts of its internal structure.”
Misconception check
Named misconception: “Urban models are exact predictions.” They are not. A model is useful when it explains a significant pattern in a specified context, even if other forces produce exceptions. On an exam, evaluate the fit: identify supporting evidence, name a contradiction, and explain the geographic process causing the difference.
Retrieval check
A city has one historic CBD, industrial development concentrated beside a railroad, and two large suburban employment centers near highway interchanges. Which model or combination of models best explains the pattern, and what evidence would you use to test it? A strong answer should connect the railroad to the Hoyt sector model, the suburban centers to the Harris and Ullman multiple-nuclei model or galactic city model, and the evidence to measurable land use, accessibility, and employment data.
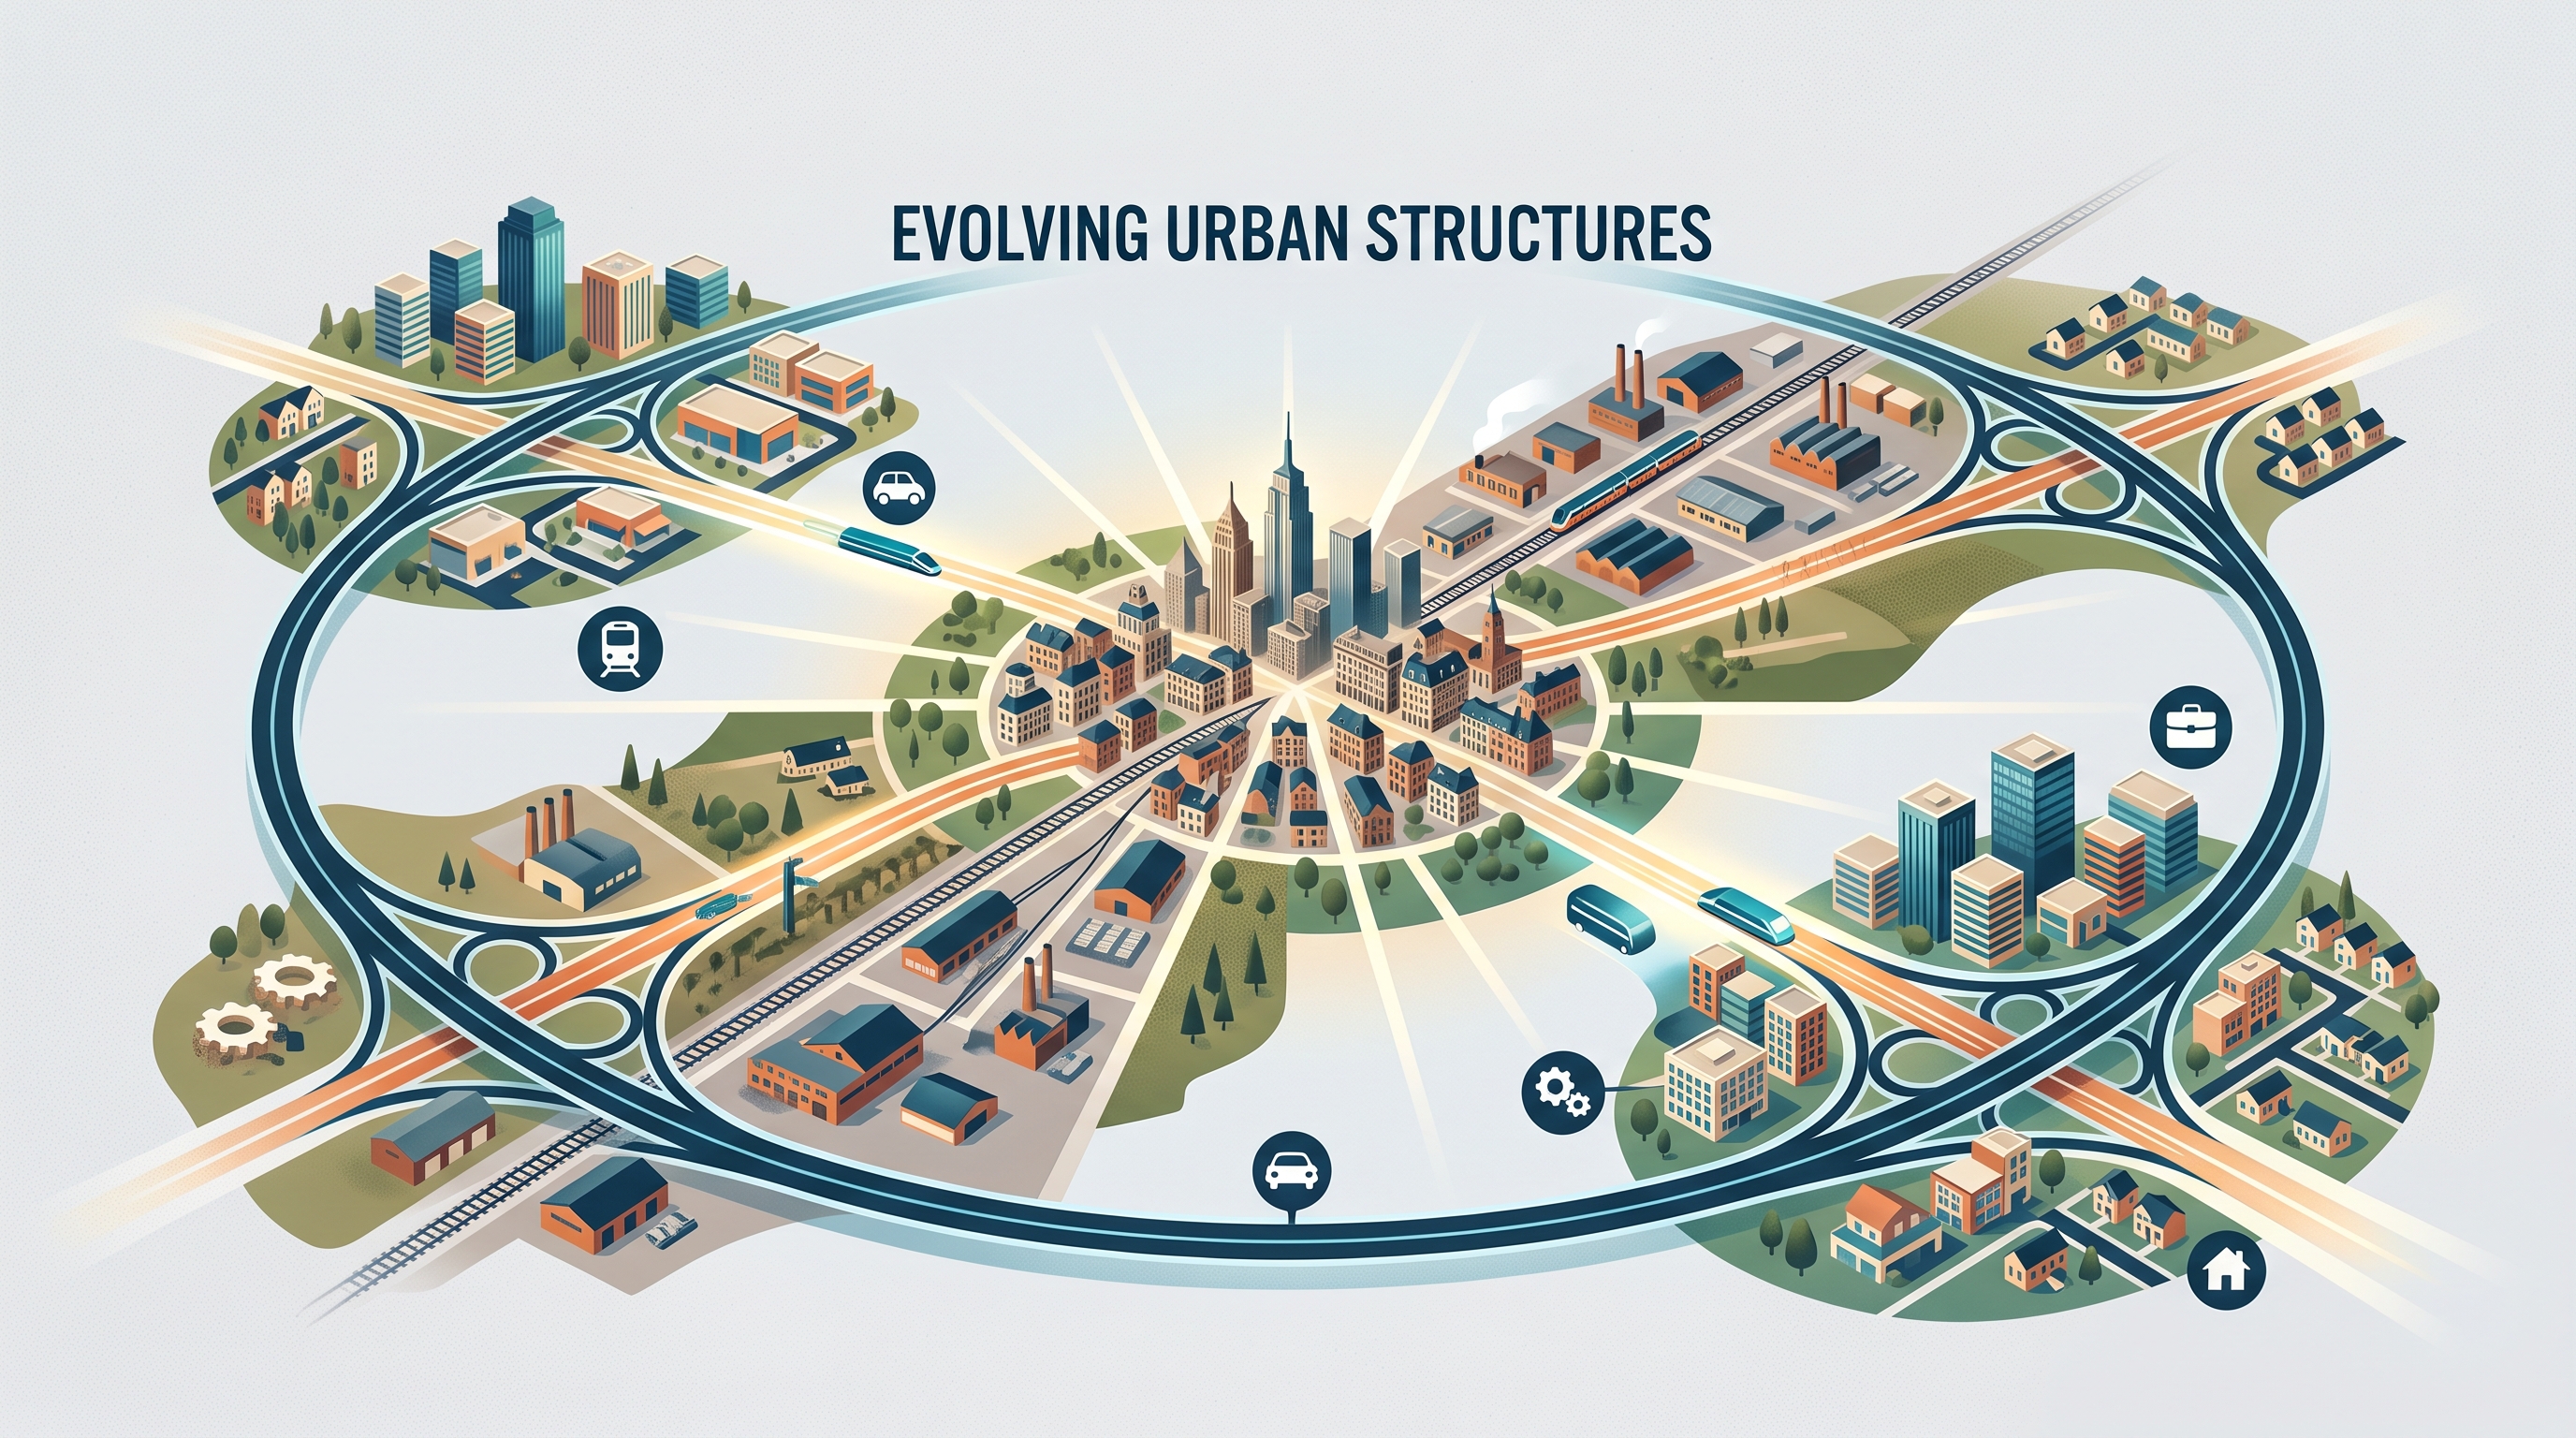
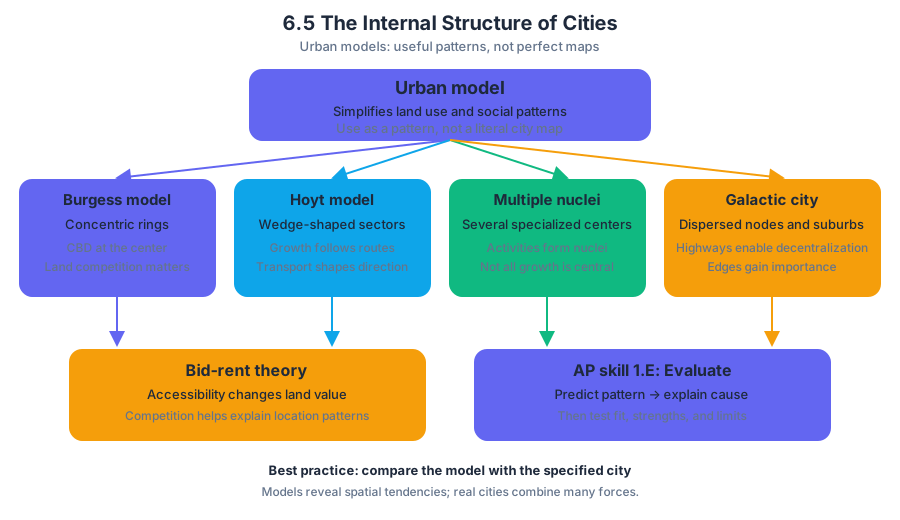
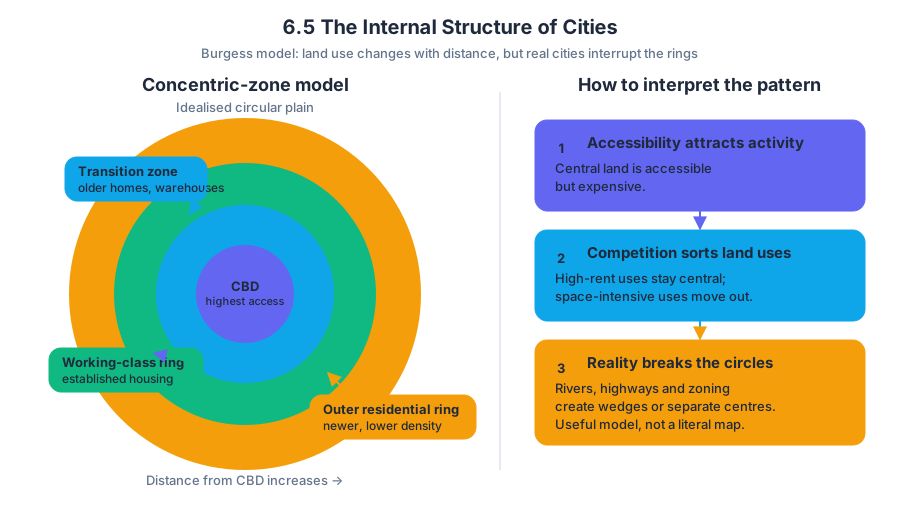
6.6 Density and Land Use
Key concepts: Population density measurement: arithmetic, physiological, and agricultural density · Impacts of different methods used to calculate population density · Carrying capacity and how it changes · Mechanization and irrigation increasing agricultural carrying capacity · High-yield seeds increasing agricultural productivity · Urban sprawl and land-use change · Habitat loss, fragmentation, and decreased biodiversity · Transportation networks, pollution, and urban heat islands · Land-use conflicts involving local food production, open space, and conservation · Irrigation expansion and conflicts with nomadic herders
A city can feel crowded while the surrounding region still contains enormous amounts of open land. Population density resolves this apparent contradiction by measuring how many people, farmers, or resources are associated with a given amount of space—but the result depends entirely on what land area and population…
6.6 Density and Land Use
A city can feel crowded while the surrounding region still contains enormous amounts of open land. Population density resolves this apparent contradiction by measuring how many people, farmers, or resources are associated with a given amount of space—but the result depends entirely on what land area and population group are counted.
Three ways to measure density
Arithmetic density is the simplest measure: total population divided by total land area. It answers, “How many people occupy each unit of land, on average?” If a region has $2{,}000{,}000$ people and $10{,}000\ \text{km}^2$ of land, its arithmetic density is:
$$ \text{Arithmetic density}=\frac{2{,}000{,}000\ \text{people}}{10{,}000\ \text{km}^2}=200\ \text{people/km}^2 $$
Physiological density measures total population relative to arable land, or land suitable for growing crops. It reveals pressure on the land that can actually produce food. Agricultural density measures the number of farmers relative to arable land, indicating how intensively human labor is used in food production.
| Measure | Numerator | Denominator | Main geographic question |
|---|---|---|---|
| Arithmetic density | Total population | Total land area | How generally crowded is the territory? |
| Physiological density | Total population | Arable land | How much pressure is placed on farmland? |
| Agricultural density | Number of farmers | Arable land | How intensively is farmland worked by people? |
The same country may have a low arithmetic density but a high physiological density if mountains, deserts, forests, or other areas cannot support large-scale farming. A high agricultural density often indicates labor-intensive agriculture, whereas a lower agricultural density may reflect mechanization, larger farms, or highly productive technology.
Worked comparison: why the denominator matters
Imagine two regions, each with $1{,}000{,}000$ people and $20{,}000\ \text{km}^2$ of total land. Region A has $10{,}000\ \text{km}^2$ of arable land; Region B has only $2{,}000\ \text{km}^2$.
$$ \text{Arithmetic density}=\frac{1{,}000{,}000}{20{,}000}=50\ \text{people/km}^2 $$
Both regions have the same arithmetic density. Their physiological densities, however, differ sharply:
$$ \text{Region A}=\frac{1{,}000{,}000}{10{,}000}=100\ \text{people/km}^2\text{ of arable land} $$
$$ \text{Region B}=\frac{1{,}000{,}000}{2{,}000}=500\ \text{people/km}^2\text{ of arable land} $$
Region B places much greater population pressure on its farmland. A planner studying food security would therefore learn more from physiological density than arithmetic density. If Region A has $100{,}000$ farmers and Region B has $20{,}000$ farmers, their agricultural densities are $10$ and $10$ farmers per square kilometer of arable land, respectively—showing that similar farming intensity can coexist with very different population pressure.
Key insight: A density statistic is not “the” density of a place. It is a measurement produced by a particular numerator and denominator.
Carrying capacity and agricultural technology
Carrying capacity is the largest population an area can support with the resources and technology available at a particular time. It is not a permanent physical limit. Mechanization—including tractors, vehicles, irrigation, and processing equipment—can increase the amount of food produced from land and therefore allow that land to support a larger population.
High-yield seeds can also raise carrying capacity by producing more resources on the same area of land. Precision agriculture, GPS-guided equipment, and improved growing practices may further increase output by applying water, fertilizer, or labor more efficiently. Irrigation can even bring areas with low population density into agricultural production, although it may create new environmental and political pressures.
For example, expanding irrigation in a dry grassland may increase cultivated land and food production. But irrigation infrastructure can also block traditional migration routes, contributing to conflicts between farmers and nomadic herders who depend on seasonal movement. A technological increase in carrying capacity can therefore produce both greater food security and sharper competition over land and water.
Urban sprawl as land-use change
Urban sprawl is the outward expansion of low-density urban development into formerly rural or undeveloped land. As roads, housing, shopping areas, and utilities spread outward, arable land may be converted to buildings, reducing space for local food production, open space, conservation, greenbelts, and preservation efforts.
Sprawl also changes land cover. Deforestation and habitat fragmentation can reduce biodiversity and disrupt wildlife movement. Transportation expansion associated with sprawl can increase traffic, congestion, pollution, inefficient energy use, and urban heat islands—areas that become warmer because pavement and buildings absorb and re-radiate heat.
Named misconception check — “More technology always makes land use sustainable.” Technology can increase carrying capacity, but it does not eliminate trade-offs. Irrigation may expand farming while intensifying water disputes; mechanization may raise output while reducing agricultural employment; and sprawl may create more housing while consuming farmland and habitat.
Retrieval check
A region has low arithmetic density but very high physiological density. What does that combination suggest? It suggests that much of the region is not arable, so the population is concentrated relative to a small agricultural base. Which measure would best reveal whether farming relies heavily on human labor: arithmetic, physiological, or agricultural density? Agricultural density, because it compares farmers with arable land.
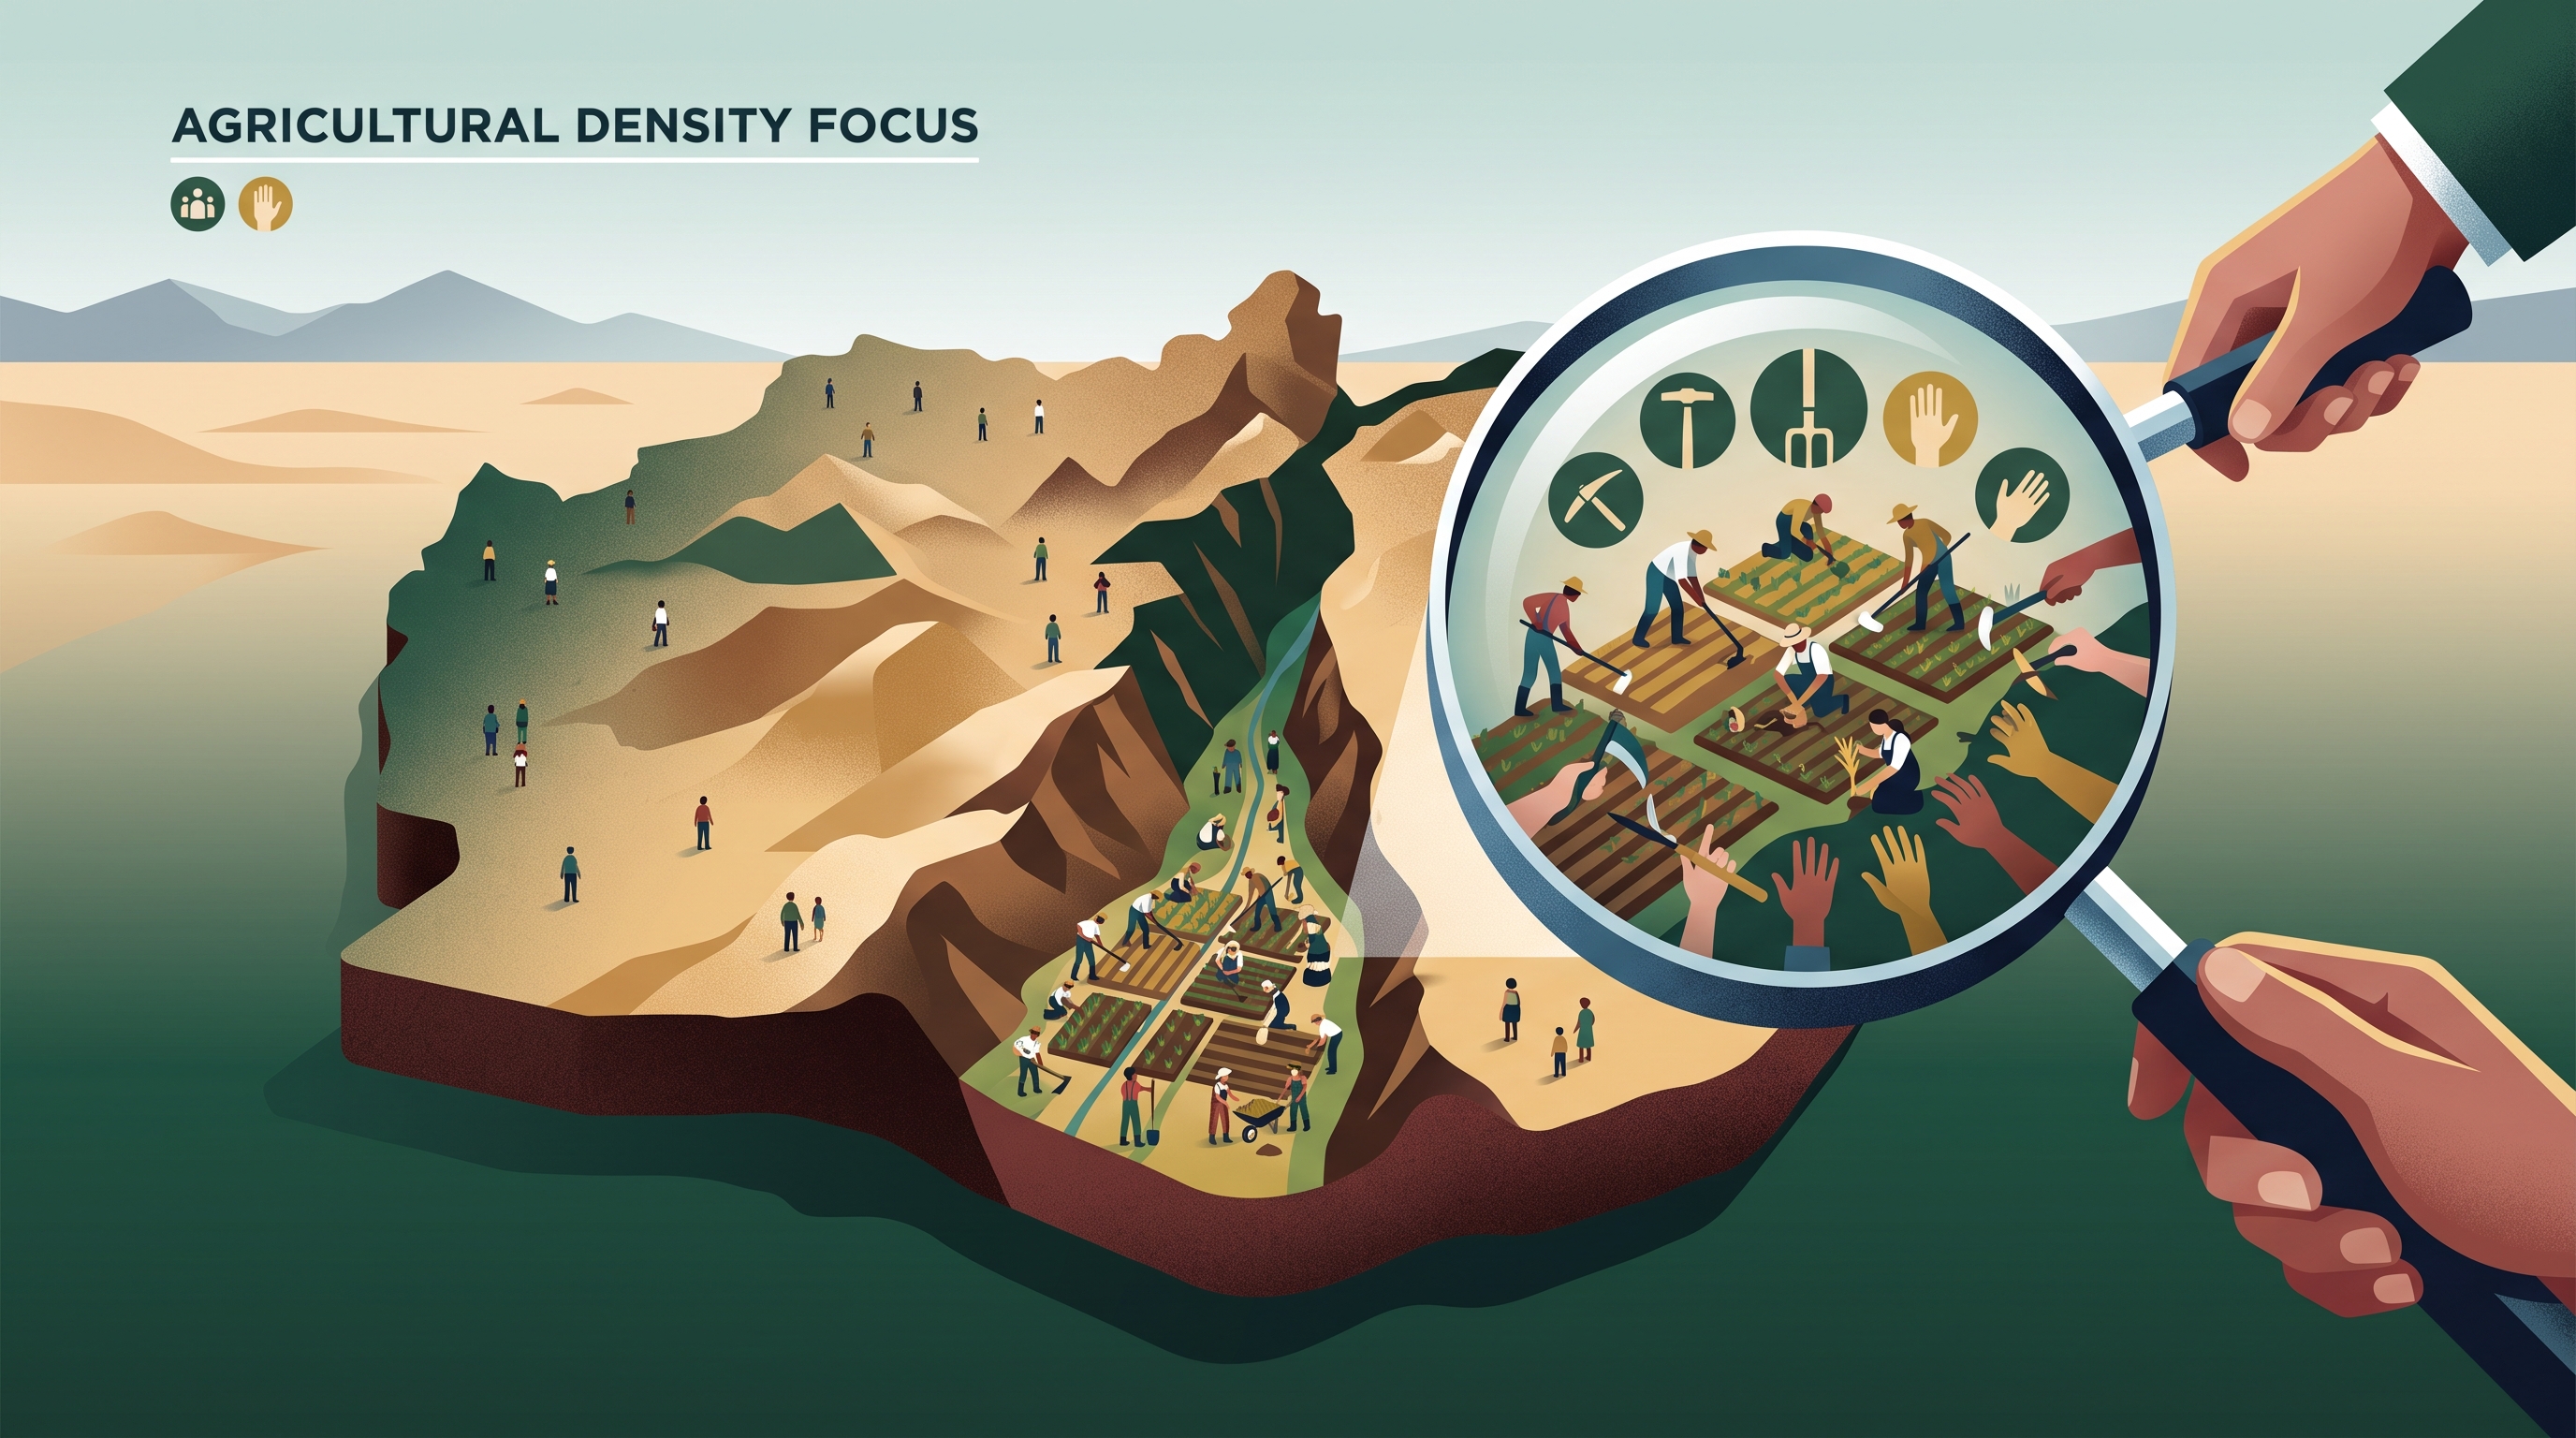
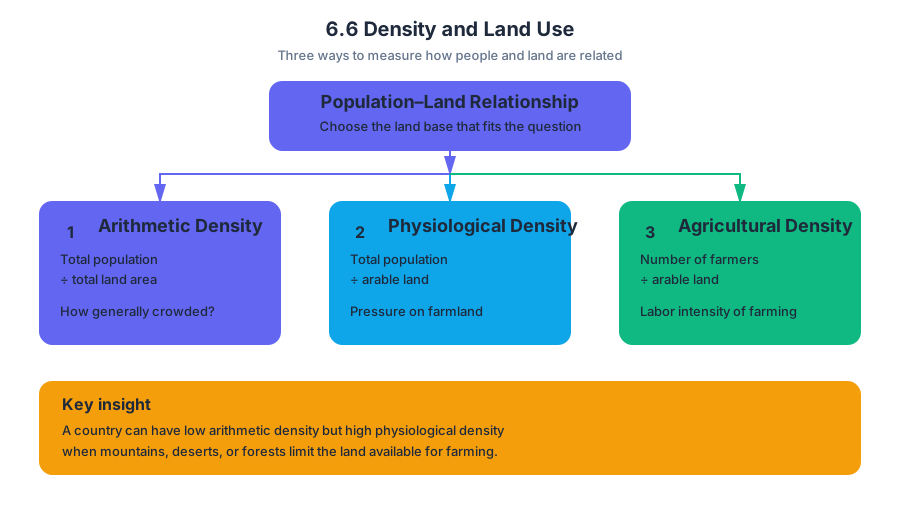
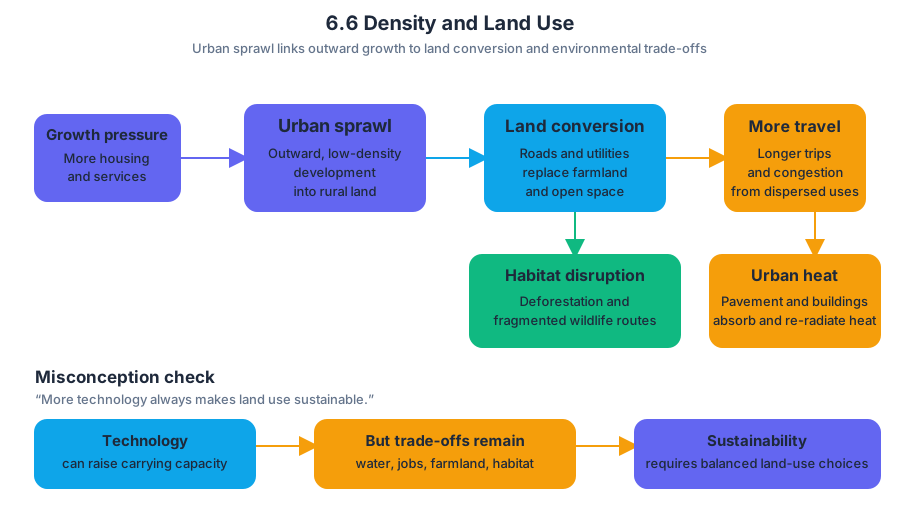
6.7 Infrastructure
A city cannot function on buildings alone: it depends on infrastructure, the basic physical systems that move people, goods, energy, water, information, and waste through urban space.
6.7 Infrastructure
A city cannot function on buildings alone: it depends on infrastructure, the basic physical systems that move people, goods, energy, water, information, and waste through urban space. Roads, railways, bridges, water pipes, electrical grids, drainage systems, sewers, telecommunications, and airports form the “circulatory system” of a city.
Infrastructure matters because it makes urban activity possible at scale. A neighborhood may contain homes and businesses, but without reliable transportation workers cannot reach jobs, without water and sanitation public health declines, and without electricity or communication networks firms struggle to operate. Infrastructure therefore influences not only where development occurs, but also who benefits from urban growth.
Infrastructure as an urban system
Infrastructure works as an interconnected network rather than as a collection of separate objects. A new road can improve access to employment, but it may also increase traffic, encourage development along its route, and require expanded water, electricity, and waste services. A transit station can attract apartment buildings and shops, while a weak sewer system may limit how many people the surrounding area can support.
A useful way to trace infrastructure’s role is:
- Investment: A government or private organization builds or upgrades a system.
- Accessibility: Travel time, service availability, or communication capacity changes.
- Urban response: Households and firms adjust their locations.
- Development pattern: Population, land values, employment, and services become redistributed.
- Uneven effects: Some areas gain access and investment while others remain underserved or experience displacement.
This chain connects infrastructure to the spatial patterns studied in Topic 6.6: changes in access can alter land use and residential location even when the physical size of the city does not change.
Major infrastructure categories
| Infrastructure system | What it does in a city | Likely urban effect |
|---|---|---|
| Transportation | Moves people and goods through roads, railways, ports, and airports | Expands commuting zones and connects markets |
| Water and sanitation | Supplies clean water and removes wastewater and solid waste | Supports public health and higher population concentrations |
| Energy | Delivers electricity, fuel, or other power sources | Enables homes, industry, commerce, and digital services |
| Communication | Carries telephone, internet, and data connections | Links firms, residents, and governments across distance |
| Drainage and flood control | Channels stormwater and reduces flood exposure | Protects property and supports development in vulnerable areas |
| Public facilities | Provides schools, hospitals, emergency services, and civic functions | Shapes quality of life and neighborhood attractiveness |
Worked example: a transit investment
Imagine a rapidly growing city whose central business district is separated from a large residential area by a congested highway. The city constructs a rapid-transit line with stations near the residential area, a university, and the downtown employment center.
The immediate effect is reduced travel time for residents who can reach the stations. Businesses gain access to a larger labor pool, students can travel more easily to the university, and land near stations may become more valuable because it offers better accessibility. Developers may respond by constructing apartments, offices, and retail near the stations.
However, the benefits are not automatically equal. If fares are high, routes bypass poorer neighborhoods, or rising land values displace existing residents, the new infrastructure can widen inequality. The correct geographic explanation must therefore identify both the infrastructure investment and its spatially uneven consequences.
Infrastructure and uneven urban development
Infrastructure often reveals political and economic priorities. Wealthier districts may receive dependable electricity, paved roads, frequent public transit, high-speed internet, and modern drainage, while informal settlements or peripheral neighborhoods may have intermittent services. This difference is called infrastructural inequality: unequal access to the systems required for safe and productive urban life.
Infrastructure can also produce a feedback effect. Areas with better services attract firms and residents, increasing tax revenue and investment; underserved areas may then lose opportunities, making it harder to finance improvements. A city can consequently display sharp contrasts between highly connected districts and neighborhoods only a short distance away.
AP skill focus: Skill 3.C
Topic 6.7 is assessed through Skill 3.C: Explain patterns and trends in maps, graphs, charts, and tables. For infrastructure questions, do more than identify that one area has “more roads” or “better access.” Explain the pattern by connecting the evidence to urban development.
For example, if a map shows higher population growth along a new rail corridor, a strong explanation would state that improved transportation accessibility reduces travel costs or commuting time, encouraging residential and commercial development near stations. The explanation must connect visual evidence → geographic process → urban outcome.
Misconception check
Misconception: Infrastructure always improves every part of a city.
Correction: Infrastructure increases capacity or accessibility, but its benefits depend on location, affordability, reliability, and political decisions. A highway may connect a city to regional markets while dividing neighborhoods; a transit line may improve mobility while raising nearby rents.
Retrieval check
A city extends clean-water pipes and paved roads to a peripheral settlement. Predict one demographic or economic change and explain the mechanism. A complete answer should name the infrastructure improvement, identify the resulting change in accessibility or service quality, and connect that change to development, population growth, land values, or employment.
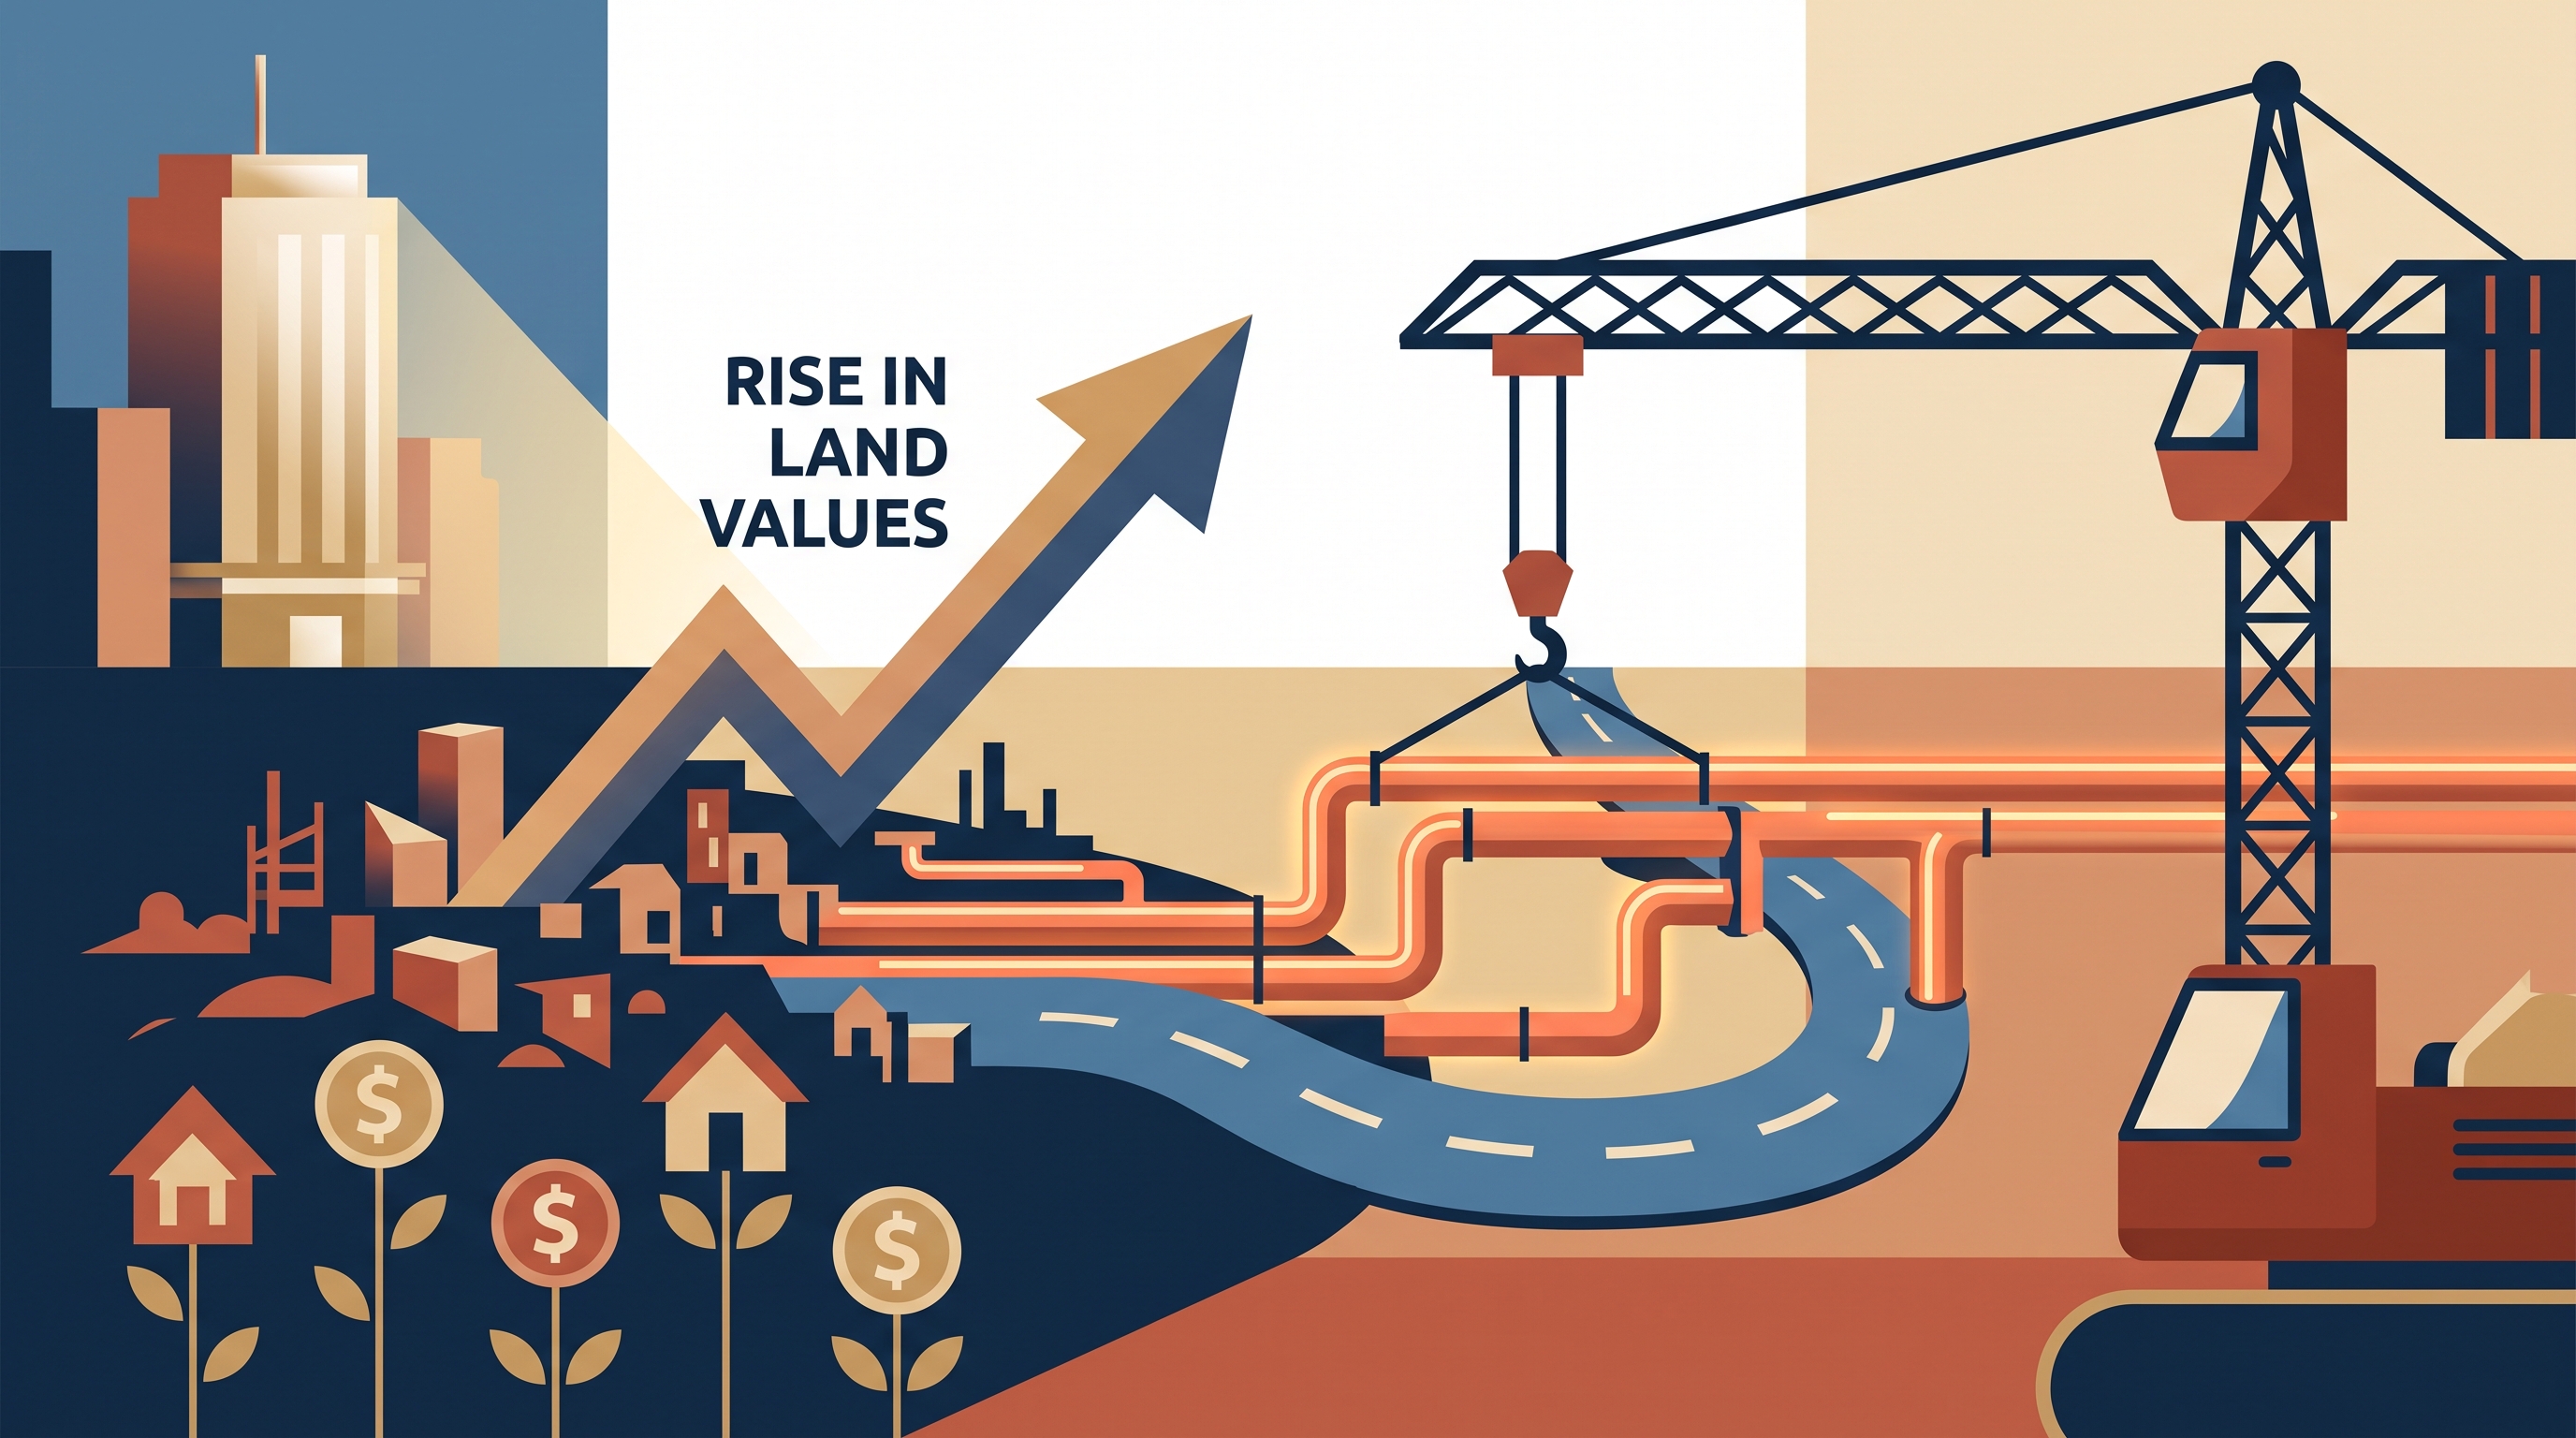
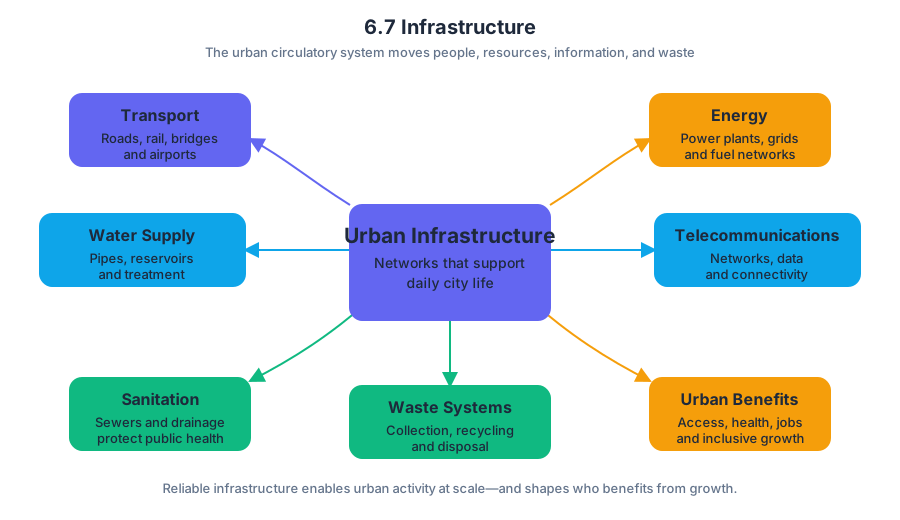
6.8 Urban Sustainability
Key concepts: Urban sustainability · Quality of life and standards of living · High-quality urban infrastructure · Suburban sprawl · Habitat fragmentation and biodiversity loss · Urban heat islands · Transportation networks and traffic congestion · Land-use competition · Transportation-oriented development (TOD) · Multilevel urban governance
Urban sustainability asks whether a city can support a good quality of life over time without exhausting the environmental, social, and economic systems on which residents depend.
6.8 Urban Sustainability
Urban sustainability asks whether a city can support a good quality of life over time without exhausting the environmental, social, and economic systems on which residents depend. A city may grow wealthier while becoming less sustainable if longer commutes, polluted air, lost habitat, rising heat, and unequal access to services undermine daily life.
Quality of life, standards of living, and sustainability
Quality of life describes residents’ overall well-being, including health, safety, education, access to employment, and environmental conditions. Standards of living focus more narrowly on material conditions such as income, housing, utilities, transportation, and access to goods and services. Urban sustainability connects the two: a city is more sustainable when it improves present well-being without shifting excessive environmental or social costs onto future residents.
The quality of previously established urban infrastructure matters because it determines whether residents can actually reach opportunities. Reliable housing, transportation, communications, schools, commercial buildings, public utilities, and health services can improve access to employment, education, health care, and daily necessities. However, infrastructure is not automatically sustainable: expanding roads may improve short-term mobility while encouraging automobile dependence, congestion, pollution, inefficient energy use, and further outward growth.
A useful way to trace an urban sustainability problem is:
Infrastructure or land-use decision
$\downarrow$
Change in accessibility and travel behavior
$\downarrow$
Environmental and social effects
$\downarrow$
Change in quality of life and long-term sustainability
A healthier urban environment can also produce economic benefits. Cleaner air, safer streets, effective sanitation, and dependable access to services can support a healthier workforce; fewer workers missing work because of illness can increase productivity and potentially raise a city’s gross domestic product, or GDP. Sustainability therefore is not simply “protecting nature”: it involves balancing environmental health, social well-being, and economic activity.
Suburban sprawl and environmental costs
Suburban sprawl is the outward, often low-density expansion of urban development into surrounding rural or undeveloped land. Sprawl commonly separates homes from workplaces, schools, and shops, increasing dependence on private vehicles and lengthening commuting distances.
The environmental effects form a connected chain:
| Sprawl-related change | Likely consequence |
|---|---|
| Development spreads across undeveloped land | Habitat fragmentation and decreased biodiversity |
| More residents commute longer distances | More traffic congestion and vehicle emissions |
| More roads and buildings cover land | Less land for local food production, conservation, or greenbelts |
| Larger transportation networks serve dispersed development | Greater energy use and potential contribution to urban heat islands |
Habitat fragmentation occurs when continuous ecosystems are divided into smaller, isolated patches by roads, buildings, and other development. Even if some vegetation remains, fragmented habitat may support fewer species because organisms lose feeding areas, migration routes, and breeding connections. The issue is not merely the total amount of land developed; where and how development divides the landscape also matters.
A common misconception is that suburban development is environmentally harmless because each individual neighborhood may contain trees or open lawns. The correction is that scattered development can create cumulative effects: roads divide habitats, driving increases, and land that could have supported conservation, greenbelts, or local food production is permanently converted.
Transportation planning and transportation-oriented development
Urban sustainability is closely connected to urban governance—the way decisions are made and implemented—and to transportation planning. Expanding a road network may increase capacity temporarily, but it can also encourage additional driving and produce more congestion. By contrast, transportation-oriented development, or TOD, concentrates housing, employment, services, and commercial activity near reliable public transportation.
For example, suppose a metropolitan area extends a rail line to a dense mixed-use district rather than building a highway through undeveloped land. Residents near stations may be able to walk to transit, jobs, schools, and shops, reducing the number of car trips. That can decrease congestion, air pollution, noise pollution, fuel use, and the pressure to build additional roads. The sustainability benefit comes from the linked land-use and transportation pattern—not from the rail line alone.
Governance affects whether such planning succeeds. Power may be dispersed or shared among central, subnational, and local governments. A central government may fund rail construction, a subnational government may coordinate regional routes, and local governments may control zoning around stations. If these governments pursue conflicting policies, transportation investment may fail to produce compact, accessible development.
Urban heat islands
An urban heat island is a built-up urban area that is warmer than nearby less-developed surroundings. Dense concentrations of pavement, roads, roofs, and buildings absorb and retain heat, while extensive transportation activity and energy use can add further heat. Sprawling transportation networks can therefore contribute to urban heat islands indirectly through greater pavement, automobile use, and inefficient energy consumption.
The key distinction is between a single project and its system-wide effect. A new road may make one trip faster, yet a metropolitan pattern of dispersed housing and automobile dependence can increase total vehicle travel, congestion, emissions, and heat. Conversely, compact development and effective public transportation can support sustainability by reducing car use and protecting undeveloped land.
Misconception check and retrieval
Misconception check: “Urban sustainability means stopping all growth.” Not necessarily. Sustainable urban growth improves access to housing, employment, education, services, and transportation while limiting pollution, inefficient energy use, habitat loss, congestion, and avoidable land consumption.
Retrieval check: A city builds a rail extension, but permits low-density development far beyond the stations. Identify one reason the project may produce fewer sustainability benefits than expected. A strong answer explains that if development remains dispersed, residents may still depend on cars; traffic, energy use, pollution, and land consumption may continue despite the transit investment. This reasoning applies 1.C: Explain geographic concepts, processes, models, and theories, 2.C: Explain spatial relationships, and 5.C: Explain how changing spatial scales affect geographic patterns and processes, especially through the Impacts and Interactions (IMP) and Spatial Process and Societal Change (SPS) big ideas.
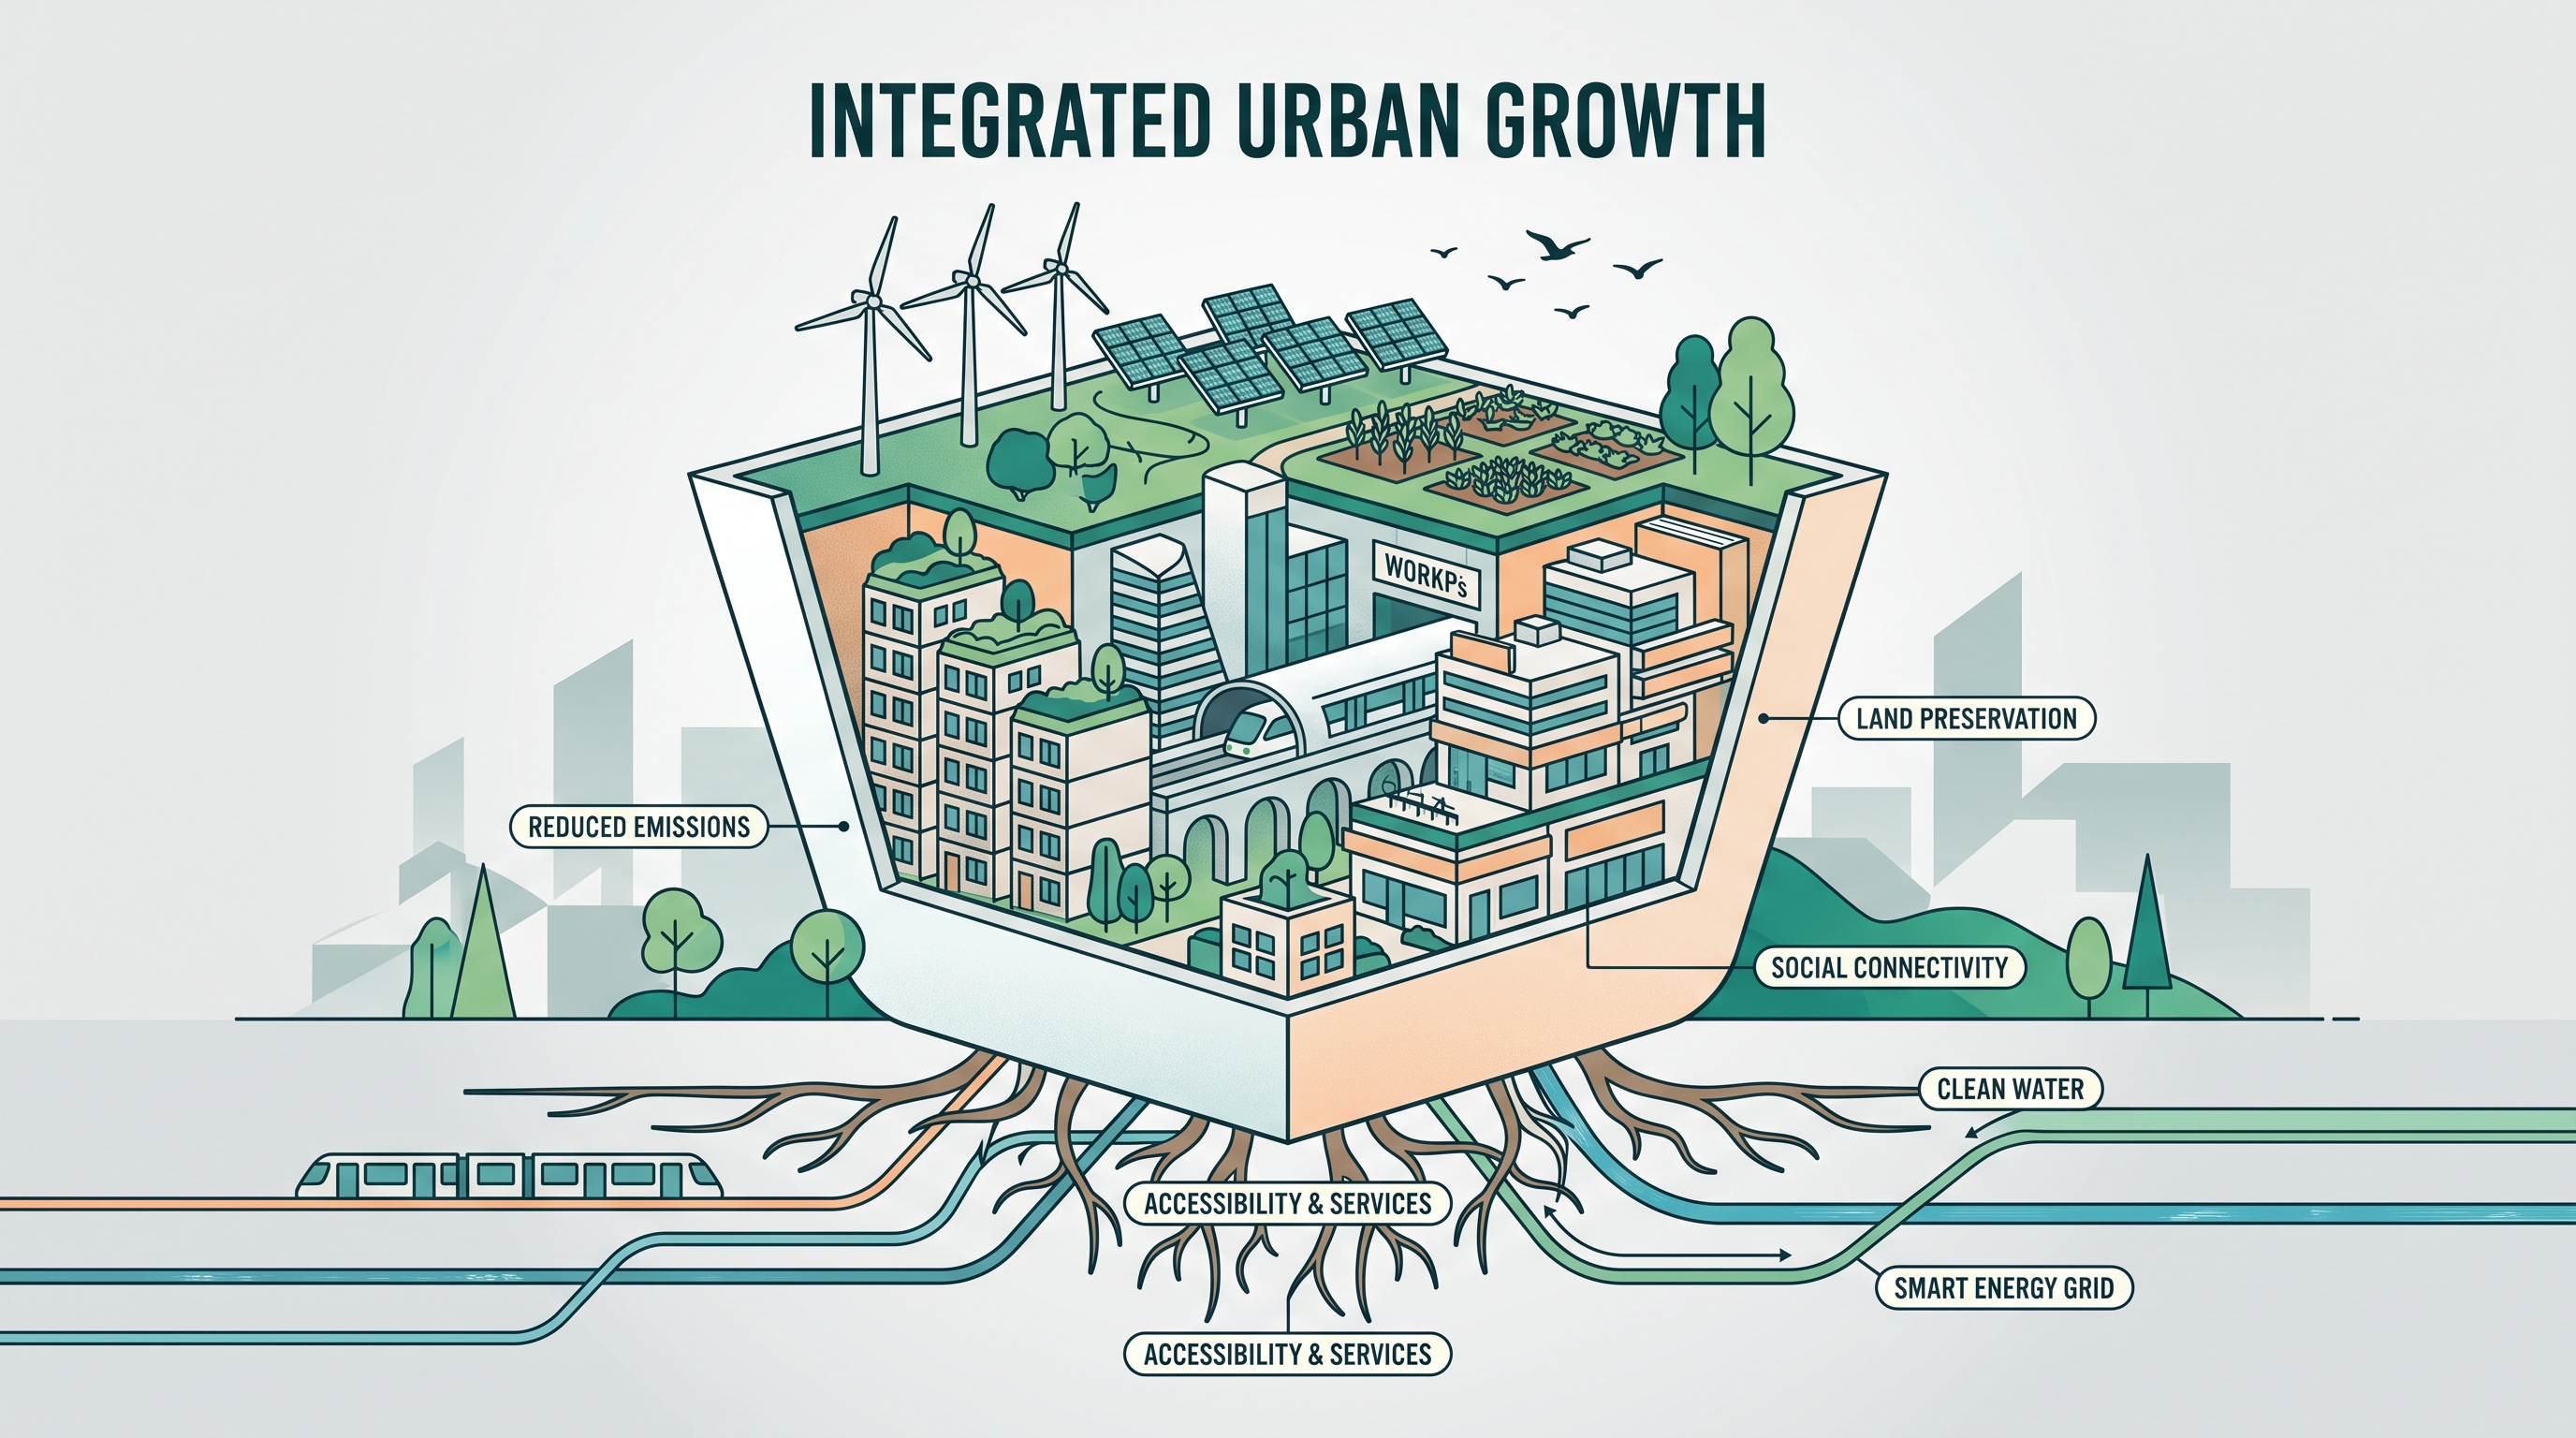
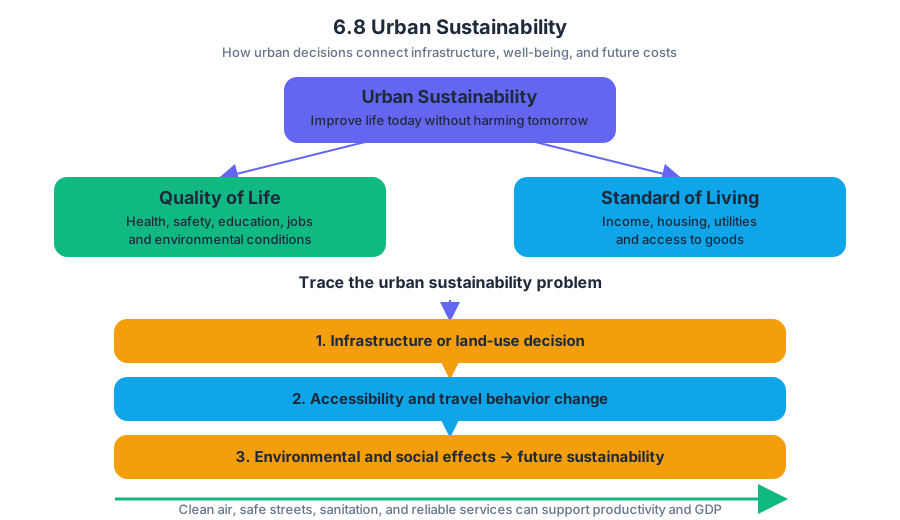
6.9 Urban Data
Key concepts: Urban housing affordability · High population density · Large or growing urban populations · Housing vacancies · Urban periphery · Distance from employment locations · Access to schools, transit, and services · Migrant housing difficulties
A city can grow faster than its housing supply, turning a population increase into higher rents, crowded neighborhoods, and long commutes. Urban data helps geographers connect these outcomes to measurable patterns such as population density, population growth, housing vacancies, and distance from employment locations.
6.9 Urban Data
A city can grow faster than its housing supply, turning a population increase into higher rents, crowded neighborhoods, and long commutes. Urban data helps geographers connect these outcomes to measurable patterns such as population density, population growth, housing vacancies, and distance from employment locations.
Investigative question: Why might migrants find housing difficult to obtain even when a city is expanding economically?
CED alignment: Topic 6.9 Urban Data; Learning Objective 6.9.A; Essential Knowledge 6.9.A.1. This topic primarily uses Skill 3: Data Analysis, especially 3.A Identify types of data presented in maps, charts, tables, diagrams, and images, 3.B Describe patterns and trends in data, and 3.C Explain patterns and trends in data. It also draws on Skill 2: Spatial Relationships, particularly 2.A Identify spatial patterns and processes, 2.B Describe spatial patterns and processes, and 2.C Explain spatial patterns and processes, plus Skill 5: Scale Analysis when the same urban pattern is examined at neighborhood, city, or metropolitan scales.
Housing pressure: density and population growth
High population density means that many people occupy a relatively small amount of land. Density does not automatically produce a housing crisis, because high-density cities can build apartments efficiently; however, when demand for housing exceeds the available supply, density can contribute to high housing costs and few vacant units.
A large or growing urban population creates additional demand for housing. Migrants arriving for employment, education, or family reasons may compete with existing residents for apartments and rooms. If construction does not keep pace with the number of new households, landlords can charge more and available vacancies can disappear quickly.
The distinction between density and growth matters:
| Urban condition | Immediate housing effect |
|---|---|
| High population density | Many households compete for limited space |
| Large urban population | A large absolute number of housing units is needed |
| Rapid population growth | Demand may increase faster than construction |
| Low vacancy rate | Few units are available for new residents |
| High housing costs | Lower-income migrants may be excluded or displaced |
Worked example: Suppose City A already has very high population density and receives a large number of migrants each year. If builders add $10{,}000$ housing units but new and existing households need $15{,}000$ units, the shortfall is $5{,}000$ units. That shortage can produce rising rents, overcrowding, informal housing, or migration toward less central locations. The strongest geographic explanation links the data to a mechanism: population pressure increases competition for a limited housing supply.
Why new housing moves outward
When centrally located land becomes scarce or expensive, available land for new housing may be found on the urban periphery, the outer edge of the built-up urban area. Peripheral housing may offer more space, but location creates a second problem: distance from employment locations, schools, transit, and service centers.
This produces a spatial trade-off:
$$ \text{Lower land cost} \longrightarrow \text{greater distance} \longrightarrow \text{higher travel time and transportation burden} $$
For example, a migrant household may find an affordable apartment on the urban edge but spend two hours traveling to work because employment remains concentrated near the city center or in major industrial and commercial districts. The unit is technically affordable, yet the household pays through time, transit fares, fuel costs, and reduced access to schools or health services.
Housing access is not only a supply problem
Housing access may also be controlled by a small number of owners or agents. These actors can set prices, require difficult documentation, restrict access to informal workers, or discriminate against migrants. Thus, two households with similar incomes may experience different housing opportunities because one faces exclusion in the rental or property market.
New housing may also be built in potentially hazardous areas, zones of disamenity—places with undesirable environmental or social conditions—or locations that are physically difficult to reach. Flood-prone land, steep slopes, polluted zones, and poorly connected peripheral settlements may be cheaper precisely because they carry greater risk or inconvenience.
Reading urban data correctly
A data-based explanation must do more than name two cities or repeat a percentage. First identify the pattern, then explain the relationship. For instance, if a table shows that cities with lower GDP per capita, such as Cairo or Dhaka, have higher percentage population growth, a valid explanation is that lower city GDP per capita corresponds with, or has an inverse relationship to, higher percentage population growth.
That relationship is an observed association, not proof that low GDP alone causes rapid growth. A careful explanation may connect the pattern to rural-to-urban migration, employment opportunities, natural increase, or differences in the timing of urbanization—but only when the available data support that interpretation.
Misconception check
Misconception: “High-density cities always have poor housing.” Density describes how concentrated people are; it does not by itself measure housing quality, affordability, or access. A high-density city may provide well-serviced apartments, while a lower-density city may have severe housing shortages if growth is rapid, land is poorly connected, or access is controlled by discriminatory owners.
Retrieval check
A city’s population grows rapidly, central vacancies fall, and new apartments appear on the outer edge of the metropolitan area. Give one housing consequence and one spatial consequence. A strong answer identifies high housing costs or few vacancies, then explains that peripheral housing increases distance from jobs, schools, transit, or service centers.
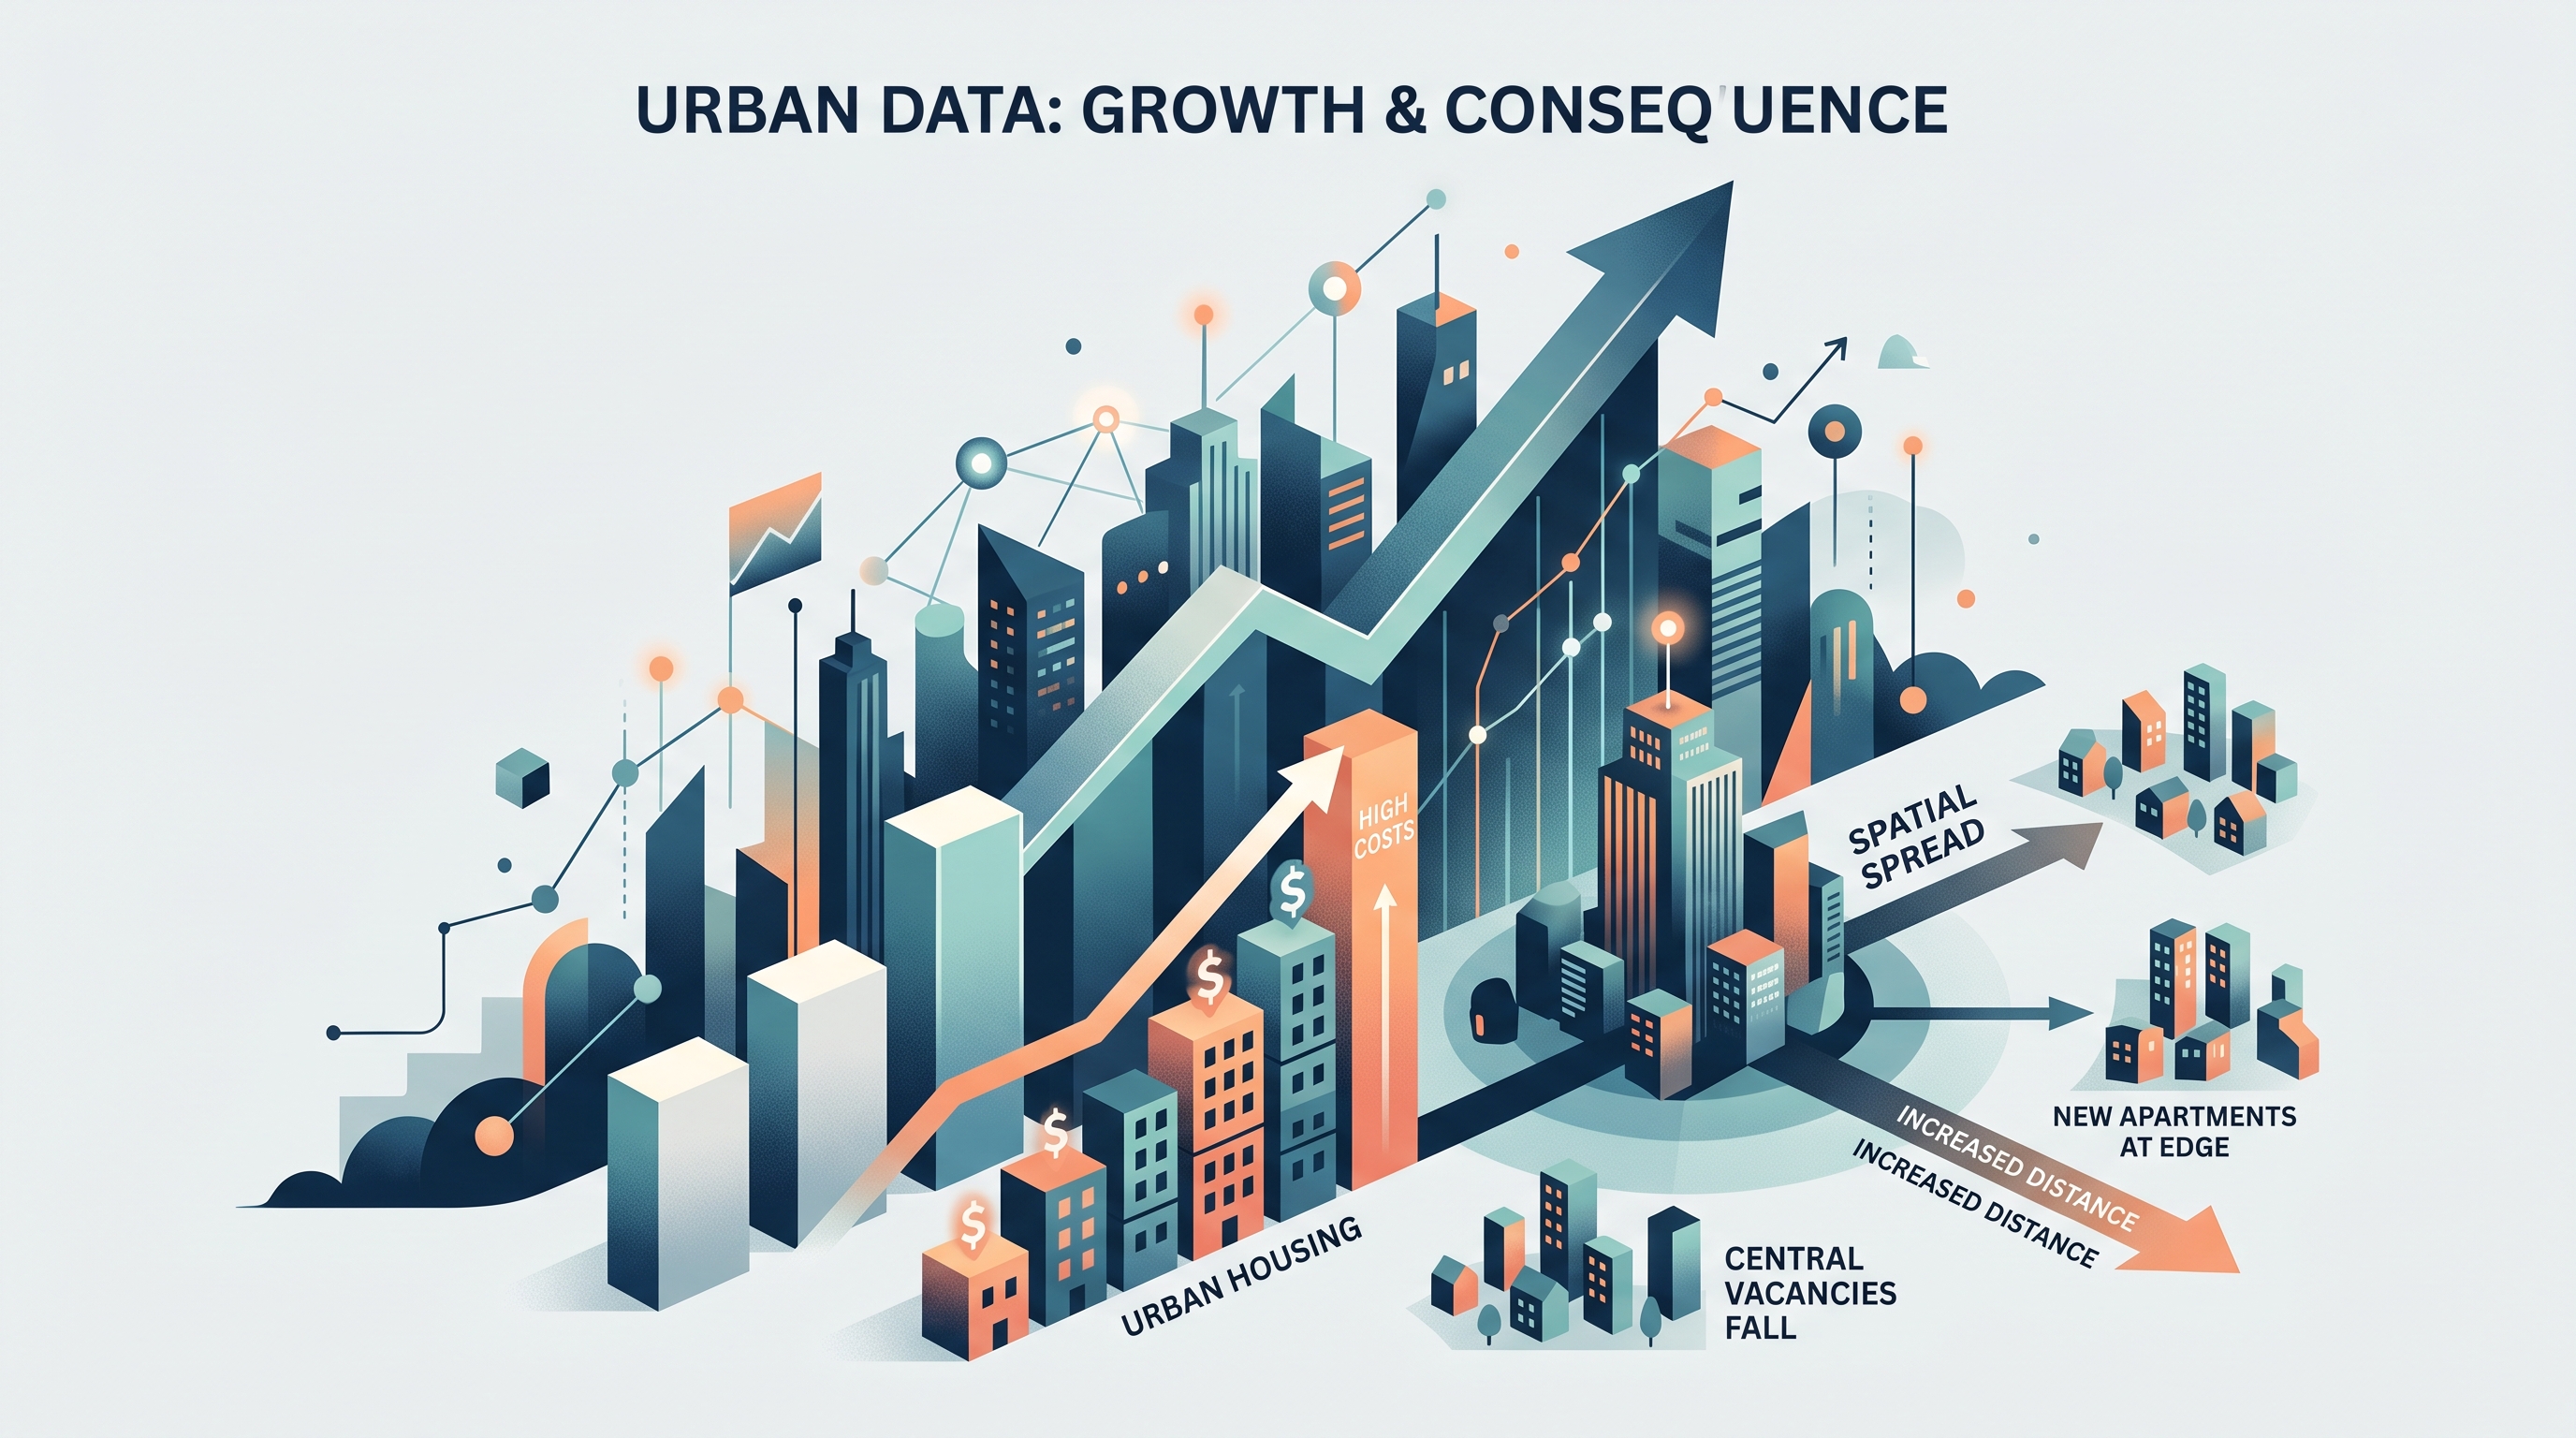
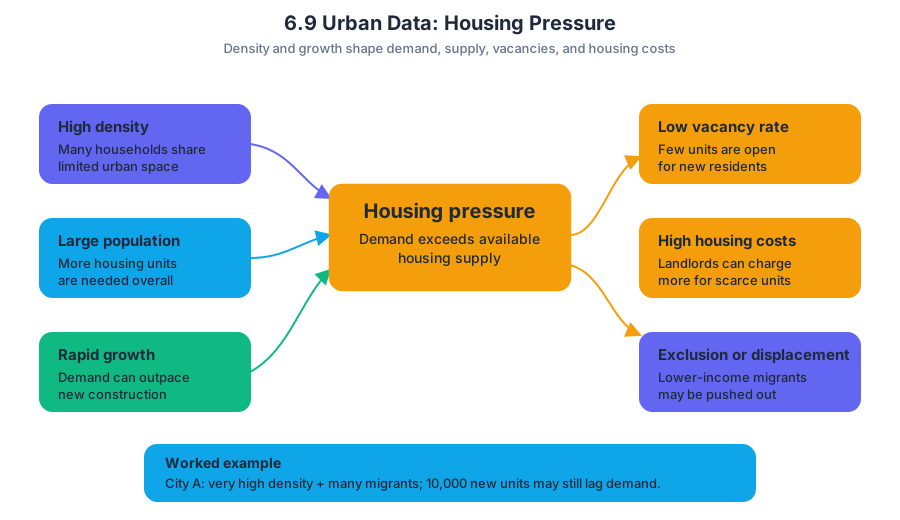
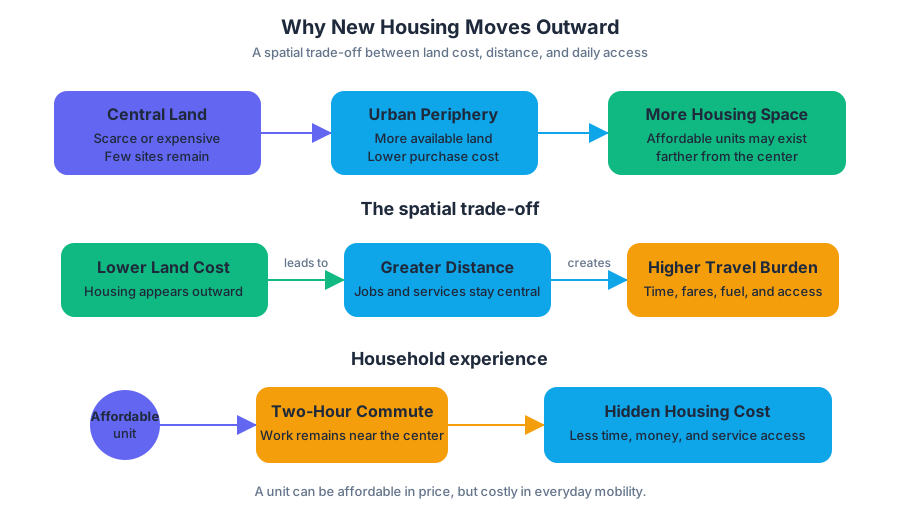
7.1 The Industrial Revolution
Key concepts: Industrial Revolution · Industrialization · Population growth · Diffusion of technology and industry · Urbanization · Changing class structures · Colonialism · Imperialism · Industrial raw materials and markets · Source analysis of maps, images, and landscapes
The Industrial Revolution was a major transformation in which new technologies, available natural resources, and mechanized production changed how people worked, lived, moved, and organized society.
7.1 The Industrial Revolution
The Industrial Revolution was a major transformation in which new technologies, available natural resources, and mechanized production changed how people worked, lived, moved, and organized society. It began in a particular industrial hearth but did not remain there: industrialization spread outward, producing both higher standards of living and geographically uneven development.
Enduring Understanding (SPS-7): Industrialization, past and present, has facilitated improvements in standards of living, but it has also contributed to geographically uneven development.
Learning Objective (SPS-7.A): Explain how the Industrial Revolution facilitated the growth and diffusion of industrialization.
Essential Knowledge:
SPS-7.A.1: Industrialization began as a result of new technologies and was facilitated by the availability of natural resources.
SPS-7.A.2: As industrialization spread it caused food supplies to increase and populations to grow; it allowed workers to seek new industrial jobs in the cities and changed class structures.
SPS-7.A.3: Investors in industry sought out more raw materials and new markets, a factor that contributed to the rise of colonialism and imperialism.
From new technology to industrial growth
Industrialization means the development and spread of machine-based manufacturing and large-scale industry. The process began when new technologies made it possible to produce goods more quickly and in greater quantities than household or small-workshop production. Natural resources supported this transformation by supplying the energy and raw materials that factories required.
The process can be represented as a chain:
A crucial geographic idea is diffusion: the movement of a process, innovation, or activity from one place to another. Industrialization first developed in a hearth in Europe and then expanded to other parts of Europe, North America, and East Asia. Its spread was not instantaneous or uniform; places with useful resources, transportation links, investment capital, labor, and access to markets were more likely to industrialize.
Food supplies, population growth, and urbanization
Industrialization helped increase food supplies through improved production, processing, transportation, and access to markets. When food became more abundant and reliable, death rates could decline and populations could grow. Population growth then supplied factories with both workers and consumers, creating a reinforcing relationship between industrial production and demographic change.
Industrial jobs were concentrated in cities, where factories could gather labor, power, transportation, and financial services in one place. Workers therefore migrated from rural areas toward industrial cities in search of wages. This process contributed to urbanization, the growth in the number and proportion of people living in urban areas.
The movement can be visualized as a feedback loop:
Worked example: A rural worker who once depended on agricultural labor may move to a growing factory city because a textile mill offers regular wages. The worker’s arrival increases the city’s labor supply; the factory’s production attracts merchants and transport services; and the expanding city creates additional jobs. The result is not simply “people moving to cities,” but a connected process involving employment, migration, markets, and urban growth.
Changing class structures
Industrialization changed class structures by expanding the industrial working class, whose members earned wages in factories, mines, and related jobs. It also strengthened an industrial and commercial investor class that owned factories, financed production, or controlled trade. Social position increasingly reflected relationships to industrial capital and wage labor, not only land ownership or inherited status.
These changes produced both opportunity and inequality. Industrialization could improve incomes, access to manufactured goods, transportation, and public services over time, yet its benefits were unevenly distributed among regions and social groups. A city might display modern factories and prosperous investors alongside crowded housing and poorly paid workers.
Misconception check: Industrialization did not immediately improve living conditions for everyone. The long-term process facilitated improvements in standards of living, but early industrial growth could involve dangerous work, pollution, overcrowding, and severe inequality.
Raw materials, markets, colonialism, and imperialism
Industrial investors sought two things beyond the factory: raw materials for production and markets where manufactured goods could be sold. As industrial production expanded, investors and states searched across wider territories for supplies and consumers. This economic demand helped contribute to the rise of colonialism, the establishment of political control over another territory, and imperialism, the broader extension of power or influence over other regions.
The connection is causal rather than merely chronological:
| Industrial need | Geographic consequence |
|---|---|
| More raw materials | Expansion of overseas economic and political control |
| More markets | Pressure to connect other regions to industrial trade |
| Investment opportunities | Infrastructure and production organized around imperial interests |
| Industrial competition | Uneven development among regions integrated into the system differently |
Colonialism and imperialism did not develop from industrial demand alone, but the search for resources and markets was an important factor. Industrial power therefore reshaped political relationships as well as economic landscapes.
Reading industrialization in maps and landscapes
Source Analysis (4.D): Compare patterns and trends in visual sources to draw conclusions. When examining a map, image, or landscape, identify where industrial activity is concentrated, compare regions, and connect visible patterns to possible causes such as resources, transportation, labor, investment, or markets.
Worked visual analysis: Suppose a map shows early industrial concentrations near resource-rich areas and major transport routes, followed later by expanding clusters in North America and East Asia. A strong conclusion would identify the spatial pattern, describe the diffusion from the original European hearth, and explain that resources, transportation, investment, and market access helped industrialization spread. Do not claim that every location along a route industrialized equally; pattern shows distribution, while explanation requires evidence about the process.
Retrieval check: Why could industrialization increase both standards of living and geographic inequality? In two connected sentences, explain one pathway from industrialization to improved living conditions and one pathway from industrialization to uneven development.
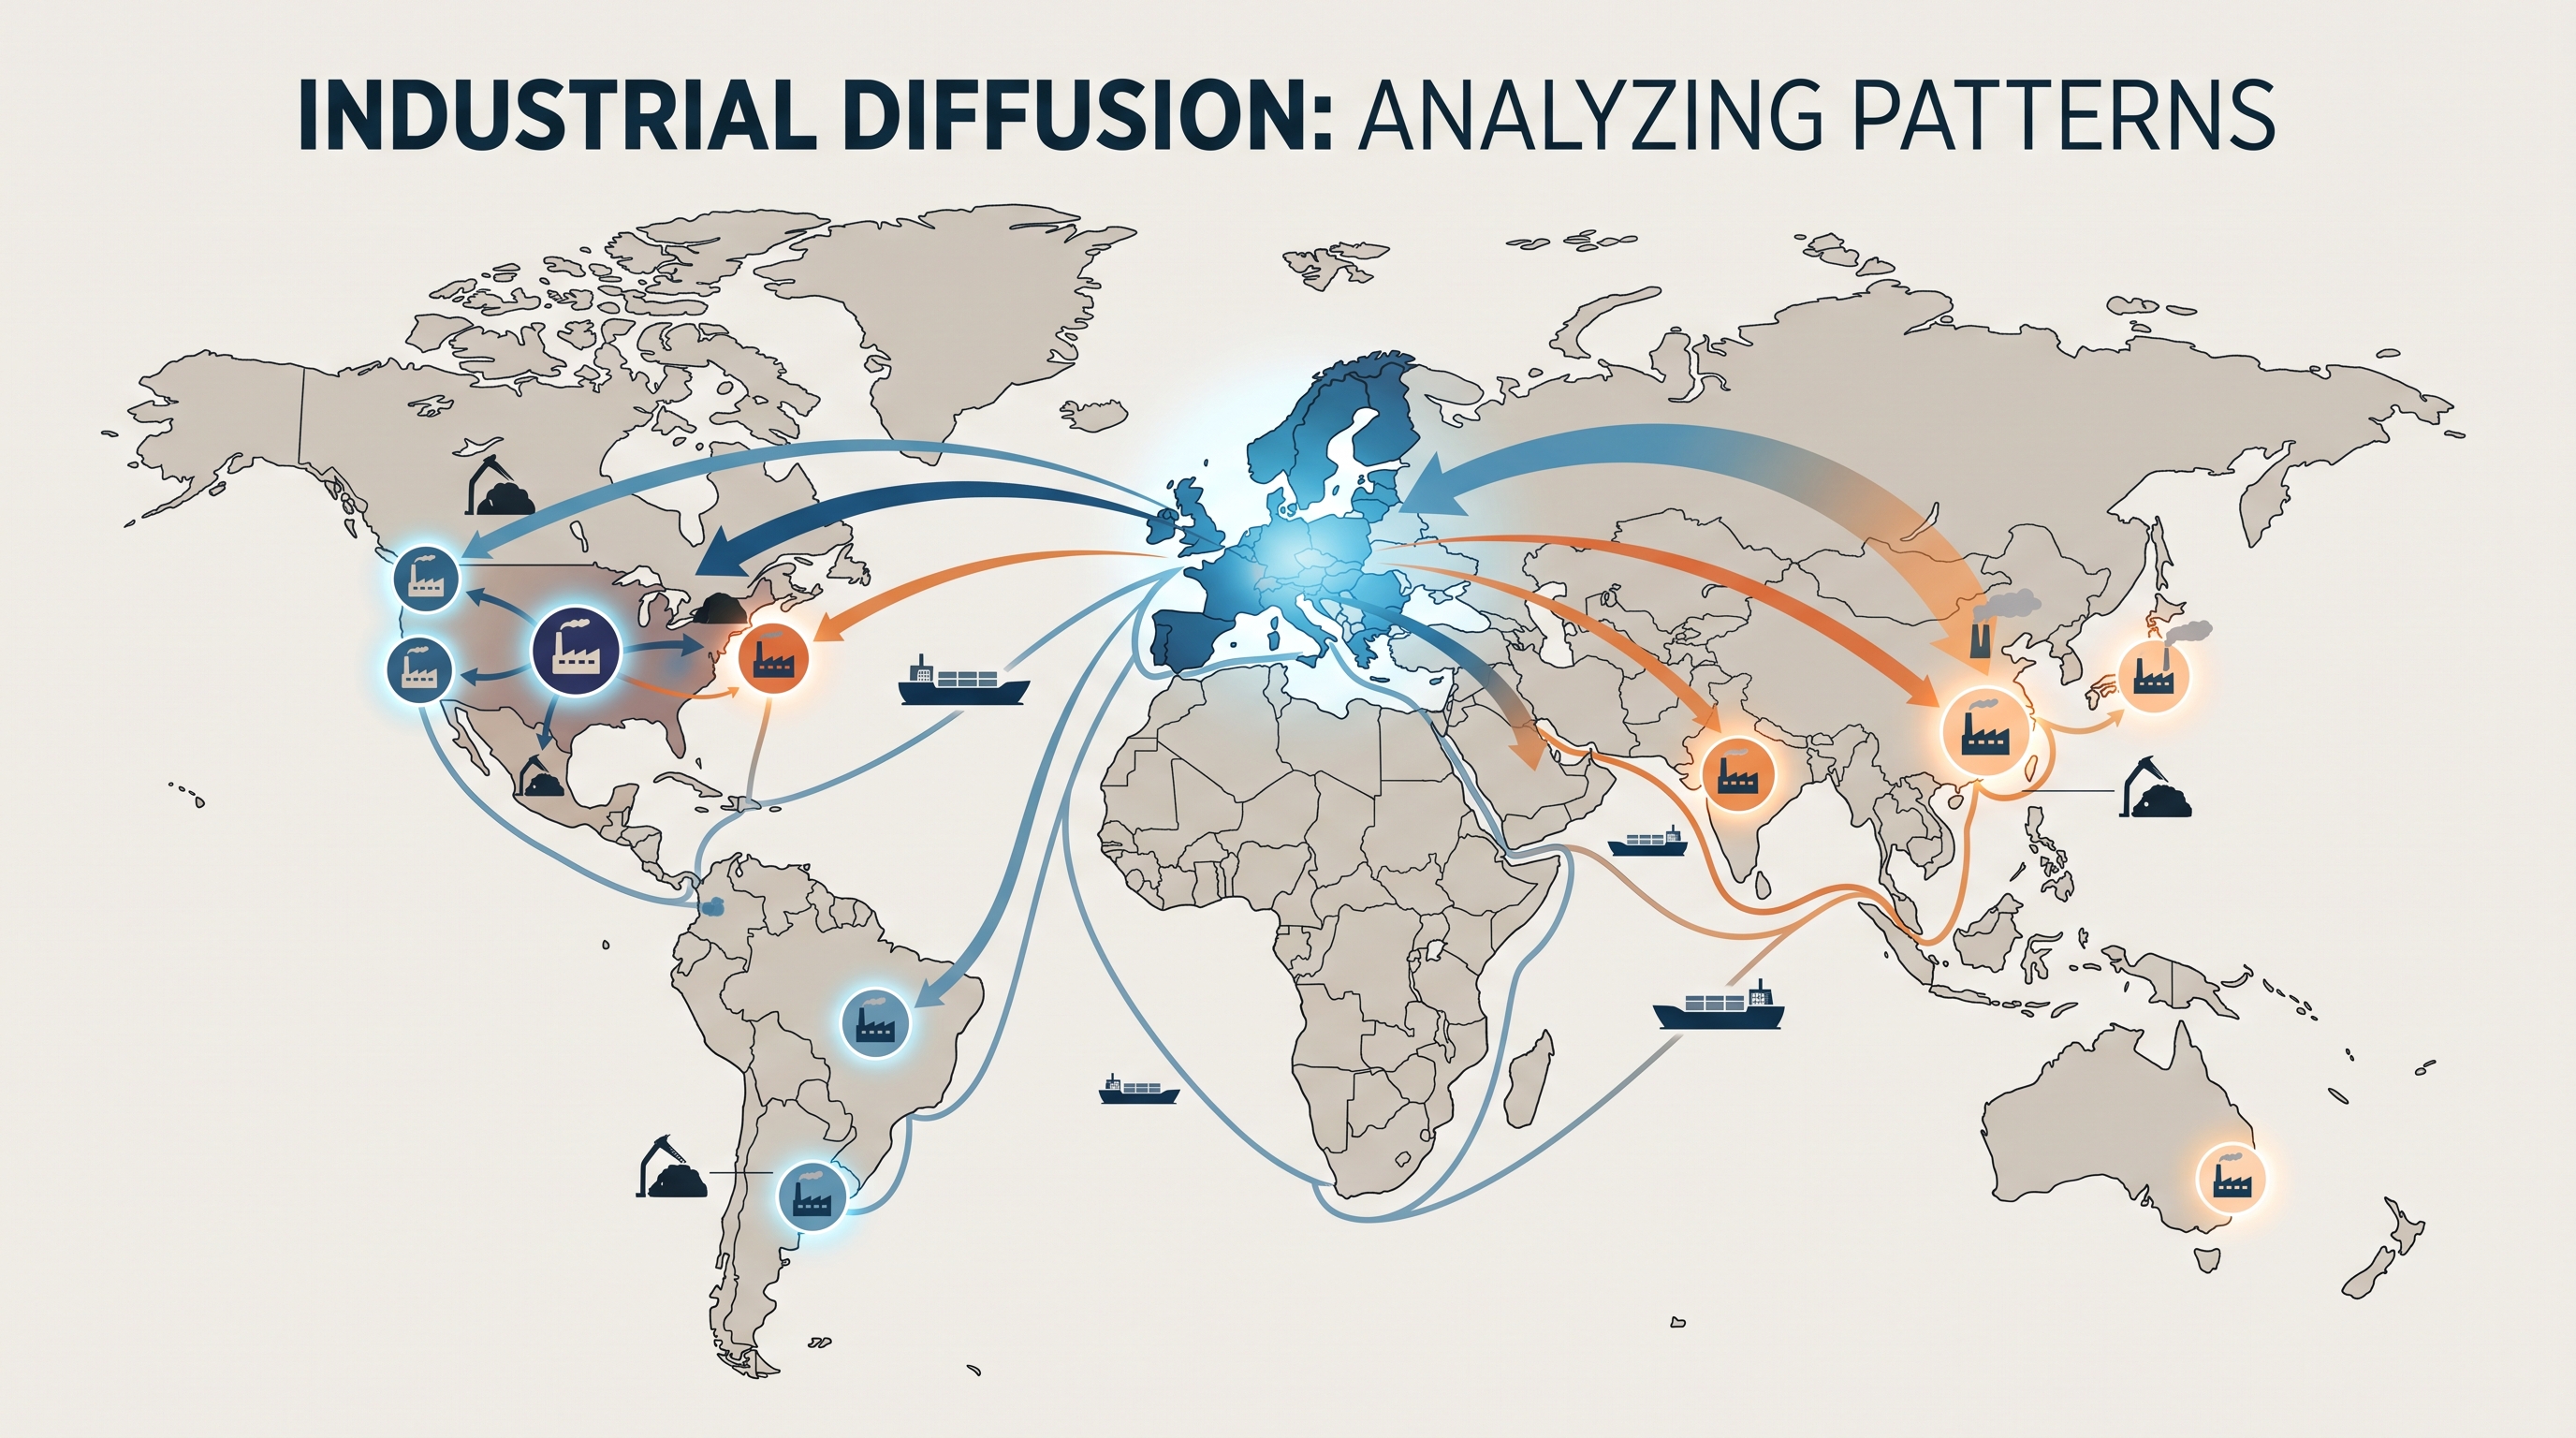
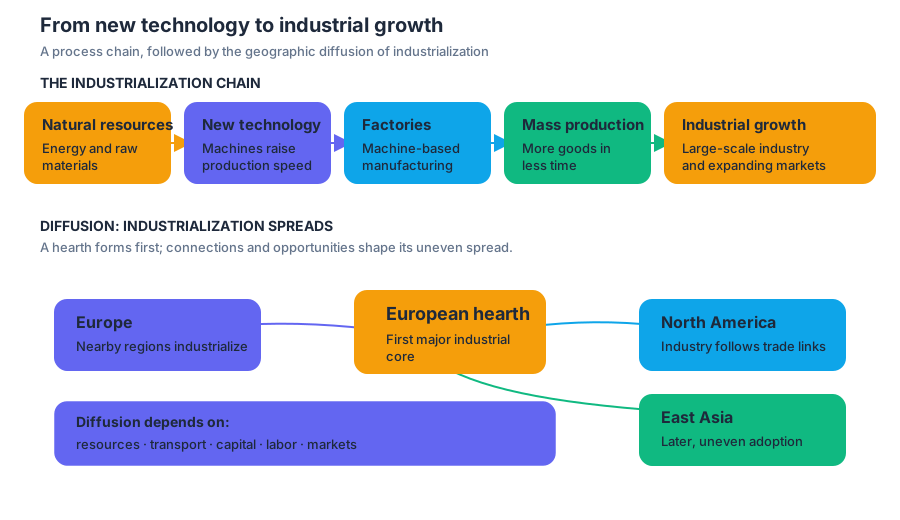
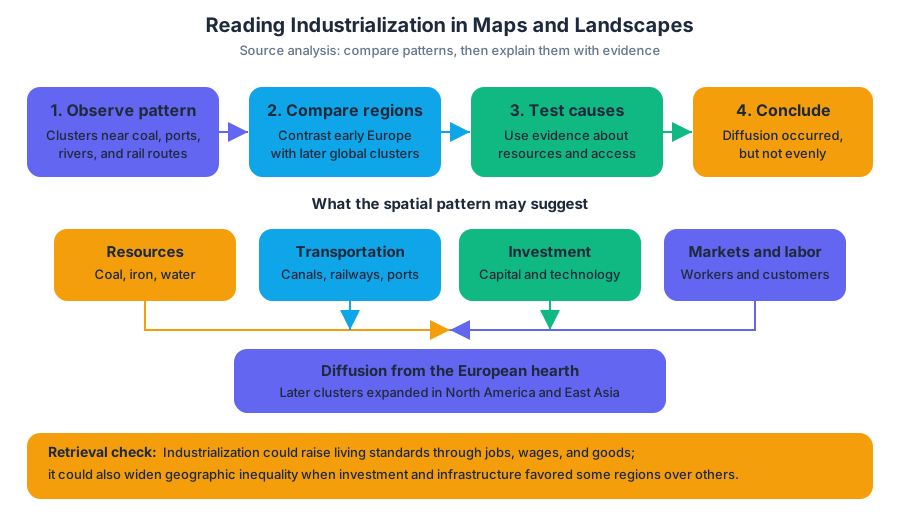
7.2 Economic Sectors and Patterns
Key concepts: Primary, secondary, tertiary, quaternary, and quinary economic sectors · Development patterns associated with different economic sectors · Core, semiperiphery, and periphery locations · Manufacturing location factors · Labor as a determinant of industrial location · Transportation networks and shipping containers · Break-of-bulk points · Least-cost theory · Markets and resources as influences on manufacturing location · Growth poles and infrastructure’s effects on society
A smartphone connects several economic sectors before it reaches your hand: minerals are extracted, components are manufactured, software is designed, advertising and retail services sell it, and researchers or executives coordinate innovation and strategy.
7.2 Economic Sectors and Patterns
A smartphone connects several economic sectors before it reaches your hand: minerals are extracted, components are manufactured, software is designed, advertising and retail services sell it, and researchers or executives coordinate innovation and strategy. Economic sectors classify these activities by the kind of work they perform, while economic geography asks where those activities cluster and why.
Learning Objective SPS-7.B: Explain how economic sectors are spatially distributed and how changes in economic sectors affect development.
The five economic sectors
The sectors form a useful chain, although real economies often combine them:
| Sector | Main activity | Illustrative example |
|---|---|---|
| Primary | Extracting or harvesting natural resources | Mining copper, fishing, farming timber |
| Secondary | Processing raw materials and manufacturing goods | Producing steel, cars, or microchips |
| Tertiary | Providing services to people and businesses | Retail, transportation, banking, education |
| Quaternary | Producing and managing information, knowledge, and technology | Software development, research, data analysis |
| Quinary | High-level decision-making and specialized leadership | Government leadership, corporate executives, advanced policy planning |
A country’s sectoral composition—the relative importance of its sectors—often changes with development. Primary activities may dominate where economies depend heavily on resource extraction; secondary manufacturing commonly expands during industrialization; and tertiary, quaternary, and quinary activities become increasingly important in highly developed economies.
Spatial patterns: core, semiperiphery, and periphery
The core-periphery model describes an uneven global economic pattern. Core locations generally concentrate advanced services, research, corporate headquarters, capital, and high-value decision-making. Periphery locations often supply raw materials or lower-cost labor, while semiperiphery locations occupy an intermediate position: they may manufacture goods for global markets while also developing specialized services and technology.
These categories describe relationships, not permanent rankings. A region can be peripheral in one activity and core in another. For example, a place may export agricultural commodities but operate as a regional core for banking, transportation, or higher education.
Growth pole: A concentration of economic activity that stimulates growth in surrounding areas.
A growth pole may be a research university, technology district, hospital, government-sponsored zone, or cluster of new businesses. It attracts investment, specialized labor, suppliers, and infrastructure; these connections can spread employment and economic activity into nearby communities. The effects are not automatically equal, however: growth may also increase land prices, traffic, inequality, pollution, and pressure on water or energy supplies.
Why manufacturing locates where it does
Manufacturing location reflects a search for the lowest combined production cost. Least-cost theory predicts that an industry tends to locate where transportation, labor, land, energy, materials, and other costs together are minimized—not necessarily where any single cost is lowest.
$$ \text{Total production cost}
\text{transportation cost} + \text{labor cost} + \text{land, energy, and resource costs} $$
Manufacturers compare several forces:
- Resources: Resource-oriented industries, such as paper mills or metal processing, may locate near bulky or heavy raw materials.
- Labor: Labor-intensive industries may seek abundant, affordable workers; high-technology industries often seek highly educated or specialized labor instead.
- Markets: Producers of perishable, fragile, or expensive-to-ship goods may locate near consumers.
- Transportation: Ports, railways, roads, warehouses, and logistics networks reduce the time and cost of moving inputs and finished products.
A break-of-bulk point is a location where goods are transferred between transportation modes. A seaport is a classic example: cargo may move from an ocean vessel to rail, trucks, or barges. Because transferring cargo costs time and money, warehouses, processing plants, distribution centers, and manufacturing may cluster near these points.
Shipping containers and the changing map of industry
Standardized shipping containers allow cargo to move efficiently between ships, trains, and trucks without unloading each item separately. Containerization lowers handling costs, reduces damage, and strengthens long-distance supply chains. As ports expand and connect to roads, railways, warehouses, and inland distribution hubs, manufacturing can locate farther from both raw materials and final markets while remaining connected to global networks.
Improved infrastructure can therefore increase economic activity and access. It can also produce costs: expanded ports and factories may increase pollution, resource consumption, congestion, habitat loss, and vulnerability to supply-chain disruptions. A port that creates jobs may simultaneously intensify air pollution or depend on energy-intensive transport.
Development does not erase older sectors
A national economy can shift from manufacturing toward services and technology while particular regions retain longstanding productive sectors. A rural area may continue farming, a mining district may remain resource-based, or a manufacturing city may preserve specialized factories even after national employment moves toward tertiary and quaternary work.
Misconception check: A country becoming more developed does not mean that its primary or secondary sectors disappear. Their relative share may decline, while their productivity, technology, or regional importance remains substantial.
Retrieval check
A shoe factory is choosing between an inland location with cheap labor and a port location with excellent container connections. Explain how least-cost theory, the break-of-bulk point, labor, markets, and infrastructure could produce either decision. Then identify one possible environmental consequence and explain how the factory might function as—or connect to—a growth pole.
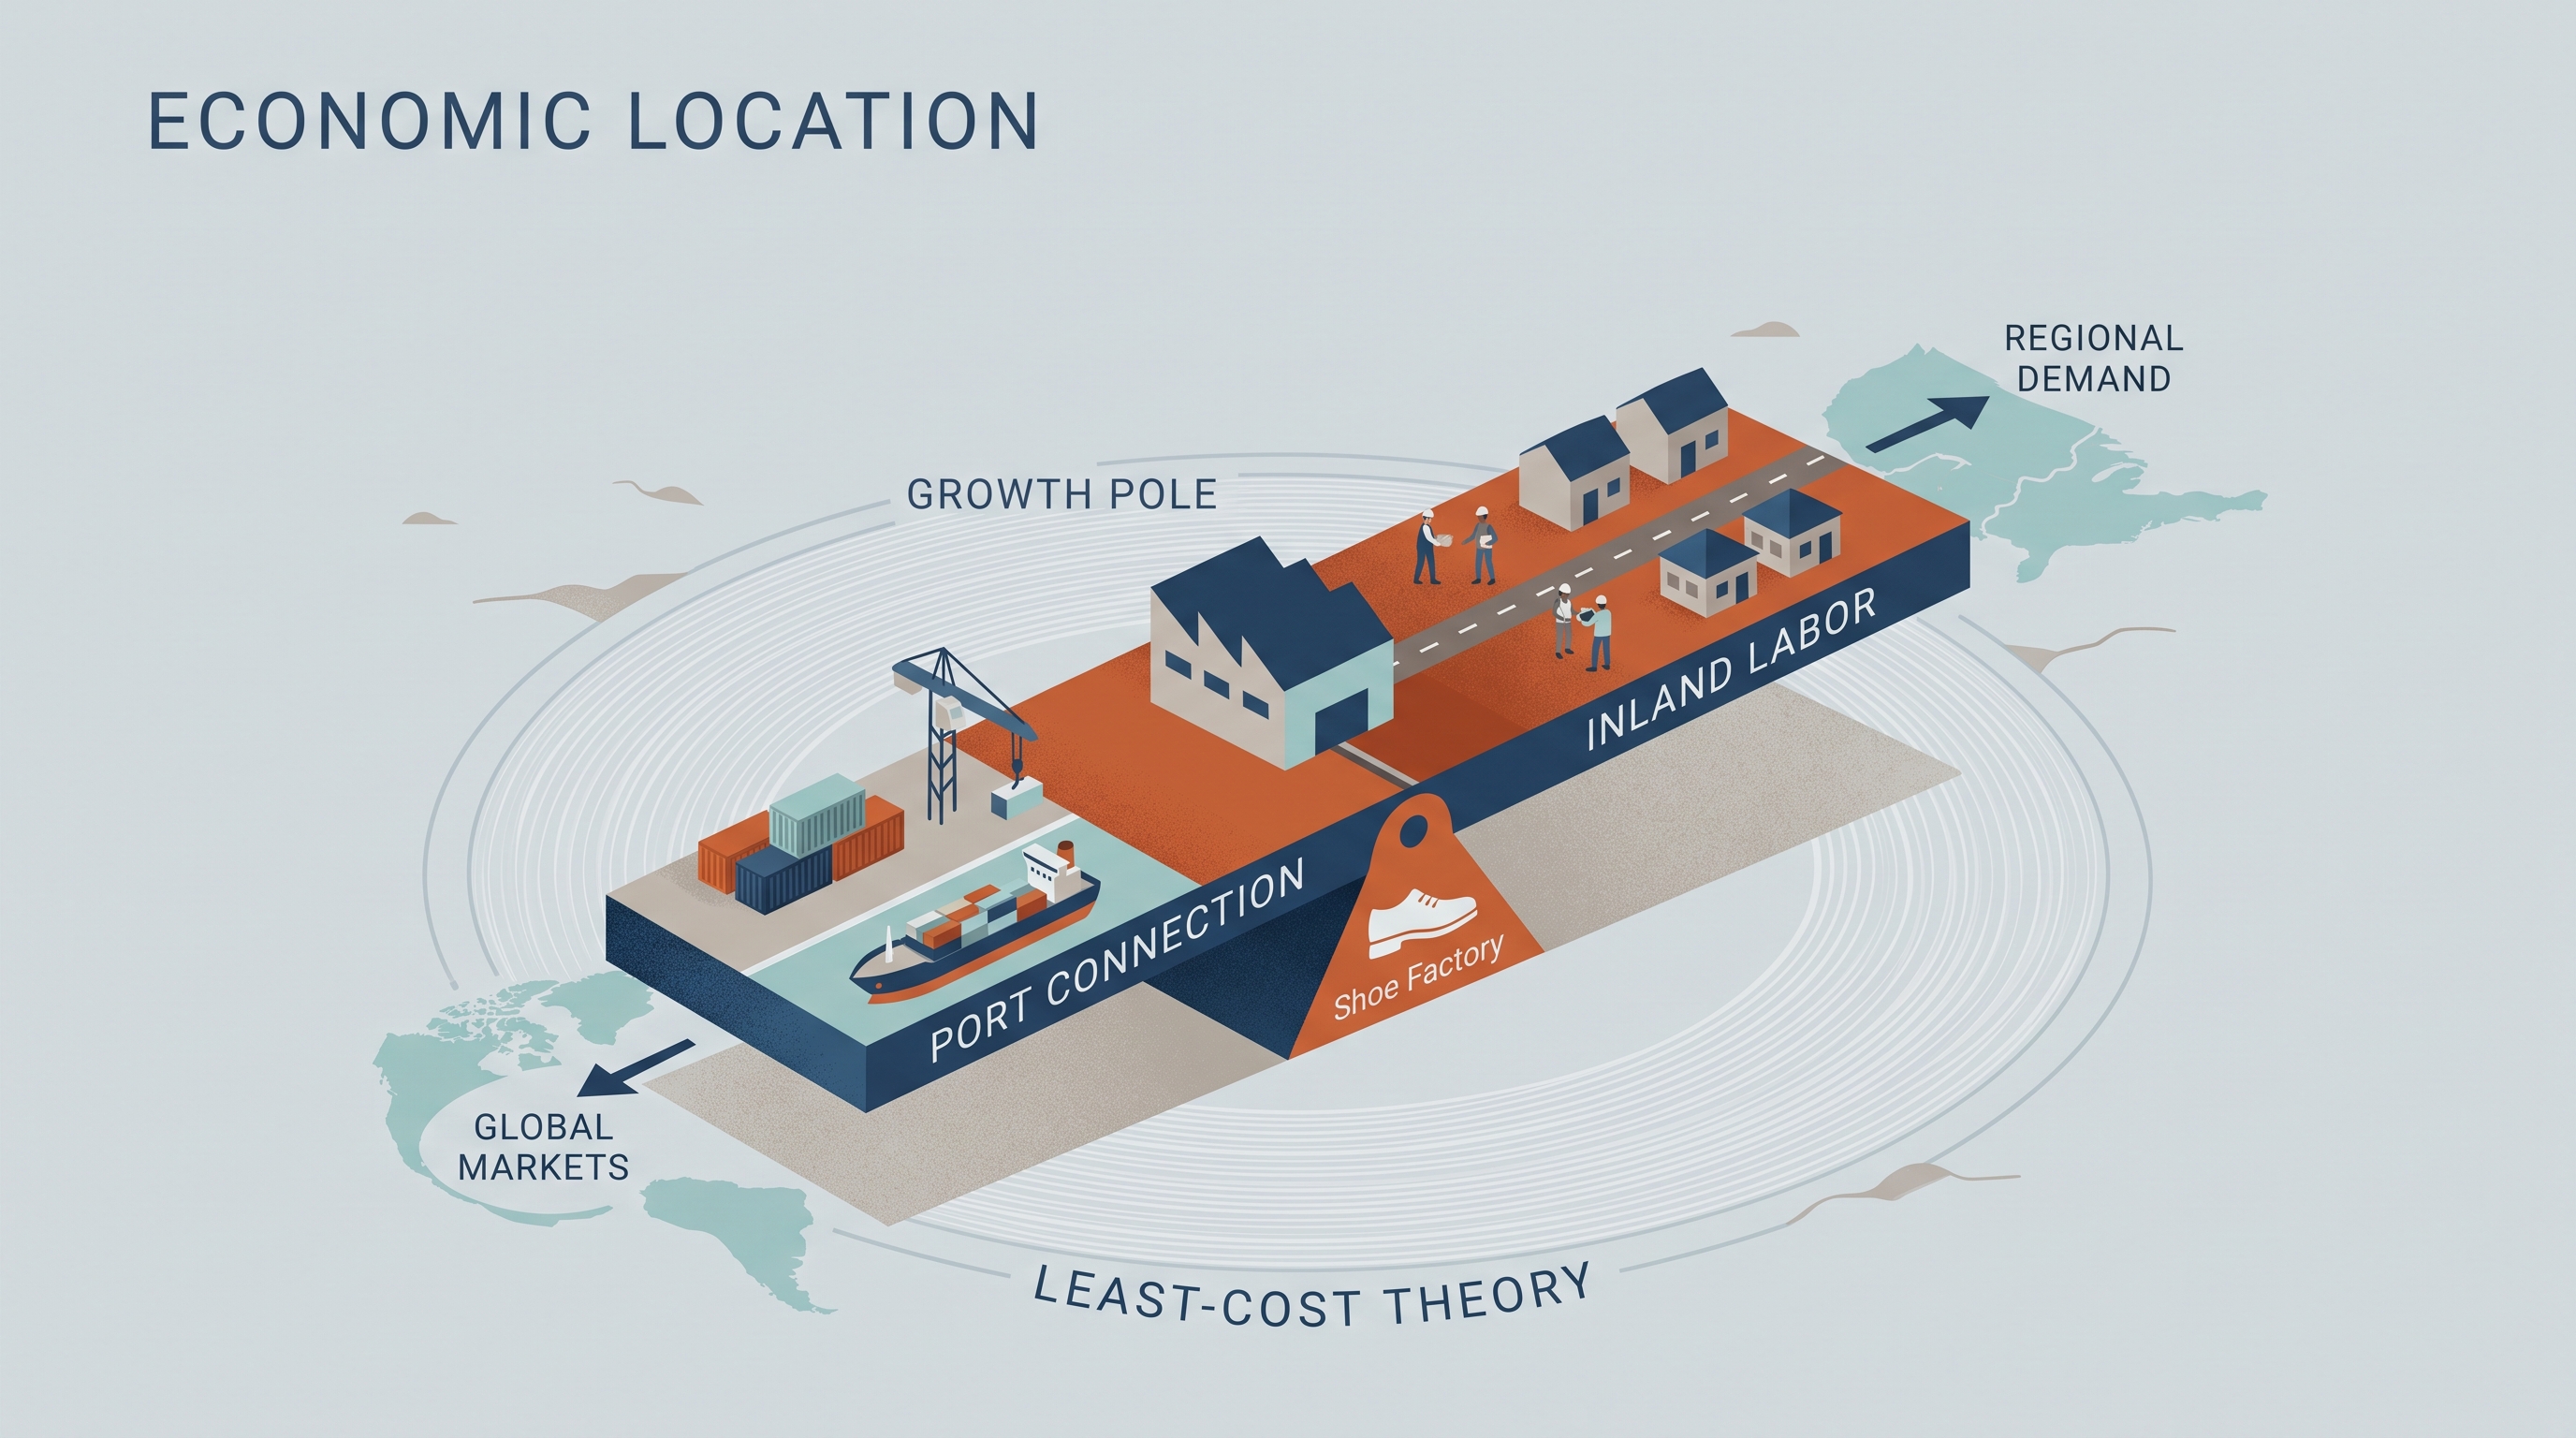
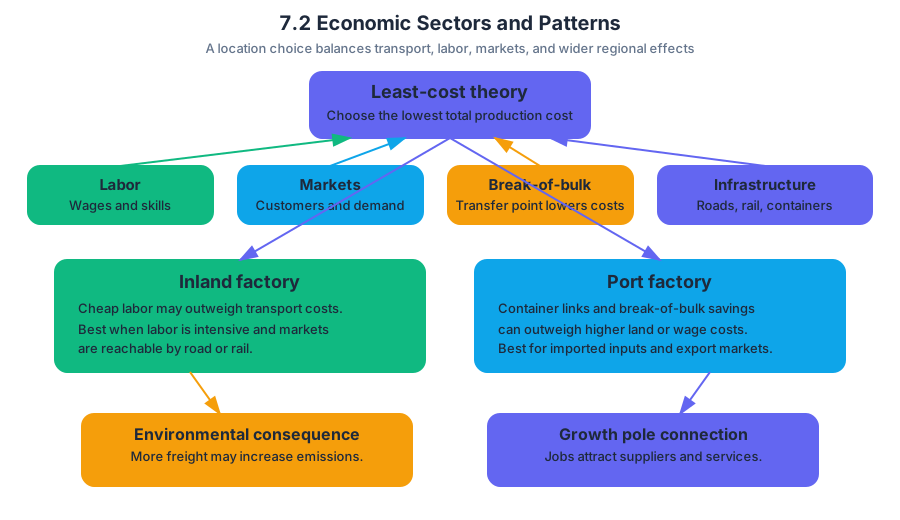
7.3 Factors Driving Industrialization
Key concepts: Urbanization · Migration to cities · Population growth in urban areas · Economic growth · Trade · Industrialization · Economic development · Transportation infrastructure expansion · Communication infrastructure expansion · Governance
Industrialization reshapes places by concentrating jobs, investment, infrastructure, and people in connected urban areas. A factory may begin as a single workplace, but its demand for labor, transport, housing, markets, and communication can transform an entire city.
7.3 Factors Driving Industrialization
Industrialization reshapes places by concentrating jobs, investment, infrastructure, and people in connected urban areas. A factory may begin as a single workplace, but its demand for labor, transport, housing, markets, and communication can transform an entire city.
Urbanization is the growth in the proportion and number of people living in urban areas. Industrialization is the expansion of machine-based manufacturing and related economic activity. Industrialization often drives urbanization, but urbanization can also be accelerated by population growth, migration, trade, infrastructure, governance, and broader economic development.
CED alignment: Learning Objective 7.3.A — Explain the factors that drive industrialization and urbanization. The relevant Essential Knowledge is commonly represented as 7.3.A.1, identifying economic, demographic, infrastructural, technological, governmental, and locational forces that shape urban growth.
The urbanization feedback loop
Urban growth rarely has one cause. Instead, several processes reinforce one another: industries attract workers; workers increase the urban population; a larger population creates markets; expanding markets attract more businesses; and tax revenue supports additional infrastructure.
| Driving factor | Mechanism of urban growth |
|---|---|
| Migration to cities | People relocate from rural areas or other countries to seek employment, education, services, or safety. |
| Population increase | Natural increase adds residents, even without migration. |
| Economic growth | Rising incomes and expanding businesses create jobs and demand for services. |
| Trade | Ports, crossroads, logistics centers, and commercial regions attract firms and workers. |
| Industrialization | Factories and processing facilities concentrate employment and investment. |
| Transportation systems | Roads, railways, ports, and airports improve accessibility and connect cities to markets. |
| Communication systems | Telecommunications and digital networks coordinate production, finance, services, and migration. |
| Governance | Development policies, zoning, and urban planning direct investment and control land use. |
| Situation | A city’s relationships with other places influence its function and growth. |
How the factors work together
Migration and population growth
Migration to cities directly increases urbanization because people move from rural, pastoral, farming, mining, fishing, or forest-based communities into metropolitan areas. Migrants may be responding to economic opportunities, while cities gain labor, consumers, cultural connections, and new demand for housing and services.
Population can also rise through natural increase, meaning births exceed deaths. Thus, an urban area may grow because existing residents have children, because migrants arrive, or because both processes occur simultaneously. A city’s population increase is therefore not automatically evidence of industrial growth.
Economic growth, trade, and industrialization
Economic growth expands the production of goods and services. Trade strengthens urbanization when a city occupies a favorable position in networks connecting producers, consumers, ports, suppliers, or neighboring regions. A coastal port, for example, may grow because warehouses, shipping firms, manufacturers, retailers, and financial services cluster around its trade connections.
Industrialization intensifies this process by concentrating factories and related activities. Manufacturing requires workers, energy, raw materials, transportation, finance, and markets. The resulting employment can attract migrants, while the growing workforce encourages construction, retail, education, health care, and public administration.
Infrastructure, technology, and governance
The expansion of transportation systems lowers the effective distance between a city and other places. Railways can connect mines to factories; highways can link suburbs to employment centers; ports can connect producers to global markets. Communication systems perform a similar coordinating function by allowing firms, governments, and households to exchange information rapidly across distance.
Governance also drives urbanization. Governments may use development policies, zoning, and urban planning to locate industries, build housing, extend utilities, establish special economic zones, or designate transport corridors. These decisions do not merely respond to urban growth; they can actively produce it.
Worked example: explaining urban growth
Suppose a previously small coastal settlement becomes a major urban area. A strong explanation would connect several mechanisms: the settlement’s situation near international shipping routes encourages trade; a new port and railway improve transportation; factories locate nearby to reduce shipping costs; jobs attract rural-to-urban migrants; population growth expands the labor force and consumer market; and government zoning directs additional investment into industrial and residential districts.
The key is causation. “The city grew because it became important” is too vague. “The port connected the city to external markets, attracting factories that created jobs and encouraged migration” identifies a factor and explains how it produced urban growth.
Misconception check
Misconception: Urbanization always means industrialization. Urban areas can grow through government investment, trade, services, migration, natural increase, or administrative reclassification even when manufacturing is limited. Conversely, industrialization may cause environmental problems, housing shortages, or uneven development rather than universally improving living conditions.
Retrieval check
A city gains a railway, attracts factories, receives rural migrants, and expands its housing supply. Identify two factors driving urbanization and explain the causal link for each. A strong answer should name the factor—such as transportation expansion or industrialization—and state how it increases jobs, accessibility, investment, or population.
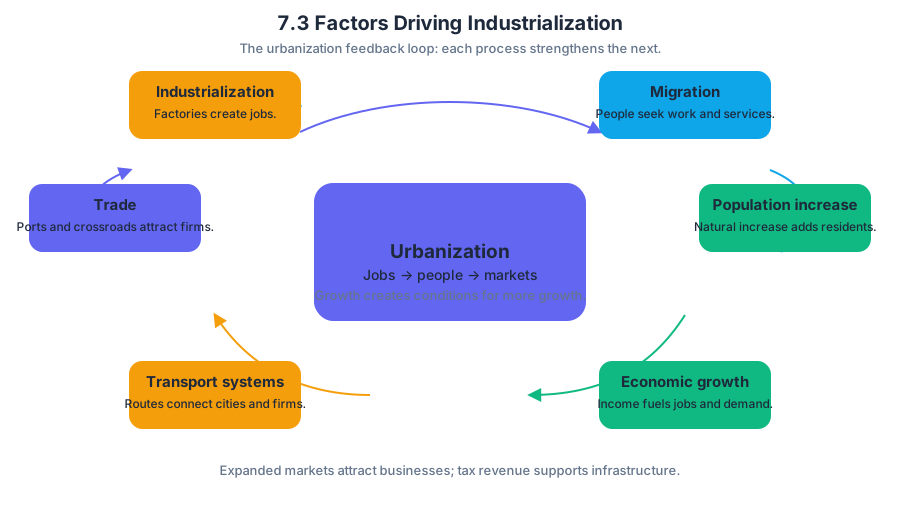
7.4 Women and Economic Development
Key concepts: Women’s roles change as countries develop economically · Women’s participation in the workforce · Gender inequality in wages · Inequality in employment opportunities · Microloans · Small local businesses created by women · Improved standards of living · Gender parity · Government initiatives at different scales · Using quantitative and geospatial data to draw conclusions
Economic development can expand women’s economic choices without automatically producing gender equality. As economies change, women often move into paid employment and entrepreneurship, yet wage gaps and unequal access to desirable jobs may persist.
7.4 Women and Economic Development
Economic development can expand women’s economic choices without automatically producing gender equality. As economies change, women often move into paid employment and entrepreneurship, yet wage gaps and unequal access to desirable jobs may persist.
SPS-7.D — Learning Objective: Explain how and to what extent changes in economic development have contributed to gender parity.
This topic belongs to SPS-7, the enduring understanding that industrialization has improved standards of living but has also produced geographically uneven development. Gender parity means a condition in which women and men have comparable access to rights, resources, opportunities, and decision-making power. Economic development can move societies toward parity, but the result is neither automatic nor evenly distributed.
Changing Roles as Economies Develop
SPS-7.D.1 — The roles of women change as countries develop economically. In economies based heavily on subsistence agriculture, women may perform essential agricultural and household labor without receiving formal wages or being counted fully in employment statistics. As industrialization and service-sector growth expand, more women may enter factories, offices, schools, health systems, retail businesses, and professional occupations.
A useful pattern is:
$$ \text{economic development} \rightarrow \text{more diverse employment} \rightarrow \text{greater workforce participation} $$
But the next step is not guaranteed:
$$ \text{greater workforce participation} \not\Rightarrow \text{equal wages or equal opportunities} $$
For example, a country may experience economic growth as manufacturing and service industries expand. Women’s labor-force participation may rise because new employers need workers and because education, transportation, childcare, or urbanization make paid employment more accessible. However, women may still be concentrated in lower-paid occupations, excluded from senior management, or expected to perform unpaid domestic work in addition to paid employment.
Participation Is Not the Same as Equity
SPS-7.D.2 — Although there are more women in the workforce, they do not have equity in wages or employment opportunities. Workforce participation measures whether women work or seek work; it does not measure whether they receive the same pay, occupy the same types of jobs, or have equal chances for promotion.
| Indicator | What it measures | What it cannot prove by itself |
|---|---|---|
| Women’s labor-force participation | The share of women working or seeking work | Equal wages or leadership access |
| Gender wage gap | Difference in average earnings between women and men | The full causes of the difference |
| Share of women in management | Representation in higher-level positions | Equality in every occupation |
| Employment rate | The share of a population with jobs | Whether jobs are secure, fairly paid, or voluntary |
Named misconception — “More women working means gender parity has been achieved.” This is incorrect. A country can show rising female employment while women remain underpaid, concentrated in informal or insecure work, blocked from certain occupations, or responsible for disproportionate unpaid household labor.
Microloans and Women-Owned Businesses
SPS-7.D.3 — Microloans have provided opportunities for women to create small local businesses, which have improved standards of living. A microloan is a small loan designed for people who may lack conventional collateral or access to commercial banking. For a woman in a low-income community, a microloan can provide start-up capital for a food stall, tailoring service, market garden, repair shop, or other small enterprise.
The development pathway is local and cumulative:
$$ \text{microloan} \rightarrow \text{business investment} \rightarrow \text{income} \rightarrow \text{household spending on food, health, or education} $$
Consider a woman who borrows a small amount to purchase sewing equipment. She sells clothing locally, repays the loan, and earns income that may improve household nutrition, school attendance, housing, or access to health care. The business can also create employment for relatives or neighbors, so its effect extends beyond the borrower.
Microloans are not a universal solution. Interest costs, unstable markets, limited infrastructure, household responsibilities, or discrimination can restrict their benefits. Their significance is that they may give women greater control over income and create an economic role outside unpaid household labor.
Government Action and Uneven Progress
Government initiatives at the local, regional, national, and international scales may affect women’s economic opportunities. Policies such as equal-pay rules, anti-discrimination protections, parental-leave provisions, childcare support, transportation investment, education programs, business credit, and legal recognition of property rights can reduce barriers to employment and entrepreneurship.
The geographic outcome depends on implementation. A national policy may exist on paper while rural communities lack banks, transportation, schools, or enforcement agencies. Therefore, development can produce uneven progress among urban and rural women, regions, income groups, and ethnic populations.
Data Analysis: Measuring the Pattern
The suggested skill is Data Analysis (3.D): Compare patterns and trends in maps and in quantitative and geospatial data to draw conclusions. A strong analysis compares at least two variables rather than treating one statistic as a complete explanation.
Suppose a map shows higher female workforce participation in a country’s industrialized coastal cities, while a second dataset shows that women in those cities still earn less than men on average. The conclusion should be precise: economic development has increased women’s participation in paid work, but it has contributed only partially to gender parity because wage inequality remains.
Retrieval check: If women’s workforce participation rises from $40%$ to $60%$, but women’s average wages remain below men’s and women remain underrepresented in management, has gender parity been achieved? Explain using SPS-7.D.1, SPS-7.D.2, and one piece of quantitative or geospatial evidence.

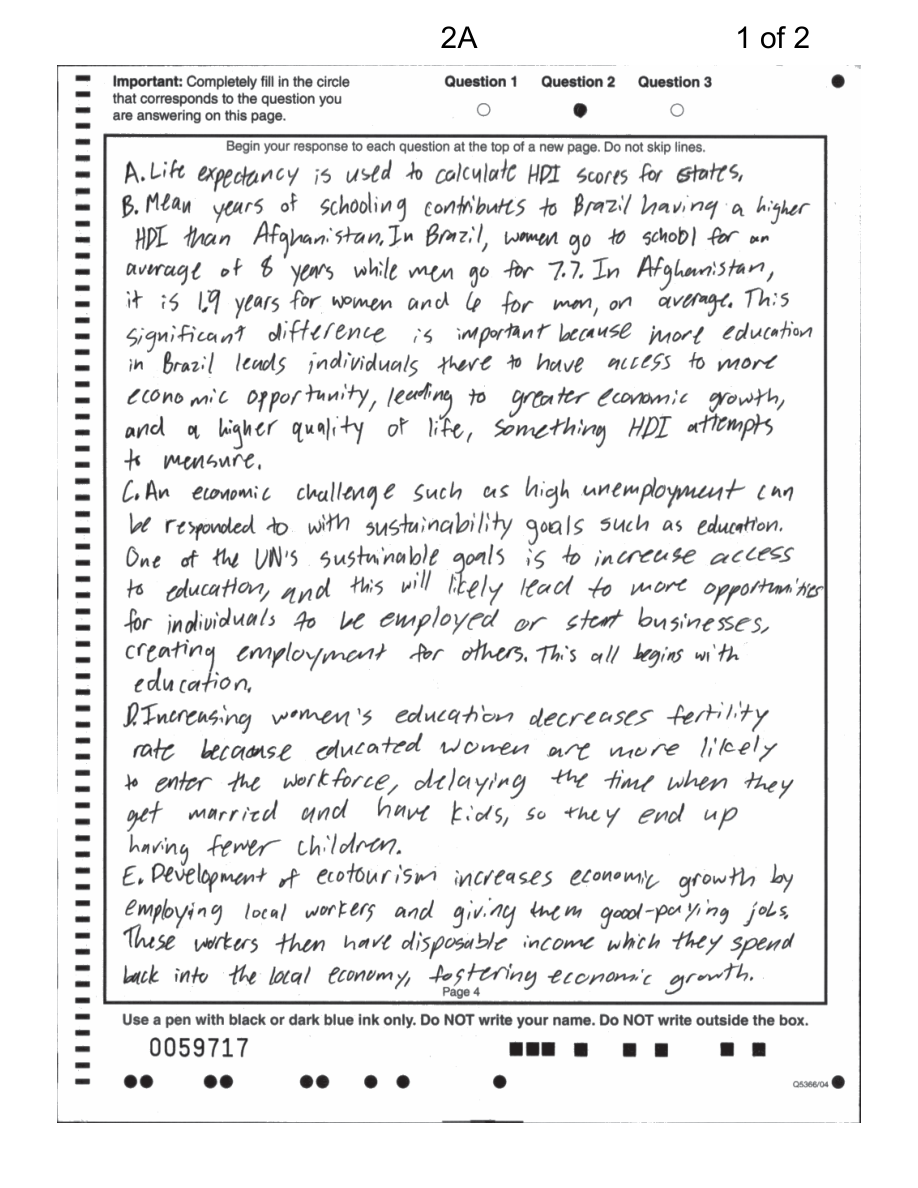
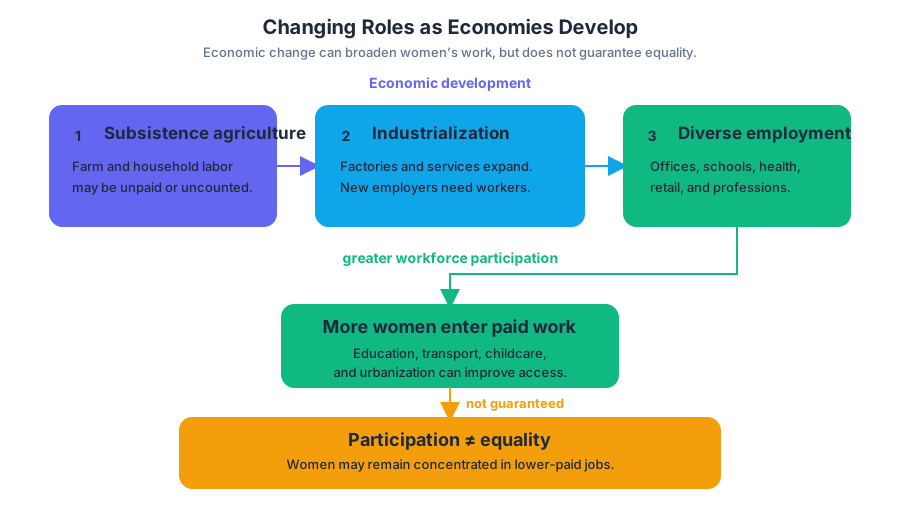
7.5 Theories of Development
A country can export valuable commodities and still remain vulnerable to poverty, debt, and unstable growth. Theories of development are explanations of why some places achieve higher levels of economic and social well-being than others—and why development does not follow one universal path.
7.5 Theories of Development
A country can export valuable commodities and still remain vulnerable to poverty, debt, and unstable growth. Theories of development are explanations of why some places achieve higher levels of economic and social well-being than others—and why development does not follow one universal path.
Four theories, four different explanations
The major theories in 7.5.A disagree about the causes of development. Rostow’s Stages of Economic Growth presents development as a sequence that countries move through. Wallerstein’s World System Theory emphasizes a global economic structure organized around unequal relationships. Dependency theory argues that historical exploitation keeps some countries dependent on wealthier countries. Commodity dependence focuses on the risks created when a country relies heavily on a small number of exported raw materials.
| Theory | Main question | Basic explanation | Typical limitation |
|---|---|---|---|
| Rostow’s Stages of Economic Growth | Where is a country in the development sequence? | Countries progress through five stages from traditional society to high mass consumption. | Treats Western industrialization as a universal pathway. |
| Wallerstein’s World System Theory | How is the global economy organized? | Countries occupy core, semiperiphery, or periphery positions in a connected system. | Categories can oversimplify changing and internally diverse economies. |
| Dependency theory | Why do poorer countries remain poor? | Wealthy countries and institutions benefit from economic relationships that constrain poorer countries. | Can understate domestic policies, innovation, and successful development strategies. |
| Commodity dependence | Why is an export economy vulnerable? | Reliance on a few primary commodities exposes a country to price swings and weak bargaining power. | Describes a major vulnerability but does not explain every cause of underdevelopment. |
Rostow’s Stages of Economic Growth
Rostow’s Stages of Economic Growth describes five stages: traditional society; preconditions for takeoff; takeoff; drive to maturity; and the age of high mass consumption. The model connects development to industrialization, investment, technological change, and expanding consumer markets.
A country in the traditional society stage depends mainly on subsistence agriculture and has limited technology. During preconditions for takeoff, infrastructure, education, financial institutions, and political changes begin supporting growth. Takeoff occurs when investment and industrial production increase rapidly. In the drive to maturity, technology spreads through more sectors. Finally, the age of high mass consumption features widespread consumer goods, advanced services, and high incomes.
Worked example: Imagine Country A, where most workers farm with hand tools. The government builds roads, expands schools, and establishes banks. A textile industry then attracts investment and employs large numbers of workers. If manufacturing diversifies into machinery, communications, and services, Rostow would interpret this as movement from preconditions for takeoff through takeoff toward maturity.
Misconception check — “Rostow is a prediction.” Rostow’s model is a model, not a guarantee. Countries may skip, repeat, combine, or resist stages; war, colonial history, environmental constraints, political choices, and unequal trade can alter the sequence. Its strength is organizing broad patterns of industrial change. Its weakness is assuming that every country should follow the same path taken by early industrializing Western states.
Wallerstein’s World System Theory
Wallerstein’s World System Theory explains development through a single global economic system divided into core, semiperiphery, and periphery regions. Core countries generally control advanced technology, finance, high-value production, and powerful institutions. Periphery countries often supply labor, agricultural products, fuels, or minerals. Semiperiphery countries occupy an intermediate position and may combine both core-like and peripheral economic activities.
The model is relational: a country’s position depends partly on how it interacts with other countries. A peripheral country may export inexpensive coffee beans while a core country processes, brands, transports, and sells the finished product at a much higher value. The unequal distribution of profit helps explain why economic growth in one place can coexist with limited development in another.
Dependency theory and commodity dependence
Dependency theory argues that poverty is not simply an earlier stage on a shared ladder. Instead, poorer countries may be structurally dependent on wealthier countries for investment, technology, markets, loans, or manufactured goods. Colonial extraction, unequal trade relationships, and debt can reinforce this dependence.
Commodity dependence occurs when a country relies heavily on exporting one or a few primary commodities, such as copper, oil, cocoa, or coffee. Primary commodities are vulnerable because their prices can fluctuate, they often receive less value than processed goods, and production may be controlled by foreign firms or affected by weather and political instability.
Worked comparison: Suppose Country B earns most of its export revenue from copper. When copper prices rise, government revenue and employment increase. When prices fall, the country may face budget cuts, currency instability, and difficulty repaying loans. Rostow might ask whether Country B is industrializing; Wallerstein would examine its peripheral position; dependency theory would investigate who controls mining, finance, and markets; commodity-dependence analysis would identify the danger of relying on copper.
Skill focus: 1.E Explain the strengths, weaknesses, and limitations of geographic models
Topic 7.5 is assessed especially through Skill 1.E Explain the strengths, weaknesses, and limitations of geographic models. A strong response does more than name a theory: it applies the theory to a place, identifies what the theory explains well, and states what it leaves out.
For example, Rostow is useful for identifying industrialization patterns, but it is limited by its linear, Western-centered sequence. World System Theory is useful for revealing global inequality and economic relationships, but its broad categories may hide differences within countries. Dependency theory highlights historical power relationships, while commodity dependence clarifies export vulnerability; neither alone explains every domestic political or geographic factor.
Retrieval check: A country exports raw petroleum, imports expensive manufactured products, and experiences severe budget problems when oil prices fall. Which theory most directly identifies its export vulnerability, and which theory would most directly analyze its position in the global economic system?
Answer: Commodity dependence most directly identifies the vulnerability created by reliance on petroleum. Wallerstein’s World System Theory would most directly analyze whether the country occupies a peripheral, semiperipheral, or core position in the global system.
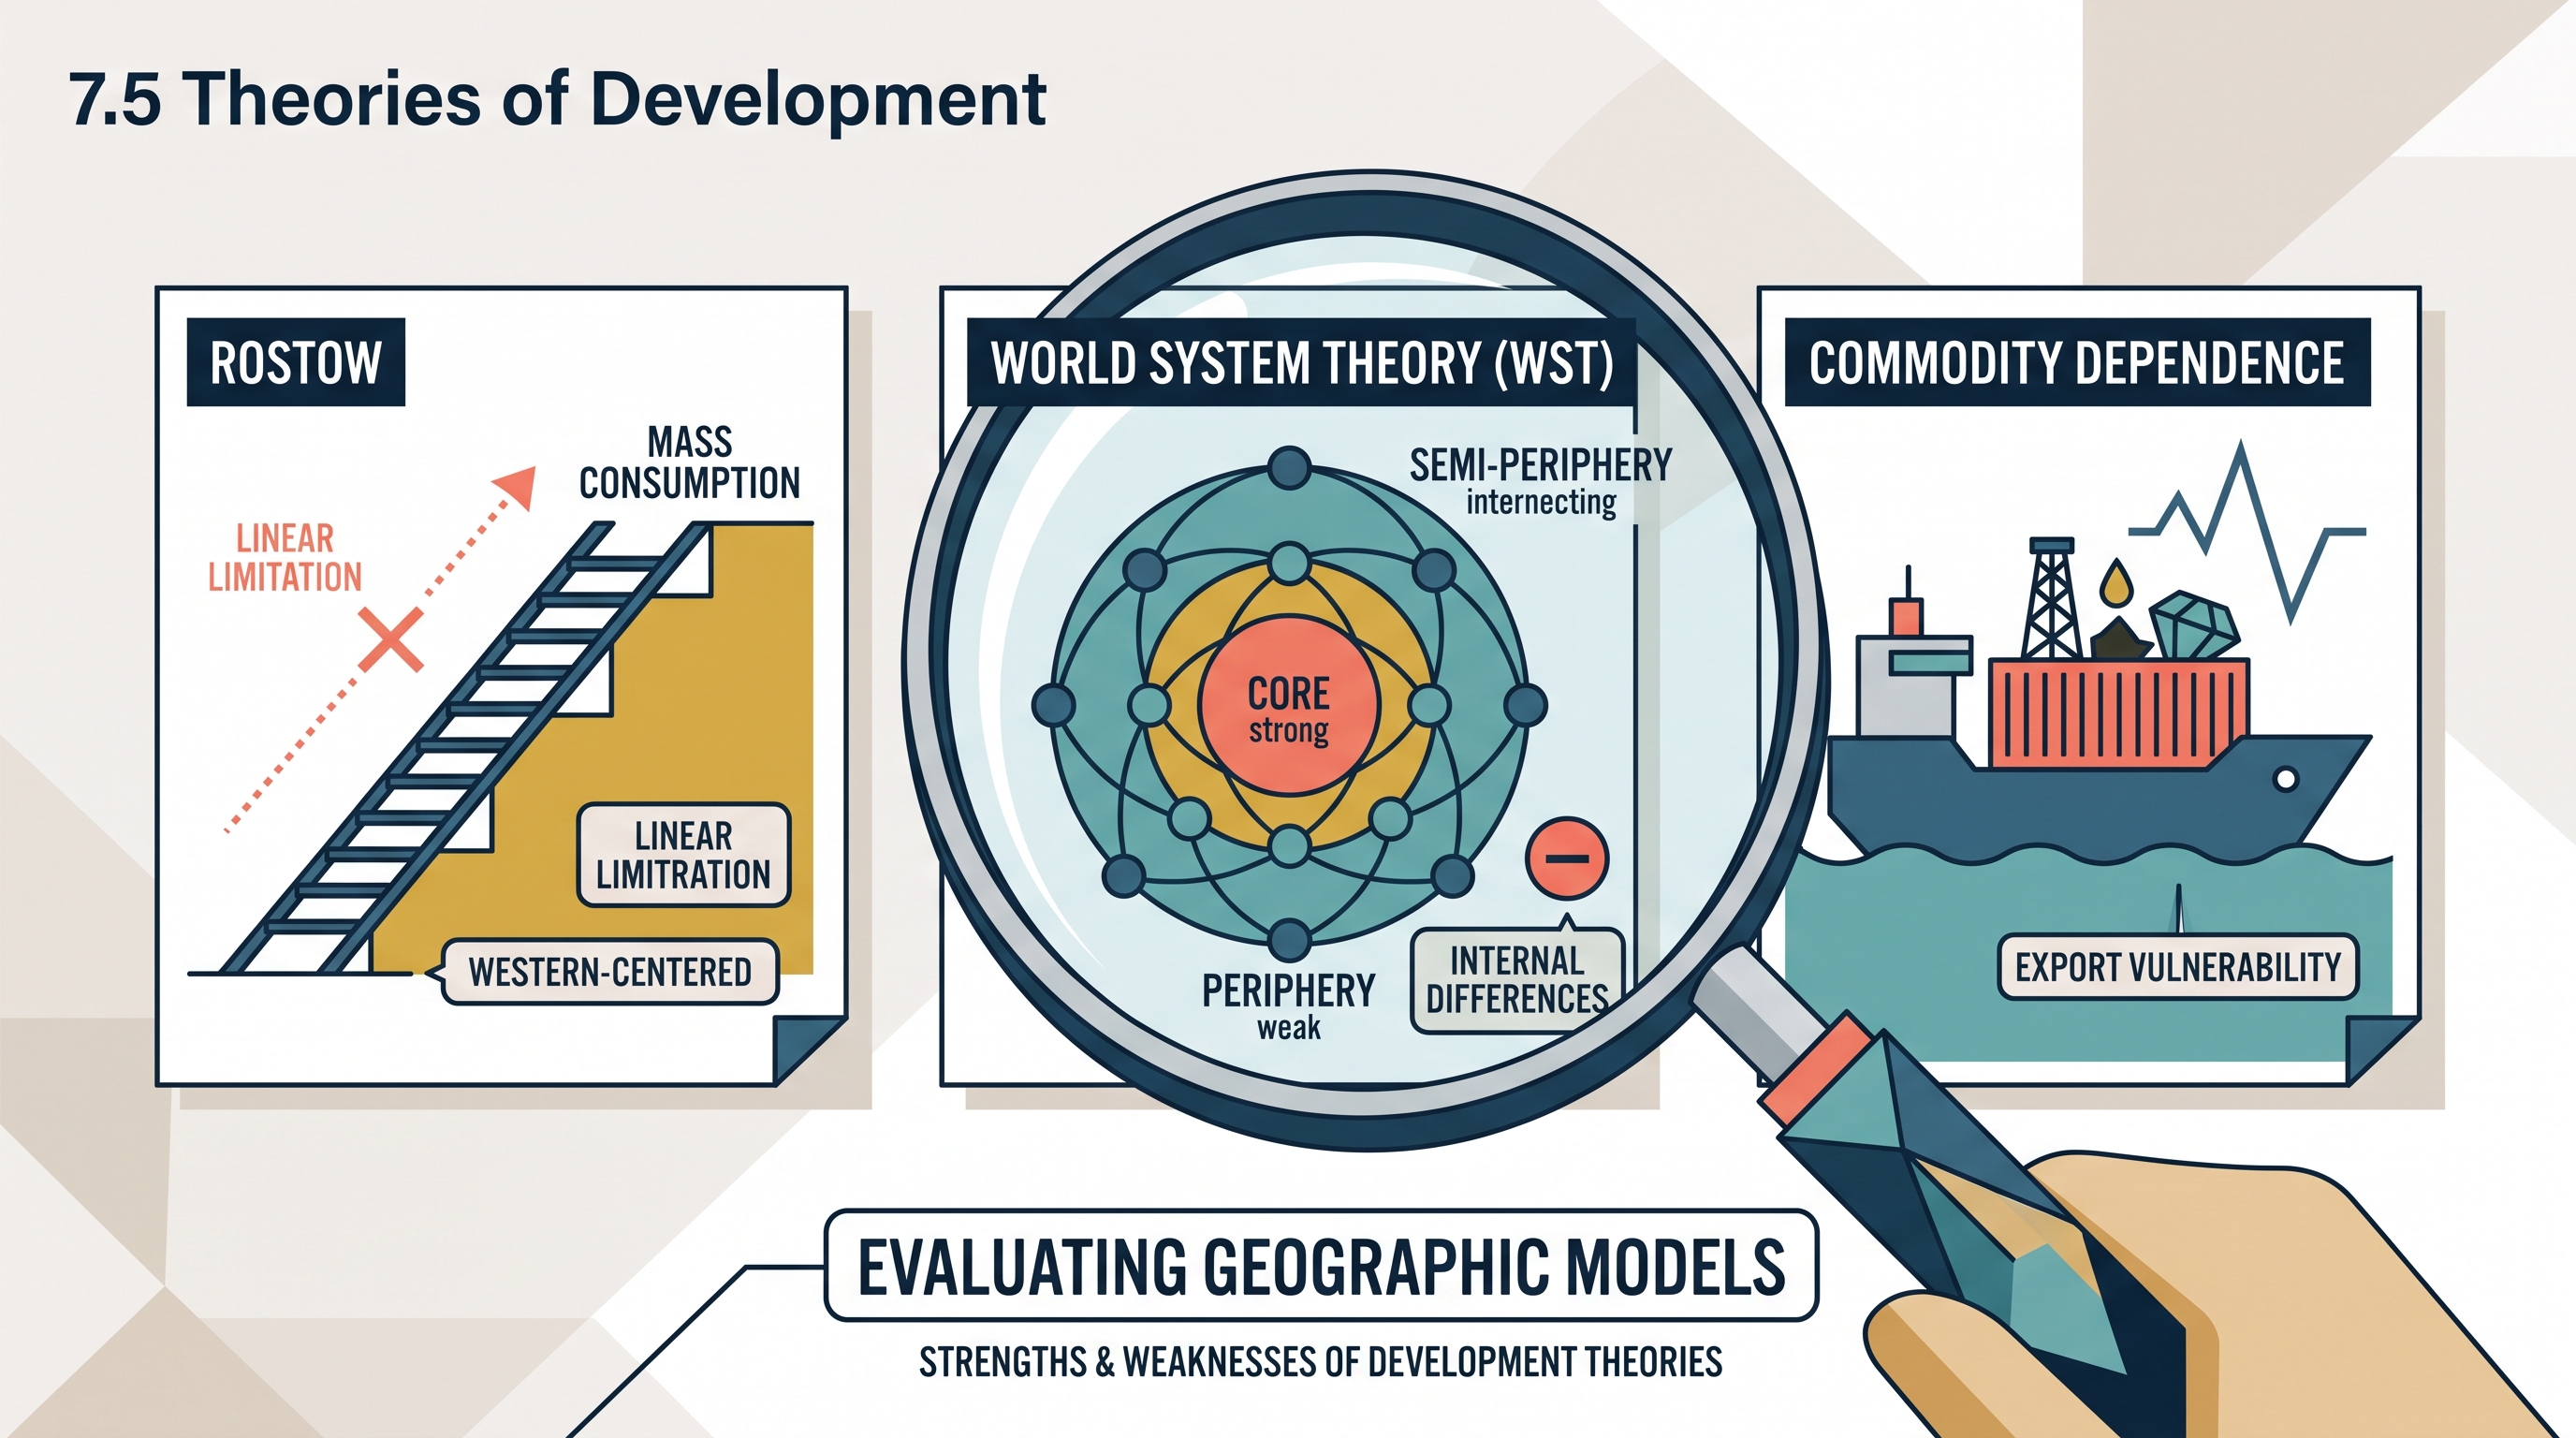
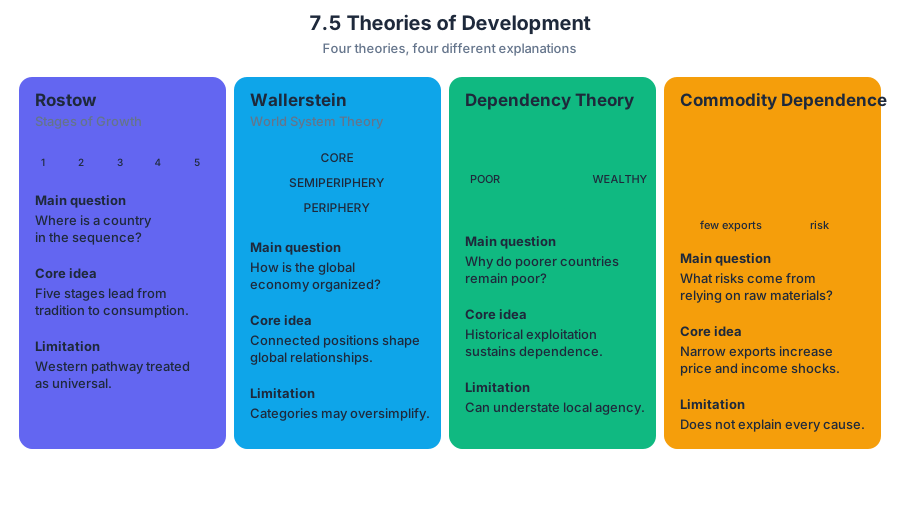
7.6 Trade and the World Economy
Key concepts: Neoliberal policies · Free trade agreements · International trade organizations · Spatial connections and trade relationships · Economic interdependence · Deindustrialization · Complementarity · Comparative advantage · Trade agreements and national sovereignty · Free-trade, special economic, and export-processing zones
A soybean shipment from Paraguay can feed Argentina’s food system, support Paraguayan farmers, and connect both economies to global prices and trade rules. International trade is the exchange of goods and services across places; it grows when economies have different resources, skills, technologies, or production…
7.6 Trade and the World Economy
A soybean shipment from Paraguay can feed Argentina’s food system, support Paraguayan farmers, and connect both economies to global prices and trade rules. International trade is the exchange of goods and services across places; it grows when economies have different resources, skills, technologies, or production costs.
PSO-7.A.1 — Complementarity and comparative advantage establish the basis for trade. Complementarity exists when places have different supplies or needs, so each can provide something the other wants. Comparative advantage means specializing in the activity a place can perform at a lower opportunity cost relative to other activities.
Why trade happens
Imagine two neighboring economies. Economy A has fertile land and efficient soybean farms, while Economy B has limited farmland but advanced food-processing facilities. Even if B could grow some soybeans, both places may gain when A specializes in soybeans and B specializes in processing, then exchanges the products. Their differences create complementarity; their relative production costs create comparative advantage.
In 2021, Argentina imported $2.34 billion in soybeans from Paraguay, and 95% of Argentina’s total soybean imports came from Paraguay. The relationship illustrates more than a simple flow of goods: Paraguay’s agricultural production complements Argentina’s demand, while transportation networks, prices, contracts, and trade policies connect the two places spatially.
Neoliberal policies and trade organizations
Neoliberal policies generally favor reduced government barriers to economic exchange, including lower tariffs, fewer restrictions on imports and exports, privatization, and expanded participation in global markets. Free trade agreements are formal arrangements in which participating states reduce trade barriers and establish shared rules.
PSO-7.A.2 — Neoliberal policies, including free trade agreements, have created new organizations, spatial connections, and trade relationships, such as the EU, World Trade Organization (WTO), Mercosur, and OPEC, that foster greater globalization.
These organizations do not all perform the same function. The European Union (EU) is a regional political and economic bloc whose members coordinate many policies and facilitate trade. The World Trade Organization (WTO) provides a global framework for trade rules and dispute settlement. Mercosur is a South American regional trade bloc that links member economies. OPEC, by contrast, is primarily an organization of oil-producing countries that coordinates petroleum policy; it should not be treated as equivalent to a general free-trade organization.
Trade agreements can reduce tariffs, standardize regulations, protect investment, and create procedures for resolving disputes. They can also align states that share economic interests, geographic proximity, or exposure to the same transnational problems. However, cooperation may challenge sovereignty when a member state must change domestic laws, open borders to trade, or follow jointly negotiated rules.
Interdependence across scales
Economic interdependence is mutual dependence among economies created by trade, investment, supply chains, financial systems, and shared policies. A country may rely on another for raw materials, components, energy, markets, loans, or transportation services.
A disruption in one economy can therefore travel through the network:
$$ \text{factory shutdown} \rightarrow \text{fewer exports} \rightarrow \text{input shortage} \rightarrow \text{higher prices} \rightarrow \text{job and consumption changes} $$
For example, if a major soybean supplier experiences drought, importing firms may pay more, food processors may face higher costs, consumers may encounter rising prices, and workers in connected industries may experience changing employment. The same process can operate in reverse: a tariff, financial crisis, or policy change can alter production and consumption far beyond the government that adopted it.
PSO-7.A.3 — Government initiatives at all scales may affect economic development, including tariffs. A tariff is a tax placed on an imported good. It may protect domestic producers, but it can also raise consumer prices, reduce imports, provoke retaliation, and reshape trade relationships.
Global financial institutions add another layer of connection. Debt crises, international lending agencies such as the International Monetary Fund (IMF), and development strategies such as microlending demonstrate how economies can become closely connected—even interdependent—through credit and financial policy (PSO-7.A.4).
Trade’s uneven consequences
Free trade can expand markets, lower prices, and create economies of scale, in which producing at a larger volume lowers the average cost per unit. It can also encourage investment in new manufacturing zones, free-trade zones, special economic zones, and export-processing zones, where governments often offer tax advantages, simplified regulations, or improved infrastructure to attract globally oriented firms.
At the same time, international trade can change the economic sectors of national economies. Deindustrialization is the decline of manufacturing employment or output in a place, often associated with automation, international competition, relocation of factories, or a shift toward service-sector work. A country may gain export revenue overall while particular industrial regions lose factories, wages, and population.
Named misconception check — “Free trade benefits every place equally.” Trade can produce national or global growth while distributing gains and losses unevenly. Exporting regions, consumers, investors, and highly skilled workers may benefit, while import-competing industries and former manufacturing communities experience job loss or economic decline.
Skill in action: Scale Analysis (5.B)
5.B — Scale Analysis: “Explain spatial relationships across various geographic scales using geographic concepts, processes, models, or theories.” Apply it by tracing one trade relationship from the local soybean farm, to national agricultural policy, to regional organizations such as Mercosur, and finally to global markets and financial rules. A strong explanation connects the scales rather than merely naming them.
Retrieval check: Argentina receives most of its imported soybeans from Paraguay. Identify the geographic concept that explains why the two economies trade, then name one way a tariff or supply disruption could affect consumers and producers in both countries.
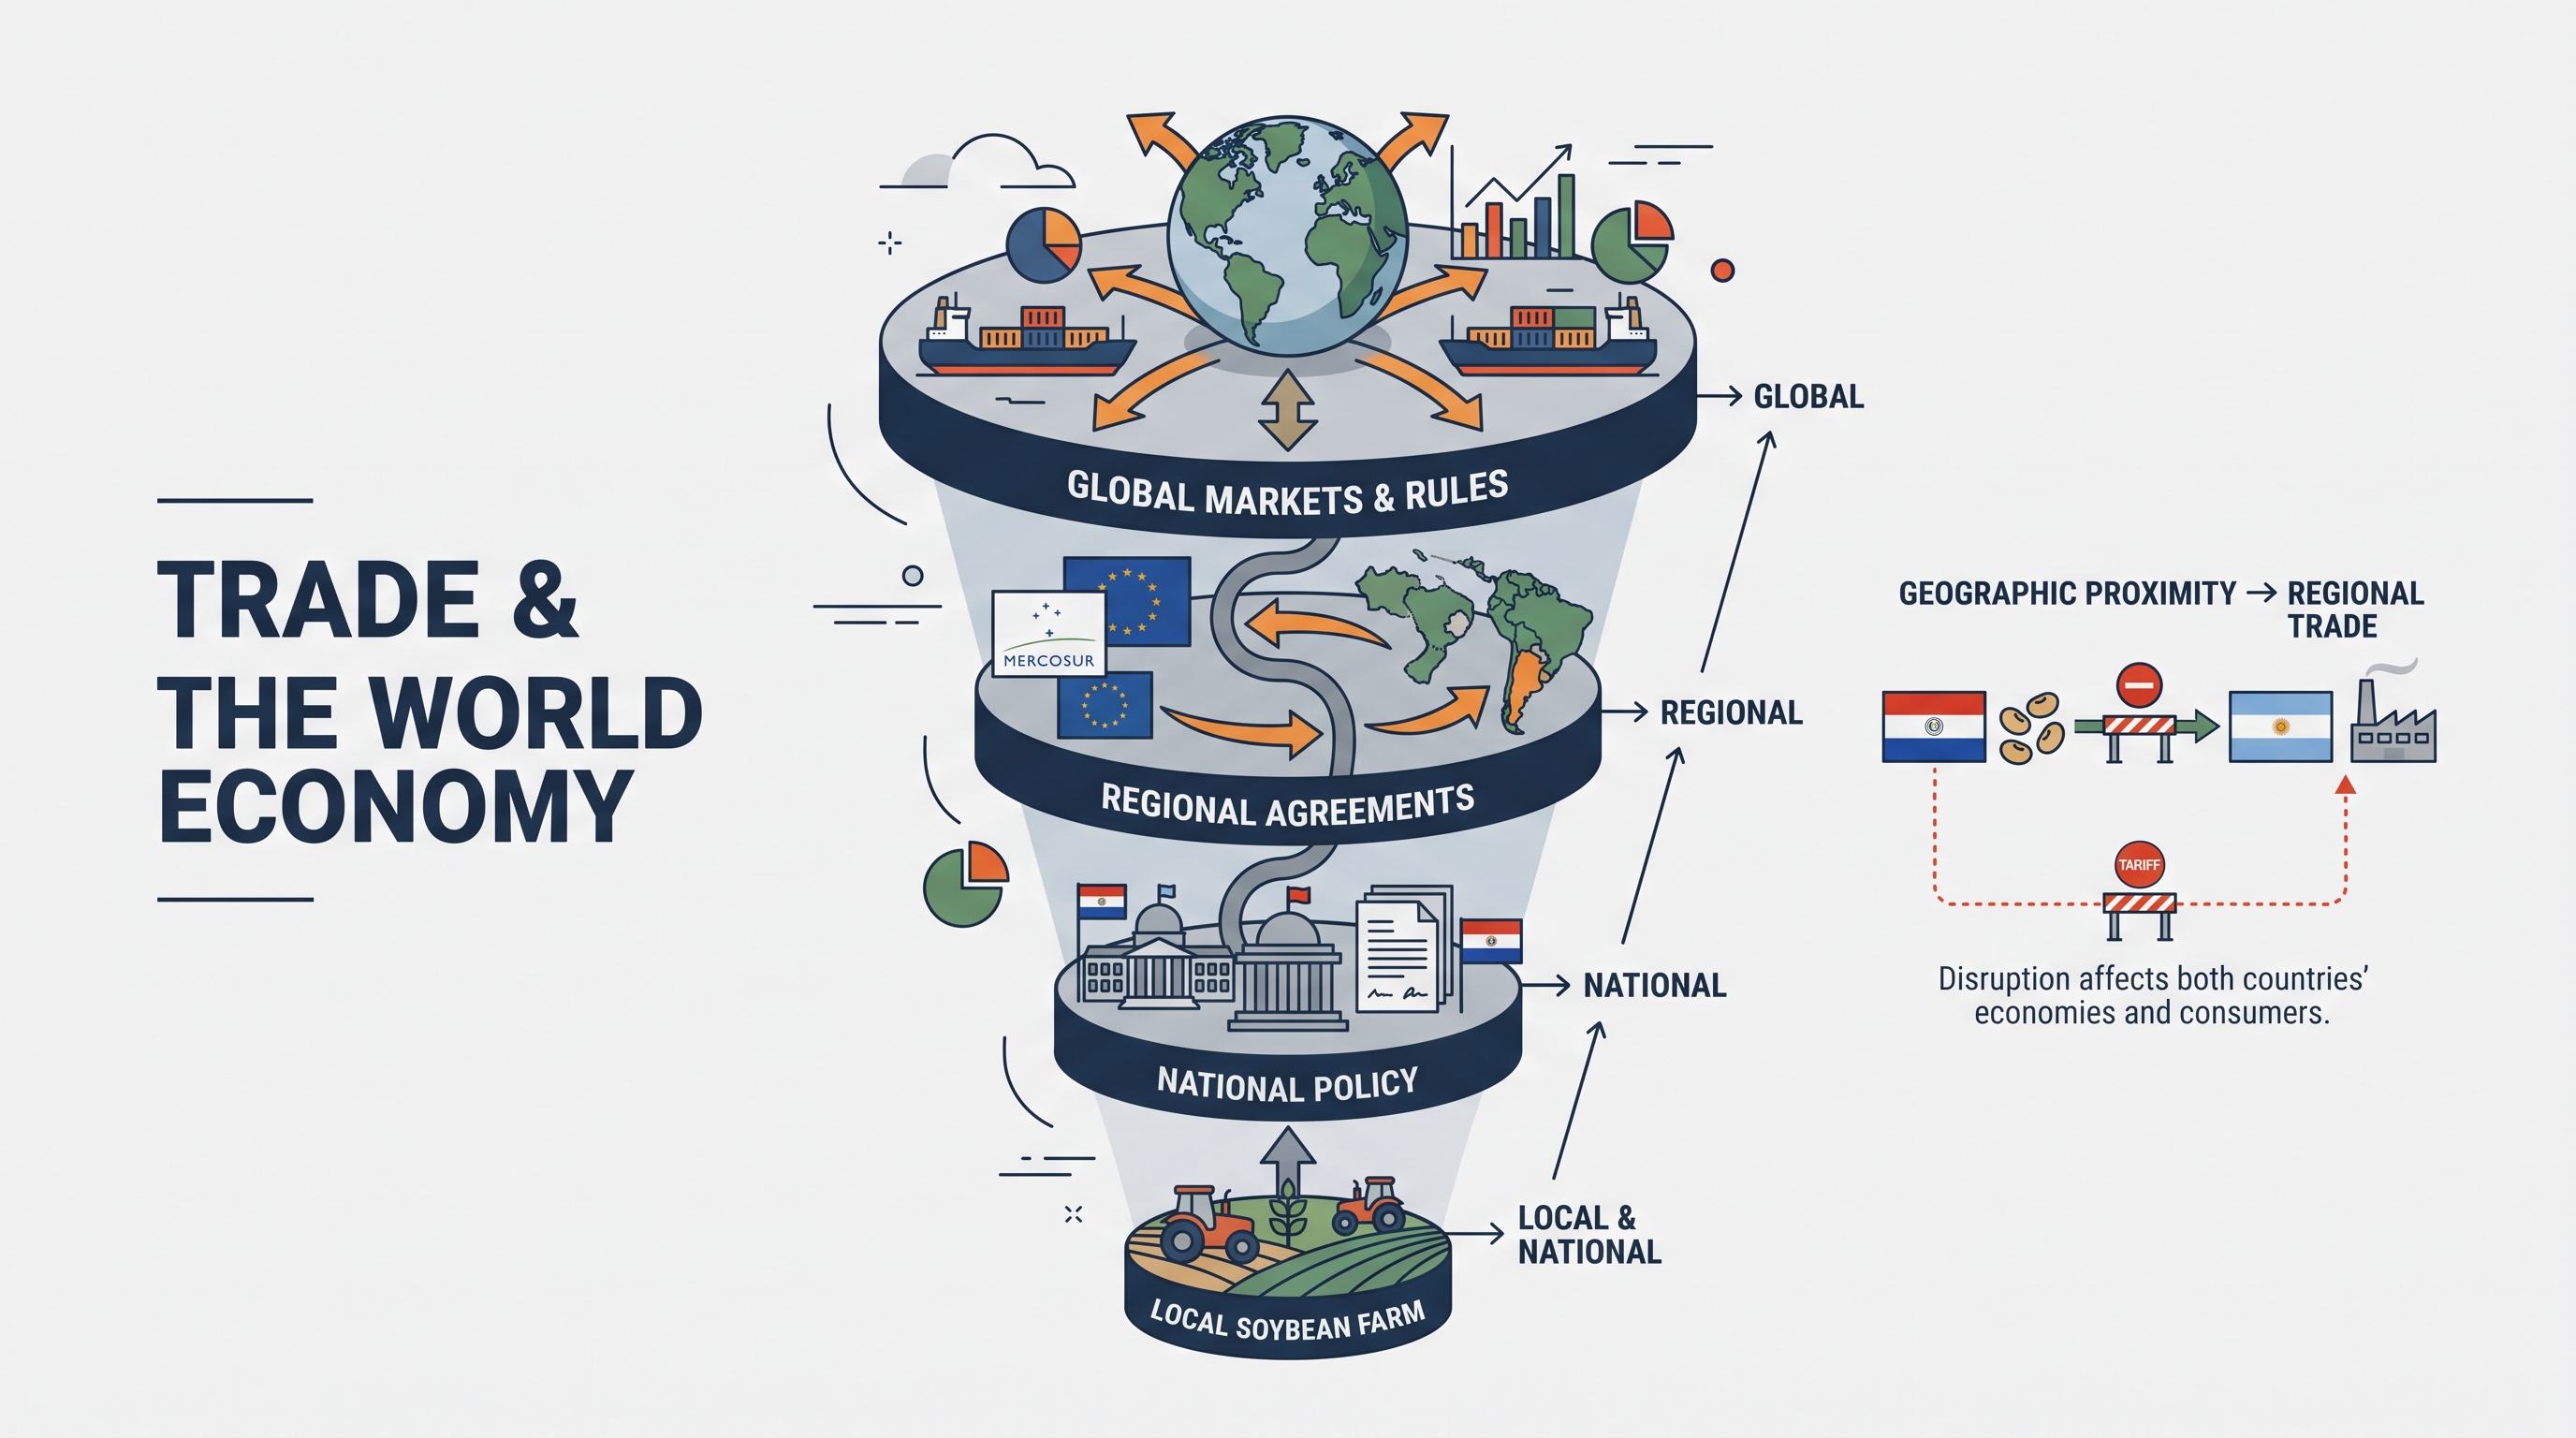
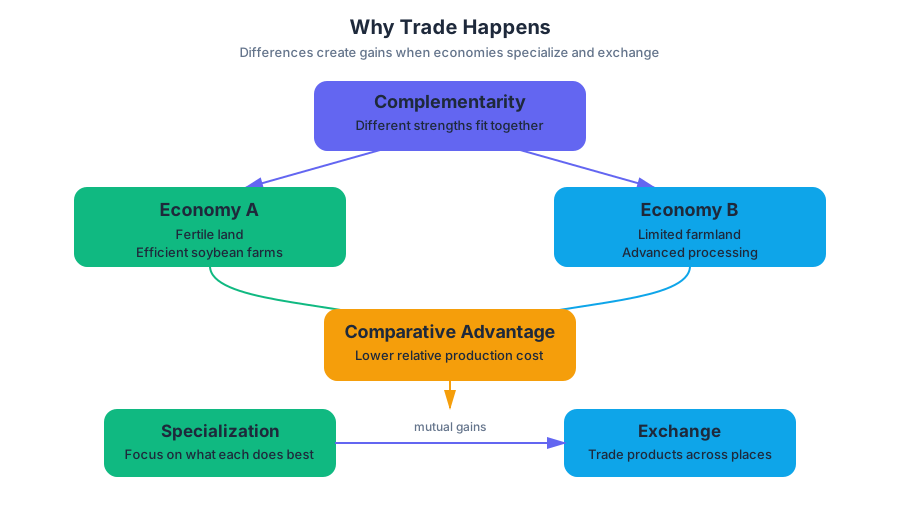
7.7 Changes as a Result of the World Economy
Key concepts: Outsourcing · Global economic interdependency · Free-trade zones · Special economic zones (SEZs) · Export-processing zones (EPZs) · Post-Fordist methods of production · Just-in-time delivery · Agglomeration and economies of scale · Deindustrialization · Supranational organizations and international trade
A smartphone may be designed in one country, assembled in another, and depend on minerals, chips, software, shipping, finance, and customers spread across dozens of countries.
7.7 Changes as a Result of the World Economy
A smartphone may be designed in one country, assembled in another, and depend on minerals, chips, software, shipping, finance, and customers spread across dozens of countries. Global economic interdependency is this mutual dependence among places through trade, production, finance, and supply chains. It makes production more flexible and geographically dispersed—but also means that a disruption in one place can affect employment and consumption far away.
Learning Objective PSO-7.A: Explain the causes and geographic consequences of recent economic changes, including increased international trade, outsourcing, deindustrialization, and growing interdependence in the world economy. The central required knowledge is PSO-7.A.5, PSO-7.A.6, and PSO-7.A.7.
From concentrated factories to global production networks
Outsourcing is the practice of contracting work to an outside company, often in another country. Firms outsource when a specialized supplier can perform a task more cheaply, quickly, or efficiently. This redistributes production and employment: headquarters, research, and advanced management may remain in a core region, while assembly, customer support, textiles, or routine data processing move to lower-cost locations.
Worked example — a clothing supply chain: A company based in a high-income country keeps design and marketing jobs at home, contracts fabric production to one country, garment assembly to an export-processing zone (EPZ) in another, and shipping to an international logistics firm. The core region may lose factory employment through deindustrialization, while the receiving country gains manufacturing jobs—often lower-paying positions in an international division of labor. The company’s profits, workers’ wages, government tax policies, and transportation systems connect all four places.
PSO-7.A.5: Outsourcing and economic restructuring have contributed to declining jobs in core regions and increasing employment in newly industrialized countries. PSO-7.A.6: Outside core regions, industrial growth has produced new manufacturing zones—including special economic zones (SEZs), free-trade zones, and EPZs—and a global division of labor in which developing countries often receive lower-paying jobs.
Zones that attract investment
A free-trade zone is an area where governments reduce or remove tariffs and other trade barriers on goods entering, leaving, or passing through the zone. An SEZ is a geographically defined area offering special rules—such as tax incentives, simplified regulations, improved infrastructure, or relaxed customs procedures—to attract foreign and domestic investment. An EPZ is an SEZ focused especially on export-oriented manufacturing, where imported inputs can be assembled and re-exported.
These zones can create jobs, roads, ports, factories, and supplier networks. They can also produce uneven development: investment may concentrate around one coastal industrial corridor while rural regions remain poorer, and workers may receive low wages or limited labor protections. A zone is therefore not automatically evidence that an entire country has developed equally.
Post-Fordist production and the new economic map
Fordist production used large factories, standardized products, and long production runs. Post-Fordist production is more flexible: firms use smaller production batches, rapid product changes, subcontracting, advanced technology, and globally distributed suppliers. Just-in-time delivery minimizes inventory by arranging for components to arrive shortly before they are needed.
Post-Fordist firms choose locations based not only on raw materials but also on reliable ports, digital networks, skilled labor, specialized suppliers, political stability, and access to markets. High-technology industries often cluster near research universities and skilled labor pools, while service-sector growth expands finance, information, health care, logistics, design, and communications in major metropolitan areas.
The spatial effects can reinforce one another. Agglomeration occurs when related firms and workers cluster together because proximity lowers costs and improves access to suppliers, labor, information, and infrastructure. Economies of scale occur when producing at a larger volume lowers the average cost per unit. A new factory can generate a multiplier effect by creating additional jobs in transportation, housing, retail, and services; a concentrated area of investment becomes a growth pole that attracts still more activity.
Interdependence, institutions, and uneven development
Global economic interdependency links places through several channels:
- Production: components cross borders before a final product is sold.
- Finance: loans, investment, currency exchange, and debt connect national economies.
- Supply chains: firms depend on transport routes, energy, software, suppliers, and labor in multiple regions.
- Rules: trade agreements and international institutions shape where firms invest and which markets they can enter.
Supranational organizations help states coordinate these connections. The European Union (EU) integrates member economies through shared institutions and reduced barriers; Mercosur promotes economic cooperation and trade in parts of South America; ASEAN encourages regional cooperation in Southeast Asia; OPEC coordinates petroleum policies among member countries; and the World Trade Organization (WTO) establishes and administers rules for international trade. The International Monetary Fund (IMF) provides financial assistance and policy support to countries facing serious balance-of-payments or monetary problems.
Free-trade rules can make an SEZ more attractive by lowering the cost of importing components and exporting finished goods. International lending can finance ports, roads, electricity, or telecommunications that make outsourcing possible, but loan conditions and repayment pressures may also reshape government priorities and deepen dependence on export industries. Thus, international finance can promote development while distributing its benefits unevenly.
Key insight: Economic globalization does not make every place economically similar. It reorganizes relationships among places, often connecting high-value research and management in core regions to lower-cost manufacturing and resource extraction elsewhere.
Misconception check and retrieval
Named misconception — “Outsourcing means all economic activity leaves the core.” Outsourcing usually relocates selected tasks, not every function. Core regions may lose routine manufacturing jobs while gaining high-value service, finance, design, and technology employment; receiving regions may gain jobs and infrastructure but remain dependent on lower-wage production.
Retrieval check: A government offers tax breaks, streamlined customs procedures, and a new port to attract foreign electronics manufacturers. Identify the most likely zone type, explain one reason firms would locate there, and describe one possible effect on the host region. A strong response identifies an SEZ—possibly an EPZ if export manufacturing is its defining purpose—then connects the incentives and infrastructure to investment, employment, agglomeration, or uneven development.
Skill connection — 4.F, “Explain how maps, images and landscapes illustrate or relate to” geographic concepts, processes, and patterns: When examining a map of factory locations, ports, or technology clusters, connect the visible pattern to outsourcing, agglomeration, growth poles, or deindustrialization. Do not merely describe where activity appears; explain why that spatial arrangement exists and what consequences it produces at local, national, and global scales.
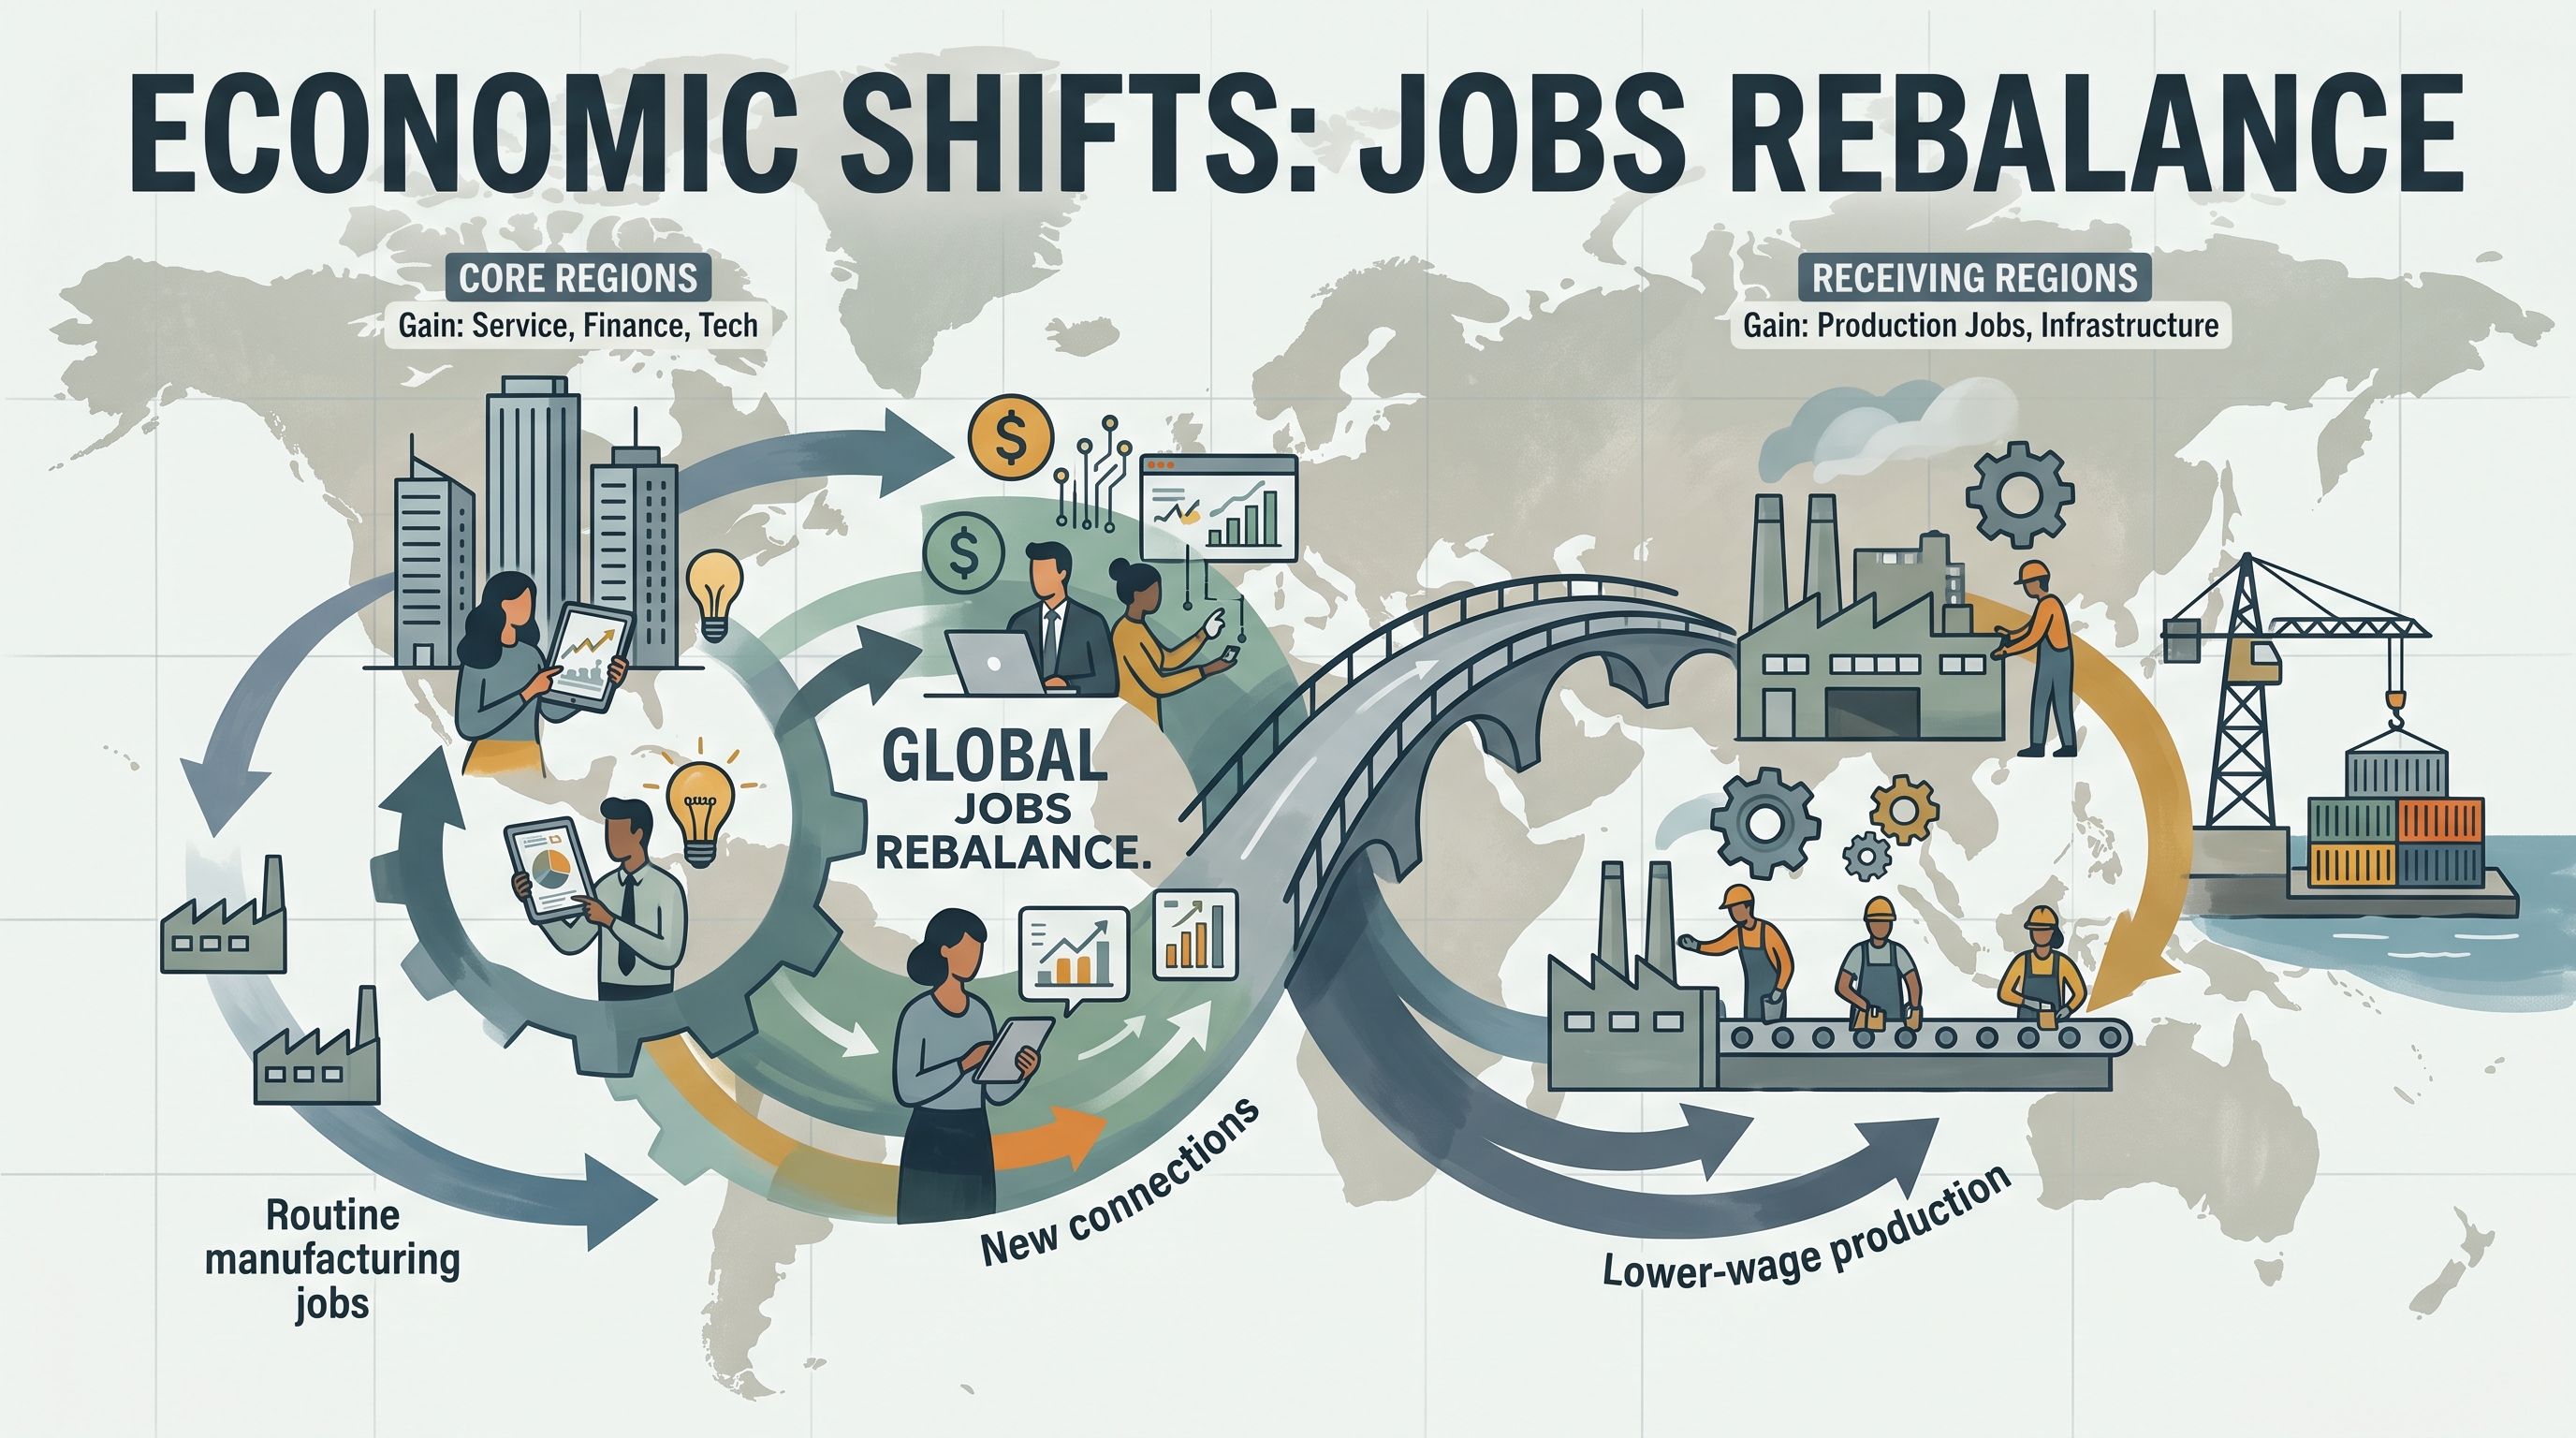
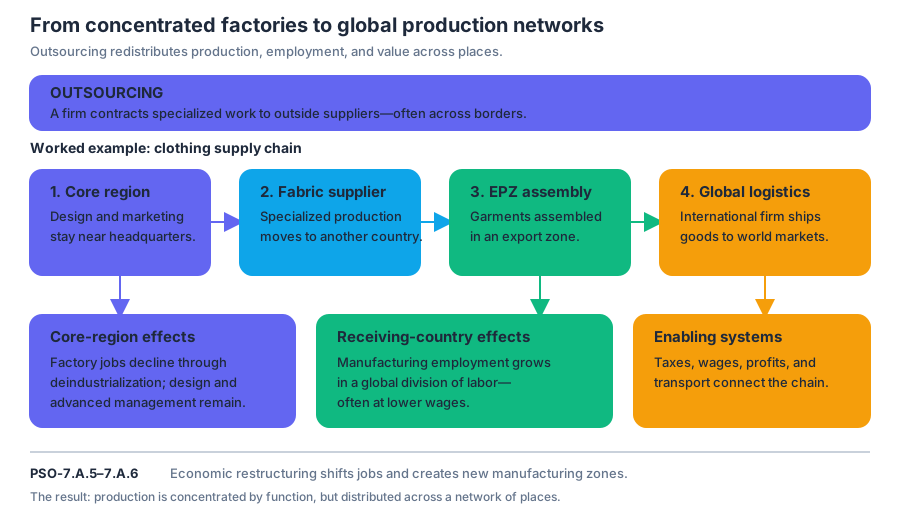
7.8 Sustainable Development
Key concepts: Sustainable development · Resource depletion · Mass consumption · Effects of pollution · Impact of climate change · Poverty reduction programs and policies · Remittances, microloans, and social safety nets · Job creation and increased employment · Environmental protection measures · Human Development Index (HDI) comparison between Brazil and Afghanistan
Sustainable development means improving human well-being without using resources or damaging environments in ways that undermine future generations. It responds to four connected pressures: resource depletion, mass consumption, pollution, and the effects of climate change.
7.8 Sustainable Development
Sustainable development means improving human well-being without using resources or damaging environments in ways that undermine future generations. It responds to four connected pressures: resource depletion, mass consumption, pollution, and the effects of climate change.
Imagine a community drawing water from the same underground aquifer for drinking, farming, and industry. If withdrawals exceed natural replenishment, short-term economic production may rise, but the community becomes less secure over time. A sustainable policy must therefore connect economic improvement with environmental protection rather than treating them as separate goals.
The four pressures sustainability addresses
| Challenge | What is happening | Why it creates a development problem |
|---|---|---|
| Resource depletion | Water, soil, forests, minerals, or energy sources are consumed faster than they can be replaced | Future production and human health become less secure |
| Mass consumption | Large quantities of goods and energy are produced and used | Waste, extraction, and emissions increase |
| Pollution | Harmful substances enter air, water, or soil | Health declines and ecosystems lose productivity |
| Climate change | Human activities contribute to long-term changes in climate conditions | Agriculture, infrastructure, settlements, and livelihoods face greater risk |
These pressures interact. For example, mass consumption can increase fossil-fuel use, which contributes to pollution and climate change. Climate change can then intensify water shortages or reduce agricultural productivity, making poverty reduction more difficult.
Sustainability and economic challenges
Sustainability goals can address economic challenges through poverty-reduction programs and policies. Examples include improving access to remittances, providing microloans, and creating social safety nets.
- Remittances are money transfers sent by migrants to people or communities in their places of origin. More reliable access to these funds can help households pay for food, education, health care, or small businesses.
- Microloans are small loans that can allow people with limited access to conventional banking to start or expand an income-generating activity.
- Social safety nets are public or community programs that protect people from severe economic hardship, such as assistance with food, income, or essential services.
- Increasing jobs addresses economic challenges directly by expanding access to income and reducing dependence on unstable or informal work.
These measures are associated with Sustainable Development Goals 1, 8, and 16: reducing poverty, supporting decent work and economic opportunity, and strengthening peaceful, inclusive institutions. The geographic insight is that poverty is not reduced only by increasing national income; policies must also improve people’s access to money, employment, security, and institutions.
Sustainability and environmental quality
Sustainability goals can improve environmental quality through environmental protection measures, including protecting habitats, increasing biodiversity, and reducing pollution. A cleaner environment can also improve the health of the labor force: fewer pollutants and safer water can reduce illness, allowing people to work and participate more fully in the economy.
Ecotourism illustrates the possible connection between environmental protection and economic activity. Ecotourism is tourism based in natural environments, often places threatened by industrialization or development. When carefully managed, it can create income while giving communities an economic reason to protect the environment that attracts visitors.
Key insight: Sustainability is not simply “protecting nature from people.” It seeks policies in which economic well-being and environmental quality reinforce each other.
Other sustainability strategies include investment in clean water, sanitation, hygiene, transportation, and electricity infrastructure. Shifting electricity generation from fossil fuels to solar and wind power can also create employment in the secondary and tertiary sectors, including construction, manufacturing, engineering, and related services.
Comparing development with HDI
The Human Development Index, or HDI, allows geographers to compare countries using a broader measure of development than income alone. Brazil has a higher HDI score than Afghanistan, indicating a higher overall level of human development according to the index.
| Comparison | Interpretation |
|---|---|
| Brazil’s higher HDI score | Brazil demonstrates a higher measured level of human development than Afghanistan |
| An additional HDI indicator | A second indicator can reinforce the comparison and demonstrate Brazil’s higher relative development |
| Geographic caution | A national average does not mean every person or region within Brazil has better conditions than every person or region within Afghanistan |
Misconception check — “A higher HDI means a country is sustainable.” Not necessarily. HDI measures human development, while sustainability asks whether improvements can continue without exhausting resources or degrading environmental systems. A country may have a relatively high HDI while still facing pollution, high consumption, resource depletion, or climate-related risks.
Retrieval check
A government wants to address both poverty and environmental decline. Identify one poverty-reduction policy and explain one way it could support sustainability. Then name one environmental protection measure and explain how it could also improve economic well-being.
A strong response might connect microloans to new small-business income and poverty reduction, then connect pollution reduction to better worker health and productivity. The explanation must show the causal link—not merely list a program or environmental action.
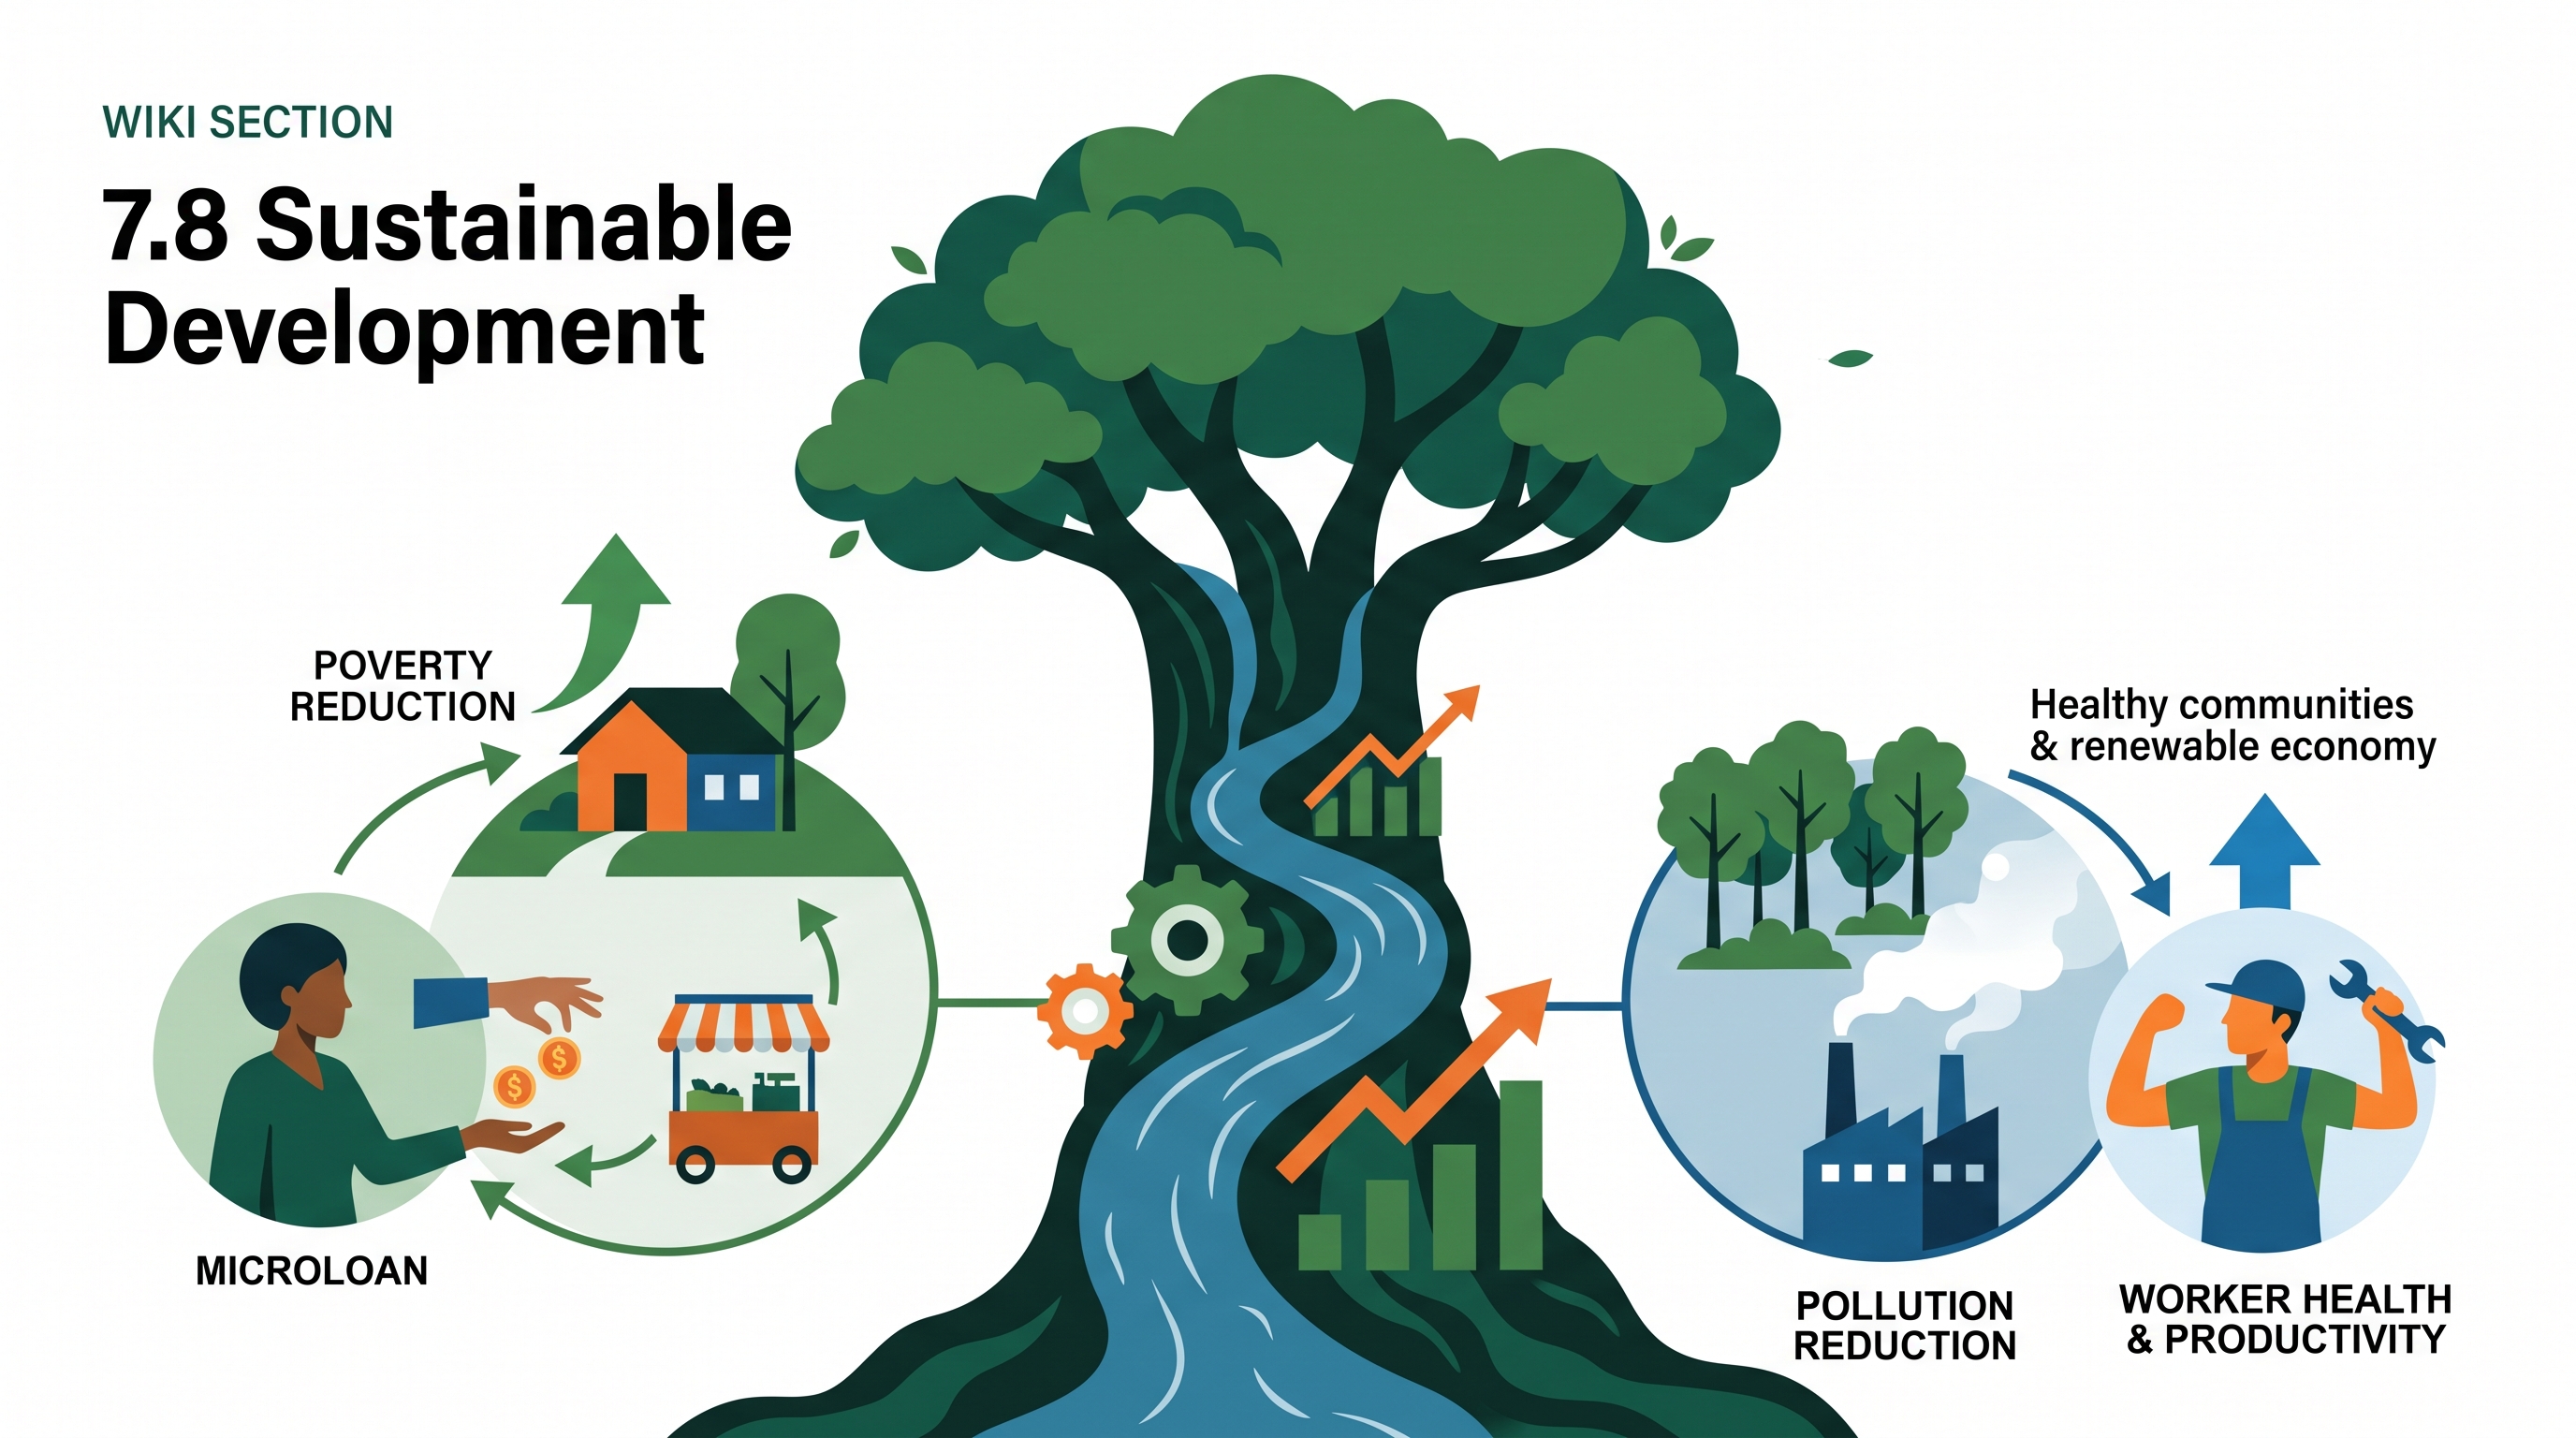
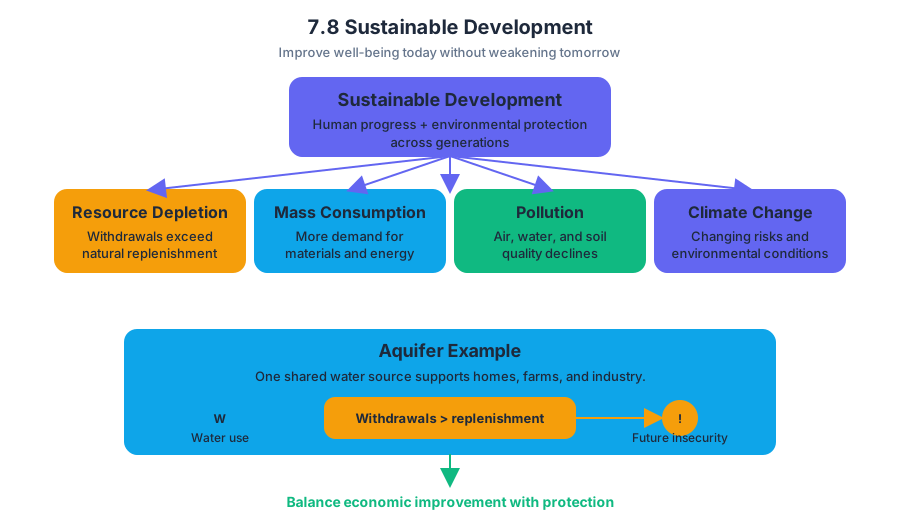
AP Practice 1
Key concepts: Centripetal forces · Centrifugal forces · Devolution · Multinational states · Autonomous regions · Unitary states · Uneven development · Urban infrastructure challenges · Population density · Absolute and relative distance
A state stays politically unified when forces pulling people together outweigh forces pulling them apart. Centripetal forces strengthen unity, while centrifugal forces weaken it; devolution occurs when power or authority shifts from a central government toward regional or local governments.
AP Practice 1
A state stays politically unified when forces pulling people together outweigh forces pulling them apart. Centripetal forces strengthen unity, while centrifugal forces weaken it; devolution occurs when power or authority shifts from a central government toward regional or local governments.
Core distinction: Centripetal forces bind a state together; centrifugal forces fragment it.
The political-geography toolkit
A multinational state contains two or more nations—groups with distinct cultural, ethnic, or historical identities—within one political territory. Such a state may experience devolution when a regional group seeks greater control over its own affairs, especially if it believes the central government ignores its identity, language, territory, or economic interests.
An autonomous region is a subnational area granted meaningful self-government while remaining inside the larger state. A unitary state, by contrast, concentrates governing authority primarily in the national government, even though it may delegate limited responsibilities to local administrations.
| Concept | Main effect | Political example |
|---|---|---|
| Centripetal force | Promotes unity | National symbols, shared holidays, political nationalism |
| Centrifugal force | Promotes division | Uneven regional development or ethnic separatism |
| Devolution | Transfers authority downward | Regional demands for self-government |
| Autonomous region | Accommodates regional difference | Limited or substantial self-rule |
| Unitary state | Preserves centralized authority | National government retains primary control |
| Multinational state | Contains several nations | A state with multiple strong regional identities |
How to earn explanation points
AP prompts distinguish among define, describe, and explain. A definition identifies a concept. A description states a relevant characteristic. An explanation connects a cause to an effect using geographic reasoning.
For example, “A government promotes a national flag” is a description of a centripetal force. A stronger explanation adds the mechanism: “A government promotes a national flag to create a shared political identity, encouraging people from different ethnic or regional groups to identify with the state as a nation.”
Original no-stimulus practice
Practice prompt — 7 points
A multinational state contains a wealthy coastal region and a poorer interior region. The coastal region has a distinct language and has begun demanding greater control over education, taxation, and cultural policy.
(A) Define the concept of a multinational state.
(B) Describe one centripetal force a government could use to promote the state as a nation.
(C) Explain how uneven development could act as a centrifugal force.
(D) Explain why the government might create an autonomous region rather than maintain a unitary state.
(E) Explain why the government might instead maintain a unitary state.
Worked reasoning
(A) Definition: A multinational state is a state containing two or more nations or culturally distinct national groups within its borders. The answer earns credit because it identifies multiple nations inside one political territory, not merely because it mentions ethnic diversity.
(B) Centripetal force: The government could promote shared national holidays, symbols, or patriotic traditions. These practices create a common political identity that may unite residents who otherwise identify primarily with different regions or ethnic groups.
(C) Uneven development: If the coastal region receives better infrastructure, higher-paying employment, and greater public investment than the interior, residents of the interior may view the state as unfair or exploitative. That resentment can strengthen regional identity and support demands to separate or gain control over local resources, making uneven development a centrifugal force.
(D) Autonomous region: The government might grant autonomy to reduce conflict by allowing the coastal region to control culturally sensitive policies such as language and education. This arrangement can address regional grievances while preserving the state’s territorial integrity.
(E) Unitary state: The government might maintain centralized authority to preserve consistent laws, taxation, infrastructure planning, and national security. Leaders may fear that regional autonomy would encourage additional regions to demand similar powers or eventually seek independence.
Examiner-rewarded logic: claim → geographic mechanism → political consequence.
Misconception check
Misconception: “Centripetal always means positive, and centrifugal always means negative.” These terms describe political effects, not moral judgments. Regional autonomy may reduce violence and stabilize a state, even though it responds to a centrifugal pressure. Likewise, a government’s centripetal nationalism can unite people but may marginalize minority identities.
Misconception: “A multinational state is automatically unstable.” Multiple national identities create potential centrifugal pressure, but governments can reduce that pressure through equitable development, inclusive national identity, or negotiated autonomy.
Timing and error review
For a multipart no-stimulus FRQ, reserve about $25$ minutes, including planning. Spend roughly $2$ minutes identifying the political process, then answer each part directly. Afterward, label each response as definition, description, or explanation and ask: Did I name a mechanism, or did I merely name an example?
Transfer check: Delhi’s high population density can produce inadequate sanitation, water supply, waste disposal, wastewater treatment, and housing—especially for lower-income residents. That is an urban-geography application; do not substitute it for a political explanation unless a prompt specifically asks about infrastructure or density.
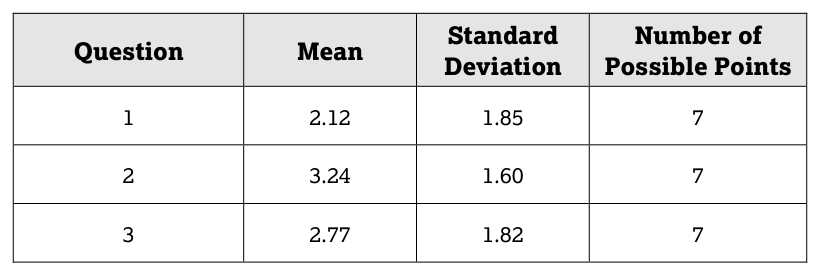


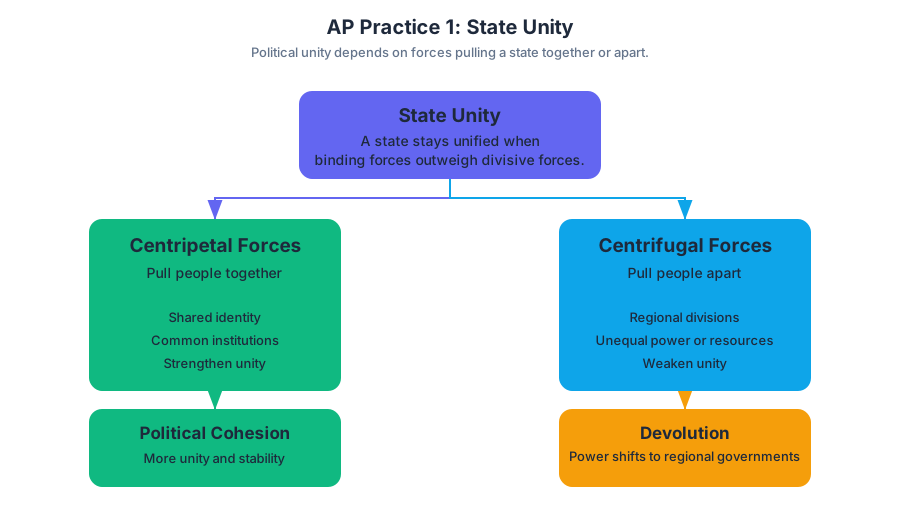
AP Practice 2
Key concepts: Cause-and-effect relationships among people, environments, and historical or contemporary actions · Comparing patterns and trends in maps, images, and landscapes · Infilling as a form of urban development · Population change through mortality, fertility, and migration · Environmental, economic, cultural, and political influences on population change · Connection between physical geography and agricultural practices · Enduring Understandings, Learning Objectives, and Essential Knowledge hierarchy · Evaluating the strengths, weaknesses, and limitations of geographic models and theories · Using written accounts and visual sources to analyze geographic patterns · Cyberattacks targeting networks operated by devolutionary groups and democracy movements
A city can grow without expanding outward: when vacant lots or underused parcels appear inside an established urban area, infilling occurs as landowners build small, often multifamily housing units within existing city blocks.
AP Practice 2
A city can grow without expanding outward: when vacant lots or underused parcels appear inside an established urban area, infilling occurs as landowners build small, often multifamily housing units within existing city blocks. The geographic challenge is to connect that visible pattern to causes, consequences, and evidence across scales.
Task type: Stimulus-based free-response question
Treat this as an original, unofficial AP-style free-response exercise. Allow 25 minutes total, including up to 5 minutes for planning. Write organized prose rather than an outline: identify the geographic evidence, explain the relationship, and use a specific example when requested.
Stimulus: Two neighborhoods, one city
A city compares two neighborhoods between 2012 and 2024.
| Measure | Neighborhood A: Inner-ring district | Neighborhood B: Outer fringe |
|---|---|---|
| Vacant parcels in 2012 | 42 | 18 |
| Vacant parcels in 2024 | 9 | 21 |
| Average distance to city center | $3$ km | $19$ km |
| New housing units, 2012–2024 | $1{,}180$ | $1{,}460$ |
| Share of new units that are multifamily | $82%$ | $24% |
| Average commute distance in 2024 | $8$ km | $27$ km |
A second map shows that Neighborhood A has frequent bus service, older water and sewer infrastructure, schools, and commercial streets. Neighborhood B has newer roads and utilities but fewer transit routes. A third image shows Neighborhood A changing from scattered vacant lots to continuous rows of small apartment buildings, while Neighborhood B changes from farmland to low-density detached housing.
Questions
(a) Describe the urban development pattern shown in Neighborhood A. [1 point]
(b) Explain one economic reason why infilling may occur in Neighborhood A. [1 point]
(c) Explain one way that population change can result from the interaction of mortality, fertility, and migration. [1 point]
(d) Explain how one environmental, economic, cultural, or political factor could influence migration into Neighborhood A. [1 point]
(e) Compare the population or land-use pattern in the two neighborhoods using evidence from the table or descriptions. [1 point]
(f) Explain how physical geography can influence agricultural practices, using PSO-5.A. [1 point]
(g) Explain one strength and one limitation of using a geographic model or theory to predict development in these neighborhoods, applying Suggested Skill 1.E: Explain the strengths, weaknesses, and limitations of geographic models and theories in a specified context. [1 point]
Worked reasoning and scoring logic
(a) Full-credit reasoning: Neighborhood A demonstrates infilling, because previously open or vacant spaces within an existing city are being developed into housing. The evidence is the decline from $42$ vacant parcels to $9$ and the image showing apartment buildings occupying scattered internal spaces.
(b) Full-credit reasoning: Landowners may view vacant parcels near transit, schools, utilities, and commercial streets as profitable opportunities. Building multifamily housing there can use existing infrastructure and reach many renters or buyers without purchasing distant farmland.
(c) Full-credit reasoning: Population change equals the combined effect of deaths, births, and migration. For example, if fertility remains high and more working-age migrants enter Neighborhood A than residents leave, the neighborhood can grow even if mortality is also increasing among older residents.
(d) Full-credit reasoning: An economic factor could be access to employment. Frequent bus service and a shorter average commute may attract migrants seeking jobs while reducing transportation costs. A political factor could also matter: a housing policy that permits apartments or offers redevelopment incentives may increase the neighborhood’s ability to receive new residents.
(e) Full-credit reasoning: Neighborhood A is denser and more compact than Neighborhood B. A has $82%$ multifamily construction and an $8$ km average commute, whereas B has only $24%$ multifamily construction and a $27$ km commute. This comparison describes both a land-use difference and a likely spatial relationship between compact development and shorter travel distances.
(f) Full-credit reasoning: Physical geography helps shape agricultural practices because climate, soil, slope, and water availability affect what can be grown and how land is used. For instance, fertile, level land with reliable water can support intensive crop cultivation, while steep terrain may encourage terracing or grazing. The physical environment creates conditions and constraints, but it does not determine a single human response.
(g) Full-credit reasoning: A model such as the concentric zone model is useful because it offers a simplified expectation that older, denser development will occur near the city center and newer, lower-density development farther outward. Its limitation is that real cities do not grow in perfect rings: transit corridors, zoning, land prices, environmental hazards, historic districts, and political decisions can produce irregular patterns. A strong response applies the model to this city and then identifies where the evidence does or does not fit.
The reasoning move examiners reward
Do not merely state that one neighborhood is “more urban” or that migration “changes population.” Ask: How and why does the pattern emerge? Compare the two maps or landscapes, identify a measurable difference, and connect that difference to a process. The strongest causal chain is:
$$ \text{existing infrastructure and central location} \rightarrow \text{economic opportunity} \rightarrow \text{infilling} \rightarrow \text{higher density and shorter average travel} $$
A common misconception is that all urban growth is sprawl. Sprawl expands development outward into previously rural or undeveloped land; infilling reuses open space inside an already developed area. Another misconception is that physical geography dictates agricultural behavior. PSO-5.A requires a connection between physical conditions and practices, not environmental determinism.
Error-review routine
After finishing, label each response D for description, C for comparison, or E for explanation. Revise every answer marked only D by adding a cause, consequence, or process. Then check that every comparison names evidence from both neighborhoods and that every model response includes both a useful prediction and a context-specific limitation.

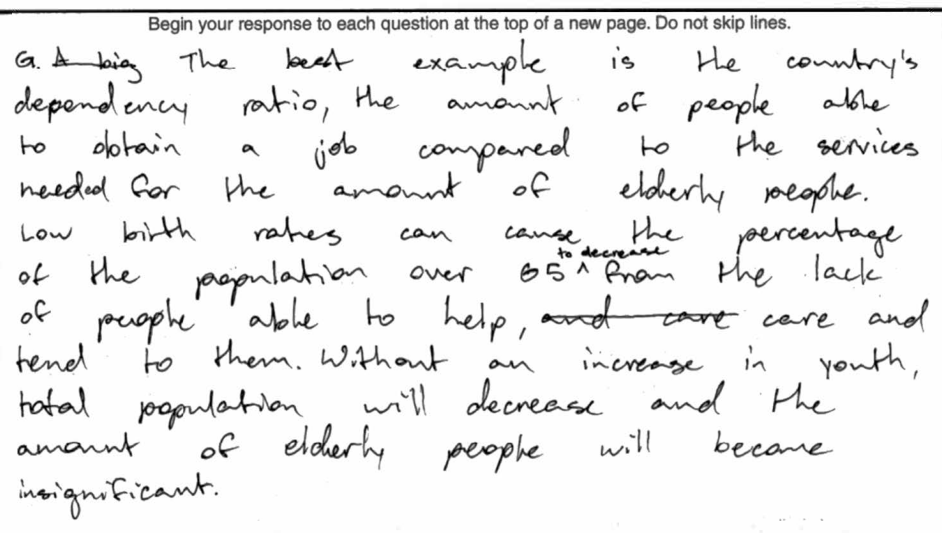
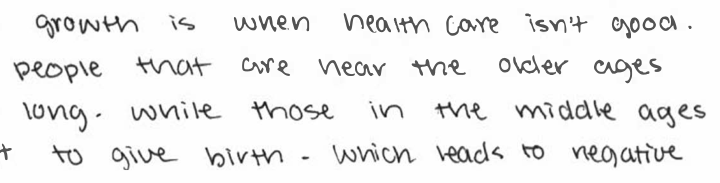

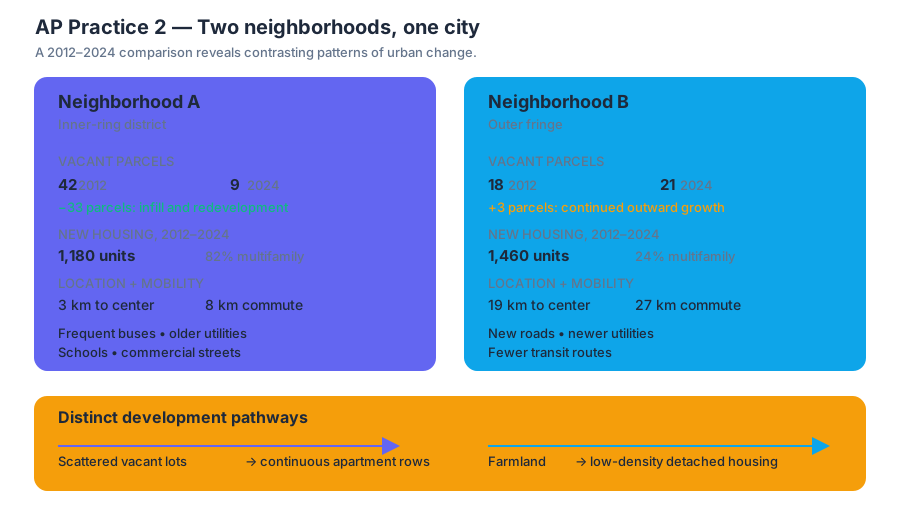
AP Practice 3
A free-response answer earns credit by making a defensible geographic claim and connecting it to evidence, not by repeating vocabulary. This original practice set uses a short stimulus and a multi-part response to rehearse the central AP Human Geography skills: Concepts and Processes, Spatial Relationships, Data…
AP Practice 3
A free-response answer earns credit by making a defensible geographic claim and connecting it to evidence, not by repeating vocabulary. This original practice set uses a short stimulus and a multi-part response to rehearse the central AP Human Geography skills: Concepts and Processes, Spatial Relationships, Data Analysis, Source Analysis, and Scale Analysis.
Task: Stimulus-based free-response question
Suggested timing: $25$ minutes. Spend about $4$ minutes reading the stimulus, $17$ minutes writing, and $4$ minutes checking that every part includes the requested evidence and explanation. The scenario combines the course big ideas of Patterns and Spatial Organization (PSO), Impacts and Interactions (IMP), and Spatial Process and Societal Change (SPS).
A rapidly growing coastal metropolitan region contains a dense central city, older industrial neighborhoods, suburban municipalities, and newly developing settlements along a highway corridor. Regional planners are considering a new commuter-rail line and are comparing population density, travel behavior, and access to employment.
| Zone | Population density in $2020$ (people per $km^2$) | Average commute time | Workers using public transportation |
|---|---|---|---|
| Central city | $8{,}400$ | $34$ minutes | $42%$ |
| Inner suburbs | $3{,}100$ | $39$ minutes | $18%$ |
| Outer suburbs | $1{,}250$ | $46$ minutes | $9%$ |
| Highway corridor | $2{,}000$ | $51$ minutes | $6%$ |
The central city contains the region’s largest concentration of offices, hospitals, universities, and government services. The highway corridor has experienced rapid residential construction, but employment has grown more slowly. Planners predict that a rail station in the corridor would encourage additional housing development and could reduce automobile dependence if frequent service and affordable fares were provided.
A. Identify the urban land-use process most directly associated with the outward expansion of residential development along the highway corridor.
B. Describe one spatial relationship shown by the data.
C. Explain one reason the highway corridor has a longer average commute than the central city.
D. Explain one likely environmental consequence of continued automobile-dependent growth in the highway corridor.
E. Explain one way the proposed commuter-rail line could produce a social or economic change in the corridor.
F. Explain how the likely effects of the rail line could differ between the metropolitan scale and the neighborhood scale.
G. Explain one limitation of using the table alone to evaluate whether the rail project would reduce automobile dependence.
Worked reasoning and scoring
A — 1 point: Identify the process. The correct identification is urban sprawl, meaning the low-density outward expansion of urban development into formerly rural or less-developed land. Simply writing “urbanization” is insufficient because urbanization is the growth of the urban population or urban areas generally; the stimulus specifically describes dispersed outward expansion.
B — 1 point: Describe a spatial relationship. A creditworthy response could state: “Population density decreases from the central city toward the outer suburbs, while the percentage of workers using public transportation also decreases.” This earns the point because it identifies a pattern using at least two categories of geographic information. A vague statement such as “the zones are different” does not describe a measurable relationship.
C — 1 point: Explain a cause using geographic concepts. The corridor has longer commutes because housing has expanded faster than employment, forcing many residents to travel toward the central city or other employment centers. Its peripheral location and limited public transportation increase dependence on automobiles and lengthen travel distances. The strongest answers connect location and accessibility to the outcome rather than merely stating that the corridor is “farther away.”
D — 1 point: Explain an environmental consequence. Continued automobile dependence would likely increase greenhouse-gas emissions and local air pollution because more residents would drive longer distances. Additional roads and low-density construction could also increase impervious surface, storm-water runoff, habitat fragmentation, and land consumption. One explained consequence is enough; listing several consequences without a causal connection does not earn additional credit.
E — 1 point: Explain a social or economic effect. A rail station could improve access to central-city jobs, universities, and services for residents who cannot drive, thereby increasing economic opportunity and labor-market connectivity. It could also attract transit-oriented development near the station. A complete explanation must show the mechanism: improved transportation access changes the spatial relationship between residents and opportunities.
F — 1 point: Analyze scale. At the metropolitan scale, rail could reduce regional automobile trips and connect the corridor to the central city. At the neighborhood scale, however, benefits may be uneven: households within walking distance of the station may gain access and property value, while distant neighborhoods may receive little benefit. New investment could also contribute to displacement if housing costs rise. This response demonstrates Scale Analysis, not merely a definition of scale.
G — 1 point: Identify a data limitation and explain its significance. The table does not show the number of automobile trips, the distance residents travel, the frequency of existing transit, household income, or changes over time. Therefore, it shows an association between location, density, commute time, and transit use but cannot by itself establish that a rail line would cause people to stop driving. A stronger evaluation would compare travel behavior before and after rail construction or examine similar corridors with and without rail service.
Skill map: what the examiner is rewarding
| Response part | Primary skill | Reasoning move |
|---|---|---|
| A, C, D, E | Skill 1. Concepts and Processes | Apply urbanization, accessibility, and human-environment concepts |
| B | Skill 2. Spatial Relationships | Connect density, location, transportation, and commute patterns |
| B, G | Skill 3. Data Analysis | Extract patterns and recognize limits of a data display |
| D, E | Skill 4. Source Analysis | Use the written scenario as geographic evidence |
| F | Skill 5. Scale Analysis | Compare metropolitan and neighborhood outcomes |
Common misconception check: “A higher-density place always has shorter commutes.” Density can support shorter trips and transit, but commute time also depends on employment location, housing affordability, road congestion, transit quality, and the distance between residences and workplaces. The data show a relationship in this metropolitan region; they do not establish a universal rule.
Error-review routine
After completing the response, label each answer I for identification, D for description, or E for explanation. For every explanation, underline the geographic mechanism: because, therefore, or an equivalent causal connection. Then check whether each claim uses the stimulus, names a relevant process, and addresses the requested scale. If an answer merely defines a term or repeats a number, revise it into claim → evidence → geographic reasoning.

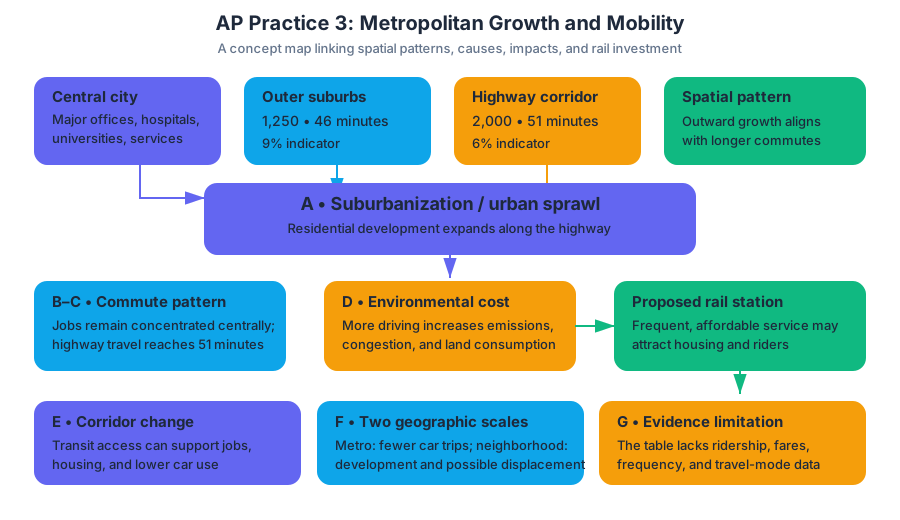
AP Practice 4
A geographic pattern becomes meaningful only when you connect where something occurs with why it occurs there. In this original, unofficial stimulus-based free-response question, a map and data table require you to move from visual evidence to geographic explanation.
AP Practice 4
A geographic pattern becomes meaningful only when you connect where something occurs with why it occurs there. In this original, unofficial stimulus-based free-response question, a map and data table require you to move from visual evidence to geographic explanation.
Practice target: stimulus-based FRQ
Allow approximately 15 minutes. Read the map and table before reading the parts. Mark two things: the spatial pattern shown by the map and the relationship suggested by the data. The strongest responses use evidence from the stimulus and then explain the geographic process behind that evidence.
Stimulus: Coastal solar-farm development in the fictional country of Lydora
Map 1. Solar-farm locations and annual precipitation
                         NORTH
      ┌─────────────────────────────────────────┐
      │  Highland interior                       │
      │        ▲ ▲ ▲                             │
      │     ●      ▲        ●                    │
      │                                           │
      │                 River basin               │
      │              ●        ●                  │
      │                                           │
      │  Coastal plain        ● ● ● ●             │
      │  Port city ★      ● ● ● ●                 │
      └─────────────────────────────────────────┘
      Legend: ● solar farm   ★ major port
      ▲ high-relief land
      Darker shading toward the coast indicates
      lower annual precipitation.
| Region | Annual precipitation in millimeters | Average distance to major transmission lines in kilometers | Solar farms |
|---|---|---|---|
| Highland interior | 1,180 | 74 | 2 |
| River basin | 760 | 39 | 4 |
| Coastal plain | 310 | 12 | 8 |
A. Identify the region with the greatest concentration of solar farms and describe the spatial pattern shown on Map 1.
B. Using Map 1 and the data table, explain one environmental factor that may encourage solar-farm development in the region identified in part A.
C. Using the data table, explain how infrastructure may influence the distribution of solar farms.
D. Explain one reason why the map pattern alone cannot establish that low precipitation caused the distribution of solar farms.
Worked reasoning
Part A: Identify and describe
The correct region is the coastal plain, which contains eight solar farms, the largest number in the table. A complete spatial description states more than “the farms are near the coast”: the farms are clustered on the low-precipitation coastal plain and become less numerous toward the wetter, higher-relief interior.
Scoring logic: Earn the identification point by naming the coastal plain. Earn the description point by explaining the concentration or gradient using the map, such as the coastal clustering and decreasing number of farms inland. Naming a region without describing its pattern is incomplete.
Part B: Connect location to environment
An environmental factor is the coastal plain’s relatively low precipitation: it receives $310$ millimeters annually, compared with $760$ millimeters in the river basin and $1{,}180$ millimeters in the highlands. Lower precipitation can mean fewer clouds and more consistently sunny conditions, which may increase the reliability of solar-energy generation.
Scoring logic: The response must identify an environmental factor and connect it to the location of solar farms. “The coast is dry” earns little by itself; “lower precipitation may produce more sunlight, supporting solar generation” supplies the required geographic explanation.
Part C: Analyze infrastructure
The coastal plain has the shortest average distance to major transmission lines, only $12$ kilometers, while the river basin averages $39$ kilometers and the highlands $74$ kilometers. Because electricity must be transported from a generating site to consumers, developers may prefer locations close to existing transmission infrastructure: shorter connections generally reduce construction costs and energy loss.
Scoring logic: This earns the point because it uses quantitative evidence and explains a mechanism. The answer does not merely repeat that the coastal plain is “closest”; it explains why proximity to transmission lines can affect site selection.
Part D: Avoid a causation error
The pattern shows an association, not definite causation. Other factors could also influence the distribution, including land prices, government incentives, available land, proximity to the port, or local zoning rules. In addition, the table compares only three broad regions, so it cannot isolate precipitation from these other variables.
Scoring logic: A strong answer distinguishes correlation—two patterns occurring together—from causation, in which one factor produces a change in another. This response also identifies a plausible confounding factor or limitation of the data.
Skills being assessed
- Skill 2: Spatial Relationships — interpreting the clustering, gradient, and regional distribution shown on the map.
- Skill 3: Data Analysis — comparing precipitation, infrastructure distance, and solar-farm counts.
- Skill 4: Source Analysis — extracting geographic evidence from a map as a visual source.
- Skill 5: Scale Analysis — recognizing that broad regional averages may conceal differences among individual sites.
Timing and error review
Use about 2 minutes to inspect the stimulus, 10 minutes to answer, and 3 minutes to review. During review, underline every numerical or mapped piece of evidence. Then ask: Did I identify the pattern? Did I explain a process? Did I use the stimulus rather than rely on outside knowledge?
Common errors include describing the map without explaining it, giving a cause without stimulus evidence, and treating a regional association as proof of causation. If an answer says only “solar farms are near transmission lines,” revise it to include the distance comparison and the mechanism connecting infrastructure to development.
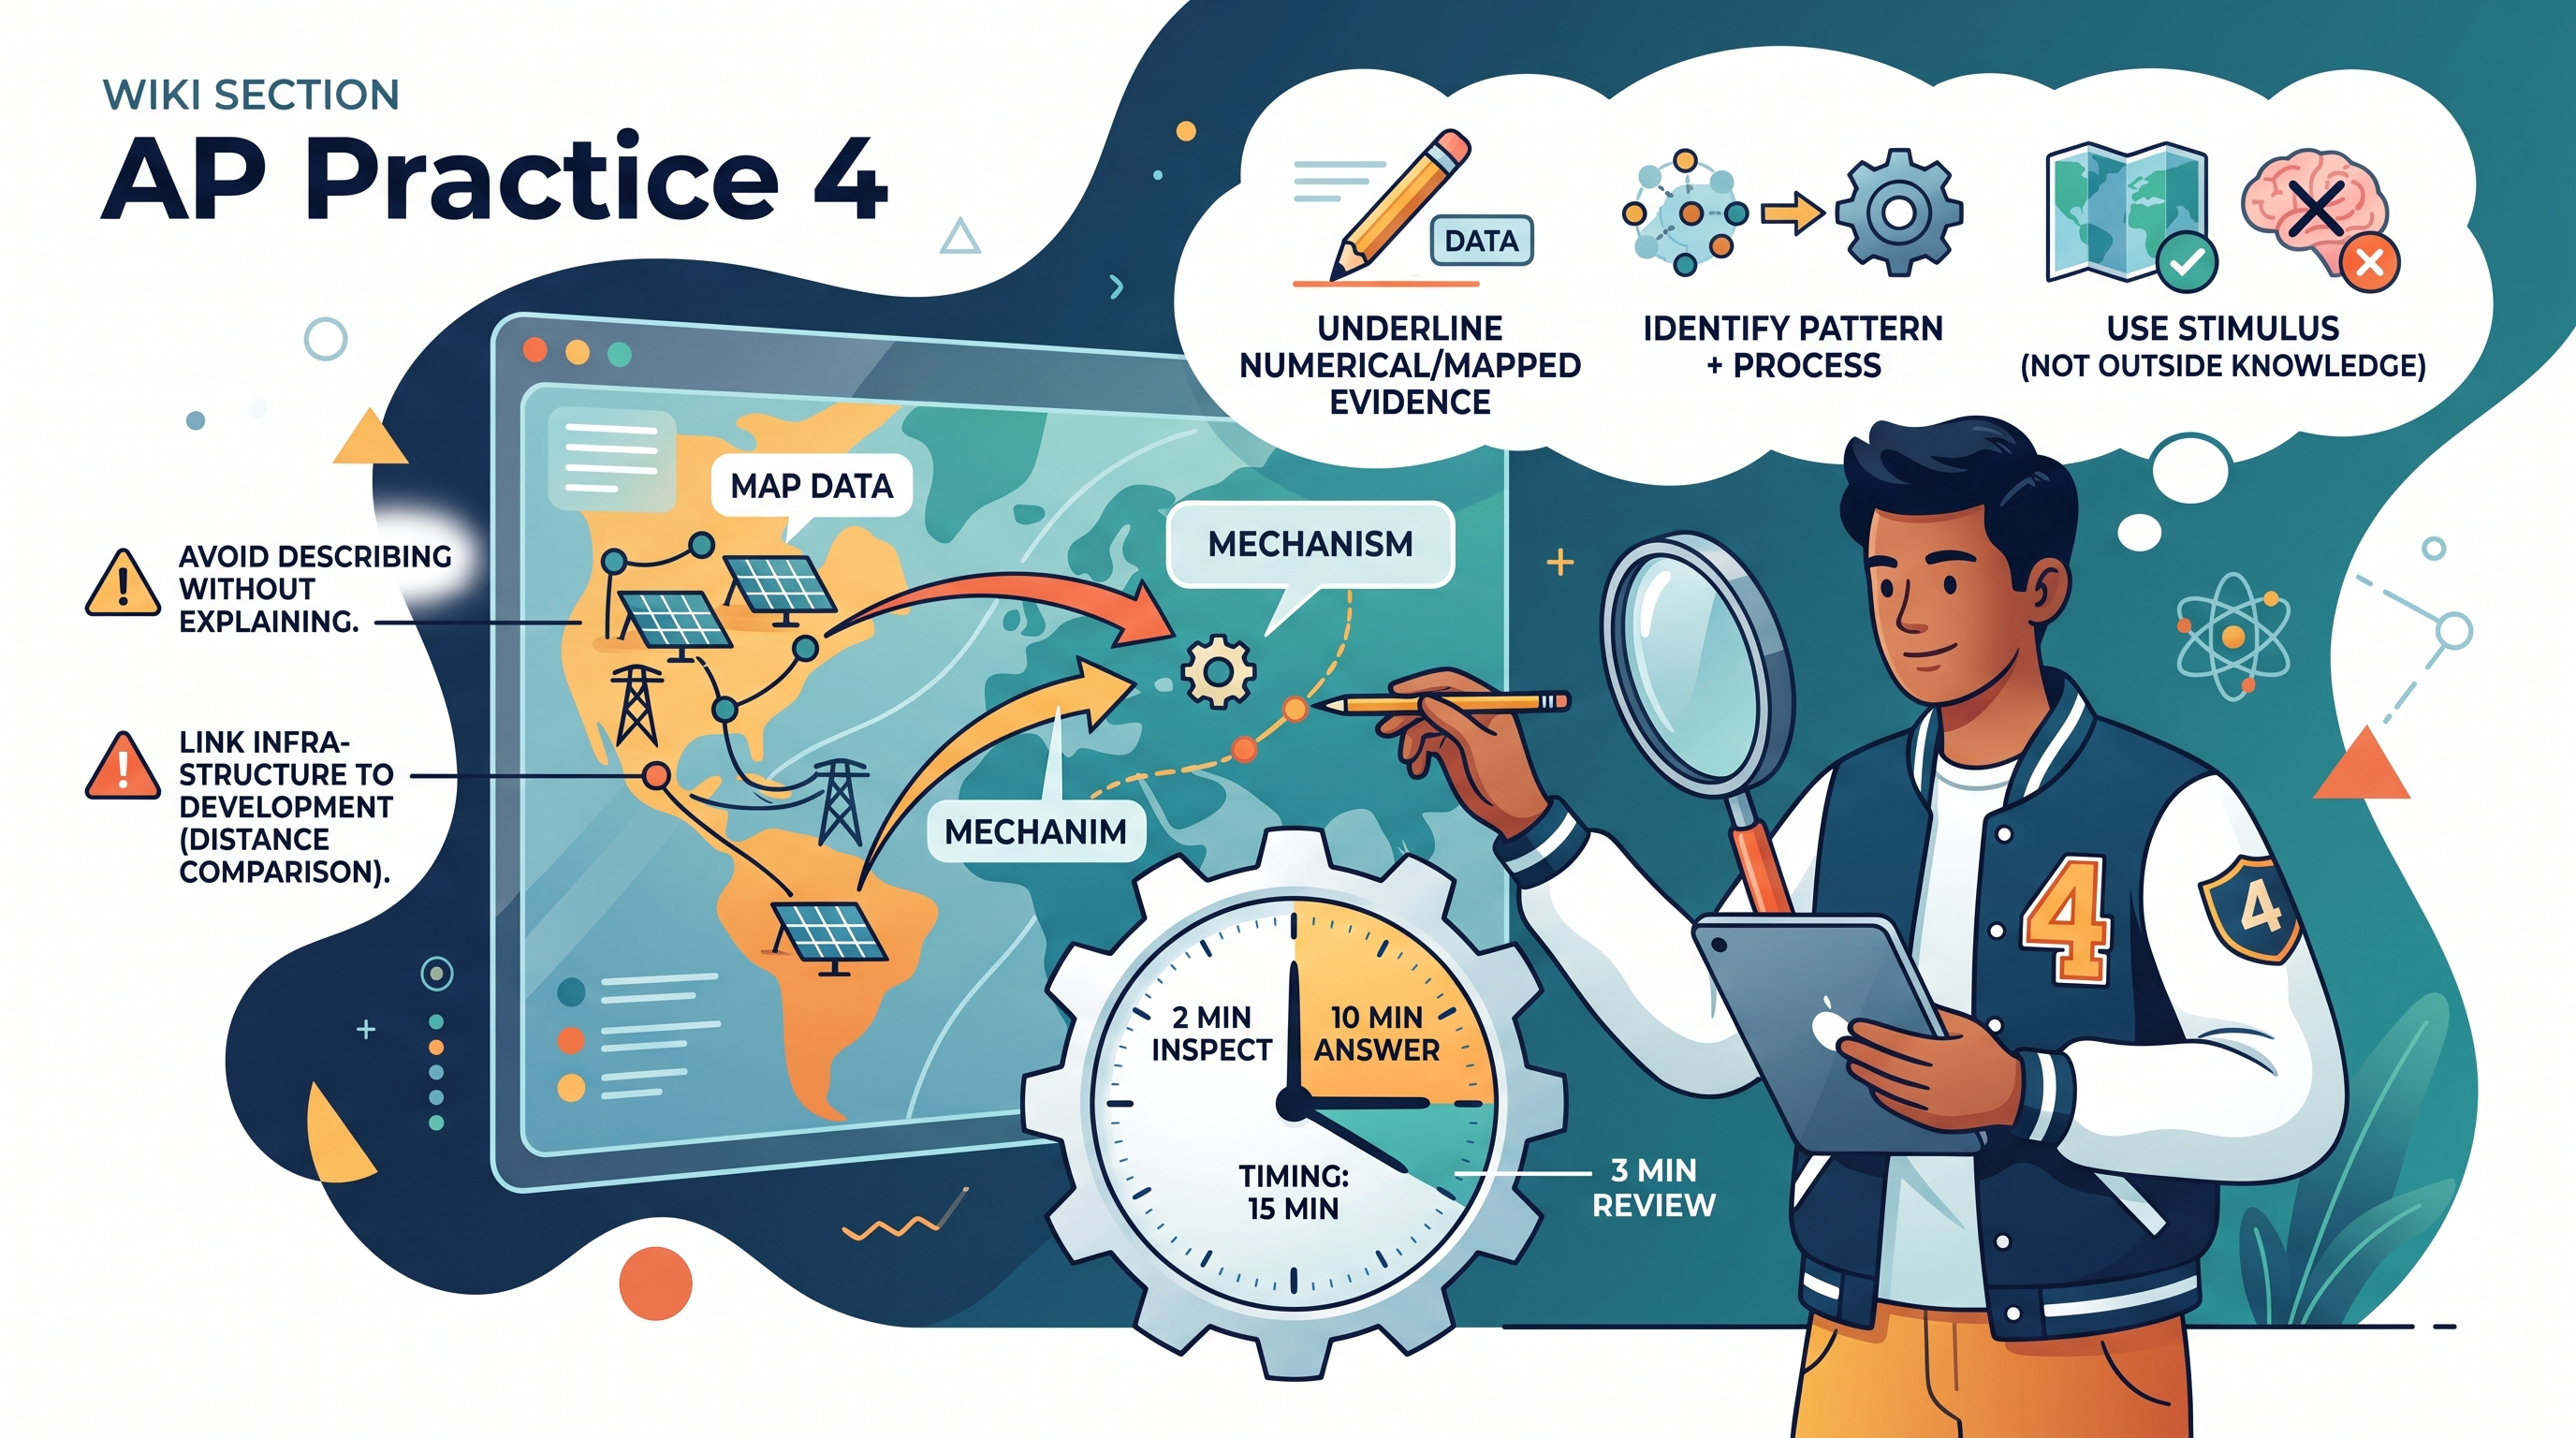
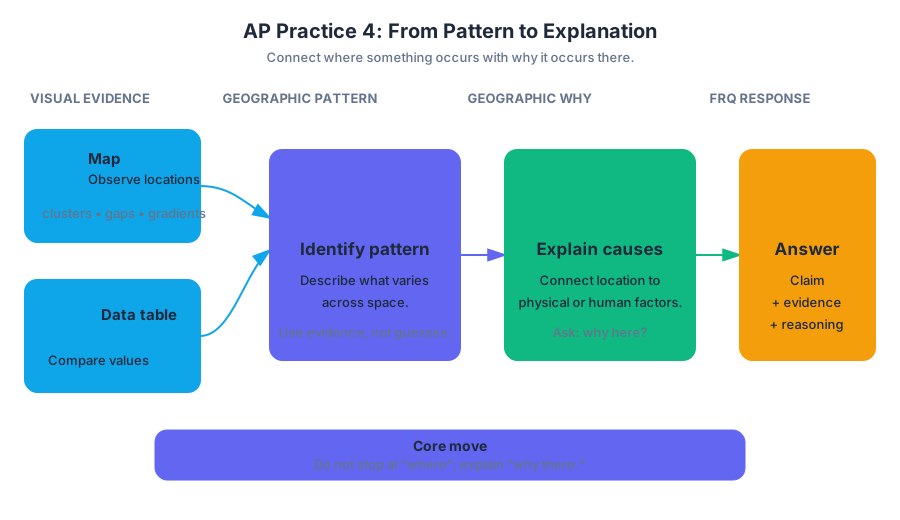
AP Practice 5
A strong free-response answer does more than name a geographic term: it connects a spatial pattern to a process, supports the connection with evidence, and explains why the outcome matters.
AP Practice 5
A strong free-response answer does more than name a geographic term: it connects a spatial pattern to a process, supports the connection with evidence, and explains why the outcome matters. This original, unofficial practice set targets a stimulus-based free-response question (FRQ) using agricultural data and asks you to move among Skill Category 2: Spatial Relationships, Skill Category 3: Data Analysis, and Skill Category 5: Scale Analysis.
Exam task: data-supported FRQ
Suggested timing: spend approximately 25 minutes on this question, including a brief planning period. Write in complete, geographically precise sentences. For each part, answer the task that is asked; an impressive but irrelevant fact does not earn credit.
A national government is comparing four agricultural regions to decide where to expand irrigation and agricultural extension services. The regions differ in climate, farm organization, market access, and production systems.
| Region | Average farm size | Share of farms producing for export | Irrigated farmland | Distance to major port | Main agricultural activity |
|---|---|---|---|---|---|
| A | 2 hectares | 8% | 18% | 620 kilometers | Subsistence grain and vegetables |
| B | 1,400 hectares | 76% | 64% | 90 kilometers | Mechanized wheat and oilseed production |
| C | 6 hectares | 21% | 11% | 410 kilometers | Smallholder coffee and food crops |
| D | 850 hectares | 69% | 72% | 55 kilometers | Fruit, dairy, and processed food |
(a) Identify one region in the table that most closely reflects commercial agriculture, and explain one piece of evidence supporting your choice.
(b) Explain one way that transportation costs could influence the spatial organization of agriculture in Region B or Region D.
(c) Explain one environmental consequence that could result from expanding irrigation in Region B or Region D.
(d) Explain one way the agricultural system in Region C could affect the region at a different geographic scale.
Worked reasoning
Part (a): identify, then prove
Region B or Region D is an acceptable choice because both show strong indicators of commercial agriculture, which is production intended primarily for sale rather than for direct household consumption. Region B has very large farms, a high export share, and substantial mechanization implied by its large-scale wheat and oilseed production.
A response that says only “Region B is commercial” is incomplete. The explanation must connect the classification to evidence in the table—for example, the 76% share of farms producing for export or the average farm size of 1,400 hectares.
Rewardable reasoning: commercial purpose → large-scale production and market orientation → Region B or D.
Part (b): connect distance to land use
Region B is located farther from a major port than Region D, so transportation costs may be higher for Region B’s exported wheat and oilseeds. To remain profitable, producers may favor crops that are relatively durable, storable, and capable of being transported in bulk; alternatively, high transport costs may encourage processing closer to the production area.
The key geographic relationship is not simply “ports are good.” It is distance to market → transportation cost → crop choice, processing location, or land value. Region D’s proximity to a port makes it more feasible to export perishable fruit and dairy products, especially when cold storage or rapid shipping is available.
Rewardable reasoning: transportation cost changes with distance and affects the economic suitability of different agricultural activities.
Part (c): explain a consequence, not merely name one
Expanding irrigation could lower groundwater levels if farmers withdraw water faster than natural systems replenish it. This may produce a short-term increase in crop output but create long-term water scarcity, higher pumping costs, or conflict among agricultural, household, and industrial users.
Other valid consequences include soil salinization, waterlogging, reduced river flow, or damage to downstream ecosystems. The answer must include a mechanism. “Irrigation harms the environment” is too vague; “evaporation leaves dissolved salts in the soil, reducing future agricultural productivity” explains how the consequence occurs.
Rewardable reasoning: irrigation expansion → increased water withdrawal or altered drainage → a specific environmental effect.
Part (d): change the scale
At the national scale, Region C’s smallholder coffee production could generate export revenue and connect the country to global commodity chains. However, dependence on an export commodity may also expose the national economy to changing world prices, weather shocks, or decisions made by international buyers.
This answer works because it moves beyond the region itself. A local farming pattern becomes a national economic issue through trade, employment, tax revenue, or vulnerability to global markets. A response that merely repeats that Region C has small farms does not demonstrate Scale Analysis.
Rewardable reasoning: regional production pattern → national trade or economic outcome.
Rubric map: what earns credit
| Part | Core requirement | Common incomplete response |
|---|---|---|
| (a) | Correctly identify commercial agriculture and support it with table evidence | Gives a region without evidence |
| (b) | Link distance or market access to transportation costs and agricultural organization | Names distance but explains no effect |
| (c) | Identify a specific environmental consequence and explain its causal mechanism | Lists “pollution” or “water shortage” without explaining how |
| (d) | Apply the regional pattern at another geographic scale | Describes the same region without changing scale |
Misconception check: “commercial” does not mean “wealthy”
Commercial agriculture describes the purpose and market orientation of production, not whether every farmer is wealthy or whether a country is highly developed. A smallholder coffee farmer may participate in commercial agriculture by selling coffee for export while also growing food for household consumption.
Error-review routine
After completing the FRQ, mark each sentence as claim, evidence, or mechanism. If a part contains only a claim, add evidence. If it contains evidence but no mechanism, add the causal “because” sentence. Finally, underline every geographic scale named in part (d); if no scale changes, revise the response.
Retrieval check
Why might Region D be better suited than Region B for exporting perishable fruit? A complete answer should connect proximity to market, transportation costs, and the need for rapid or specialized distribution.
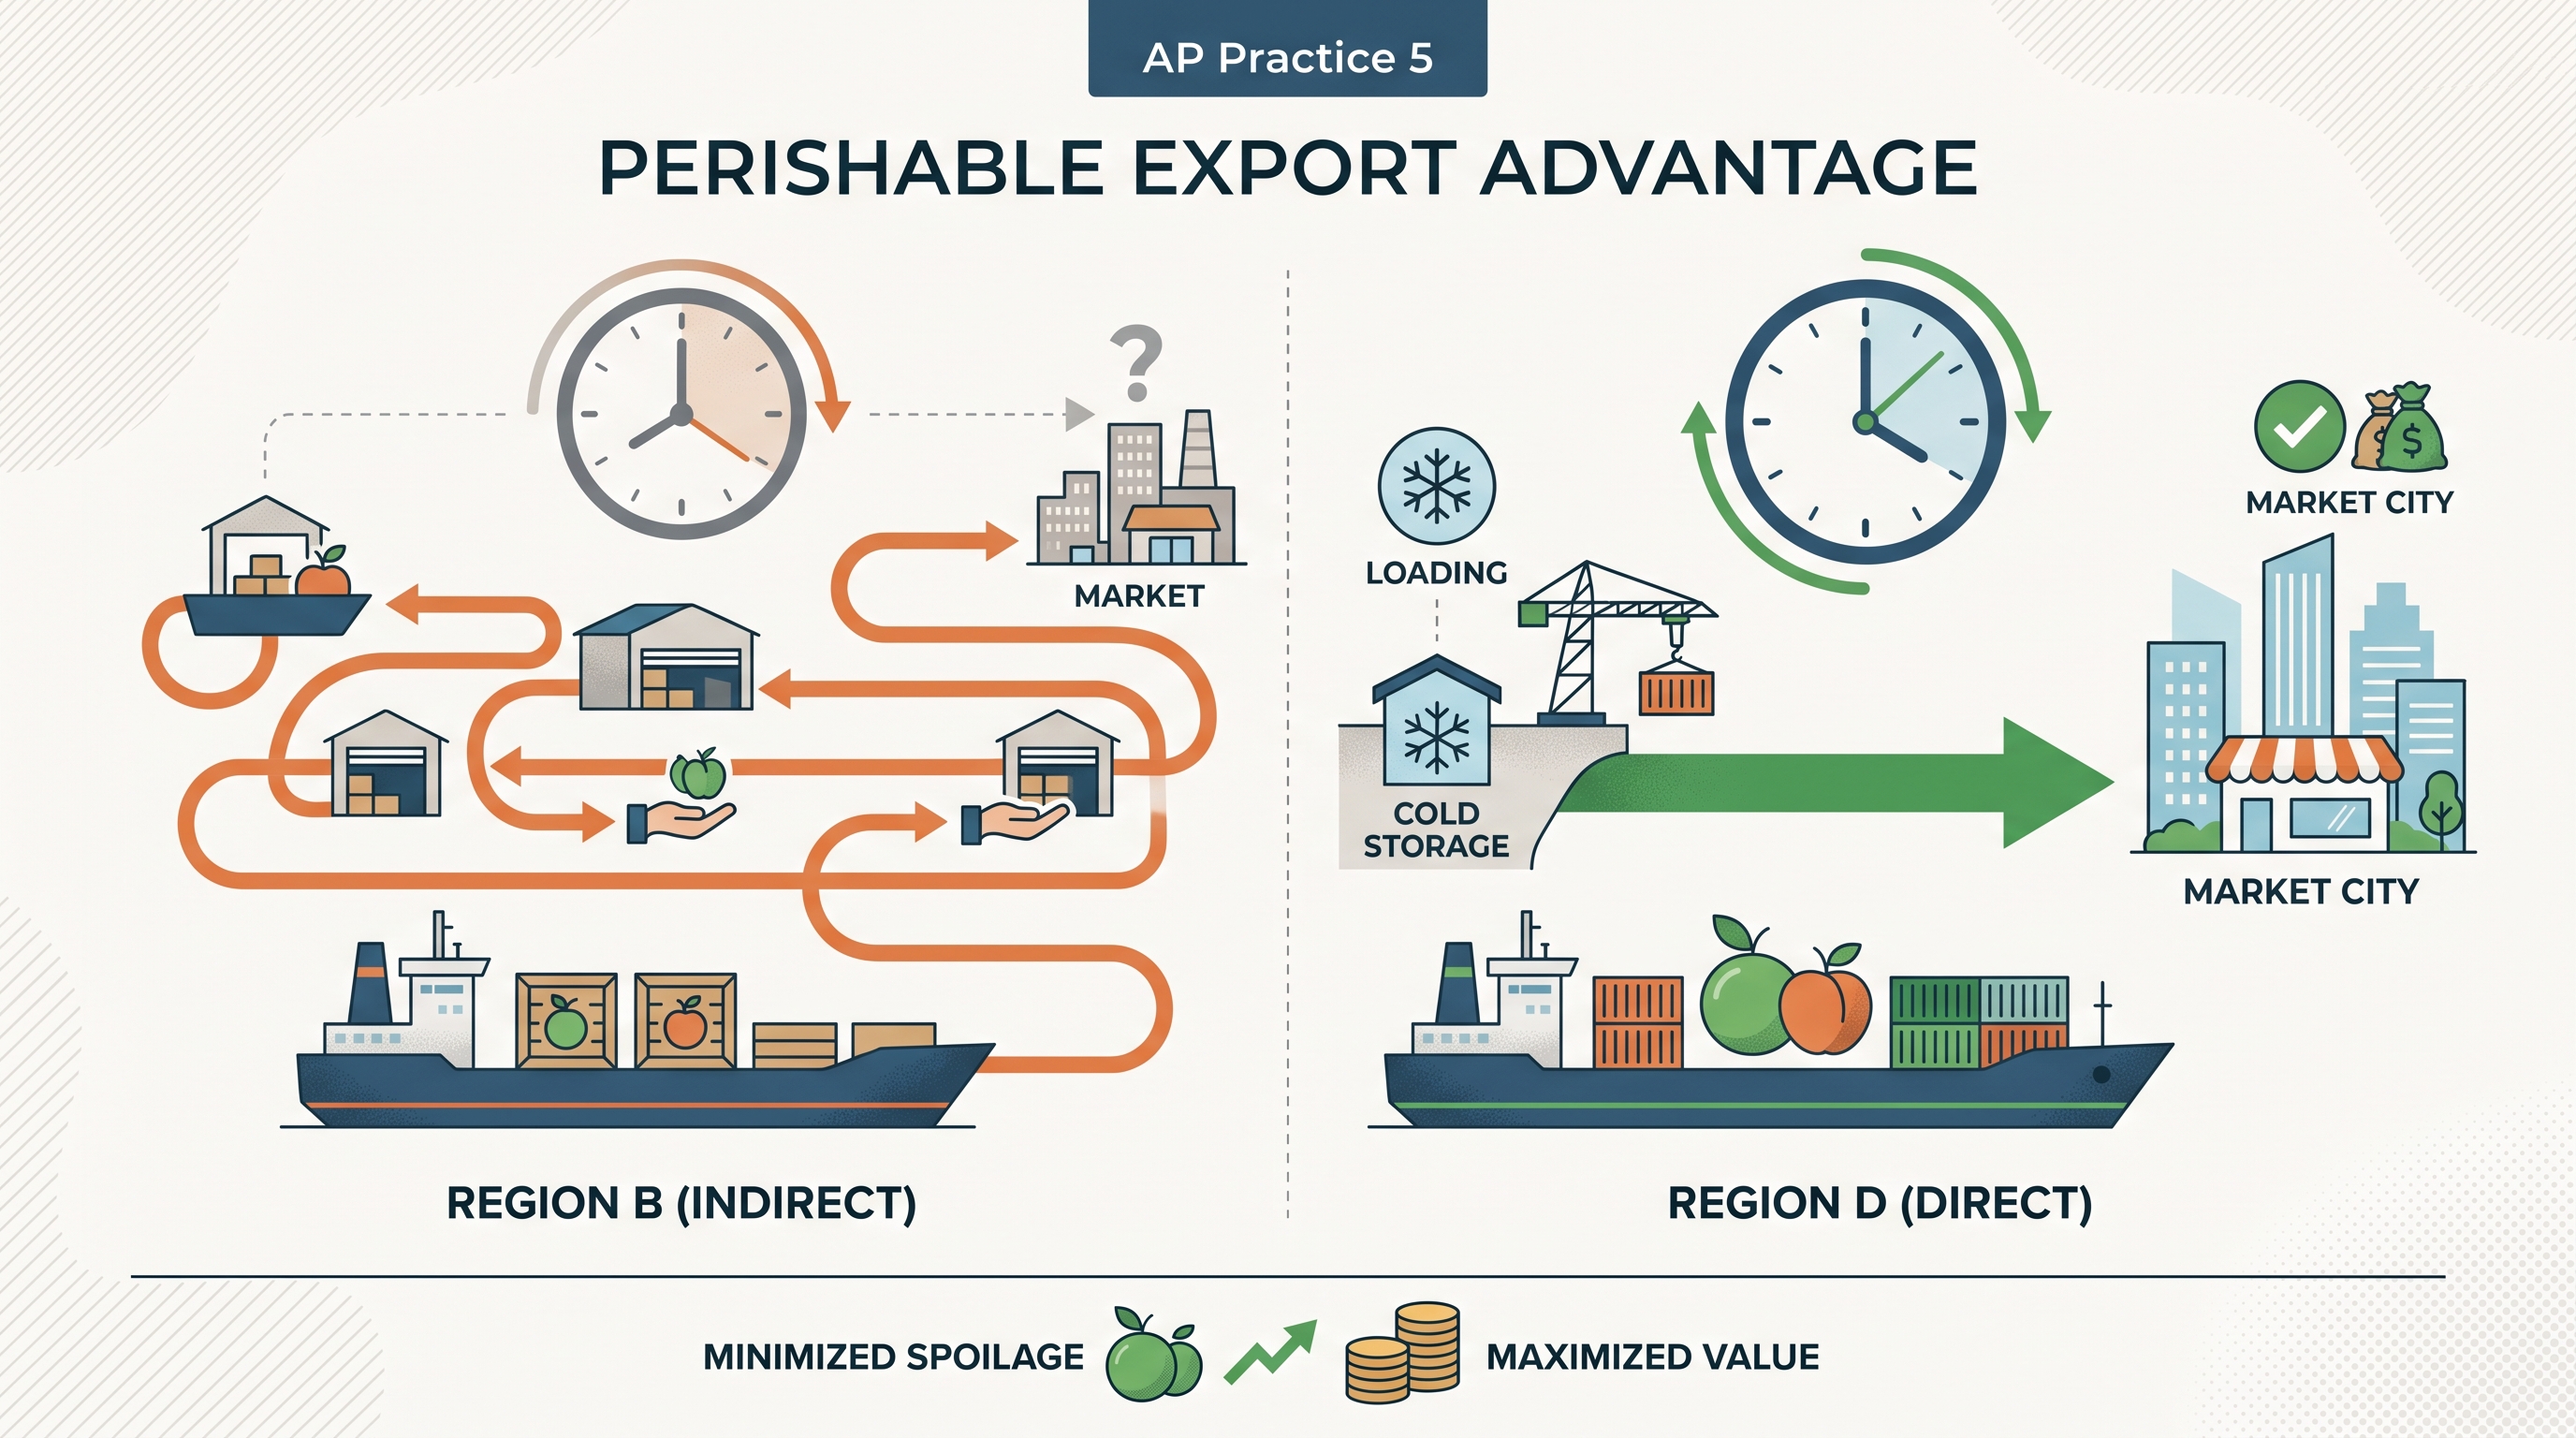
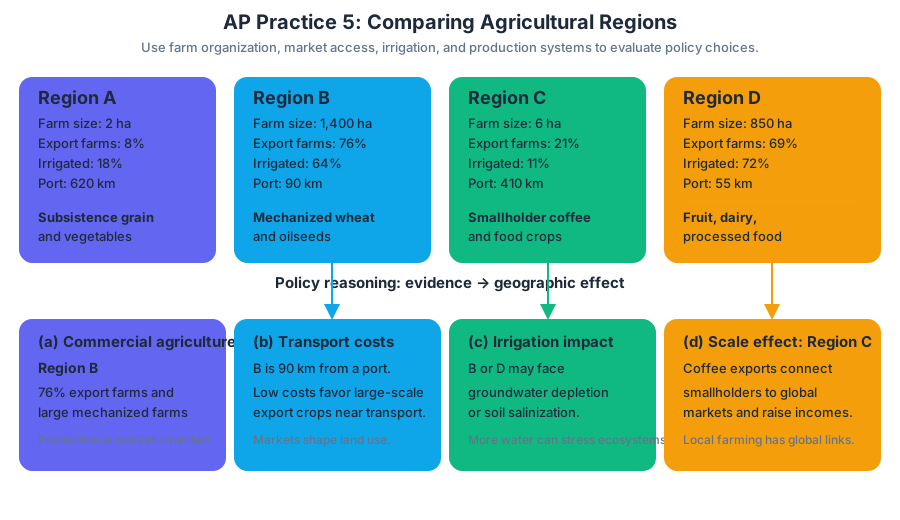
AP Practice 6
A strong free-response question (FRQ) answer does more than name a geographic term: it connects a concept to a place, explains a spatial relationship, interprets evidence, and follows the question’s command precisely.
AP Practice 6
A strong free-response question (FRQ) answer does more than name a geographic term: it connects a concept to a place, explains a spatial relationship, interprets evidence, and follows the question’s command precisely. This practice targets the FRQ task type through an original, unofficial scenario about agricultural change and urban growth.
Exam conditions: Set aside approximately $25$ minutes for one three-part FRQ. Budget about $3$ minutes to read, $17$ minutes to write, and $5$ minutes to check that every requested part contains a complete geographic explanation.
Original Practice FRQ: Food, Cities, and Regional Change
The fictional country of Lunara has experienced rapid urban growth. Between $2005$ and $2025$, the share of Lunara’s population living in urban areas increased from $42%$ to $68%$. During the same period, farms near the capital city increasingly shifted from staple grains to vegetables, eggs, and fresh milk. These products are sold in the capital’s expanding supermarkets and restaurants.
The government also invested in refrigerated trucks, paved roads, and irrigation systems. However, many small family farms were replaced by larger commercial farms, and some rural workers moved to the capital in search of employment.
A. Describe one reason agricultural land near the capital is being used for products such as vegetables, eggs, and fresh milk rather than staple grains.
B. Explain one way improved transportation or storage infrastructure could affect the spatial organization of agriculture in Lunara.
C. Explain one consequence of the shift toward commercial agriculture for either rural communities or the urban population.
How to Decode the Prompt
The command describe requires an accurate characteristic or reason. The command explain requires a relationship written as cause and effect. A response that merely identifies “urbanization” or “commercial farming” without showing how one condition produces another is incomplete.
A useful evidence chain is:
Urban growth $\rightarrow$ larger nearby market $\rightarrow$ greater demand for perishable foods $\rightarrow$ high-value, market-oriented farming near the city.
The scenario also connects several course ideas: 5.7 Spatial Organization of Agriculture, 5.8 Von Thünen Model, 5.9 The Global System of Agriculture, 5.10 Consequences of Agricultural Practices, 6.1 The Origin and Influences of Urbanization, and 6.7 Infrastructure. The strongest answers use only the concepts needed for the specific part rather than listing every related topic.
Worked Response and Rubric Logic
Part A: Describe
Sample response: Agricultural land near the capital is increasingly devoted to vegetables, eggs, and fresh milk because the nearby urban population creates strong demand for fresh food. These products are often perishable, so producing them close to the market reduces the time and cost required to move them to consumers.
Why this earns the point: The response gives a valid reason—urban demand—and adds a geographic mechanism—shorter transport distance for perishable goods. This applies the logic of the Von Thünen Model, in which land uses near a market are influenced by transportation costs, crop value, and perishability.
Part B: Explain
Sample response: Refrigerated trucks and paved roads allow perishable agricultural products to travel farther without spoiling. As a result, vegetables, eggs, and milk do not have to be produced only in the immediate area around the capital, so commercial farms may expand into more distant rural areas while still serving the urban market.
Why this earns the point: The answer identifies an infrastructure improvement and explains its spatial effect. Refrigeration lowers the risk of spoilage, while roads reduce travel time and transportation costs. Together, they can enlarge the agricultural market area and weaken the strict distance pattern predicted by a simplified Von Thünen Model.
Part C: Explain
Sample response: The replacement of family farms by larger commercial farms may cause rural workers to migrate to the capital. Commercial farms can use economies of scale—lower average costs when production is organized on a larger scale—but may require fewer workers per unit of output. This can reduce rural employment while increasing the supply of agricultural labor in the city.
Why this earns the point: The response identifies a consequence, names a relevant process, and connects the process to an outcome. It does not assume that commercial agriculture has only negative effects: larger farms may increase production efficiency, but the transition can also disrupt rural livelihoods and accelerate rural-to-urban migration.
Common Misconceptions Examiners See
Misconception 1: “Perishable crops are always grown in the city.” Urban proximity matters, but farms are generally located outside dense urban areas because land is expensive and agricultural production requires space. The geographic relationship is near the market, not necessarily inside the city.
Misconception 2: “Better roads make transportation free.” Infrastructure usually reduces travel time, spoilage, or cost; it does not eliminate them. A precise answer explains which transportation constraint changes.
Misconception 3: “Commercial agriculture means food is exported.” Commercial agriculture means production primarily for sale, not necessarily for international export. Lunara’s farms can be commercial while supplying domestic supermarkets.
Misconception 4: “Explain means define.” Defining economies of scale is not enough for Part C. The response must show the chain: larger farms $\rightarrow$ lower average costs or increased efficiency $\rightarrow$ possible displacement of family farms or rural workers.
Skill Alignment and Self-Check
This FRQ primarily assesses Skill Category 1: Concepts and Processes, because responses apply the Von Thünen Model, economies of scale, and urbanization. It also assesses Skill Category 2: Spatial Relationships, because each answer must connect distance, market access, infrastructure, and land use. Skill Category 5: Scale Analysis becomes relevant when explaining how changes at the farm or rural-community scale affect the national urban system.
Before moving on, cover the sample responses and answer from memory: Why do perishable goods often locate near markets? How can infrastructure expand a market area? What is one beneficial and one disruptive consequence of commercial agriculture? If each answer contains a clear cause-and-effect chain, the geographic reasoning is doing the work—not vocabulary alone.
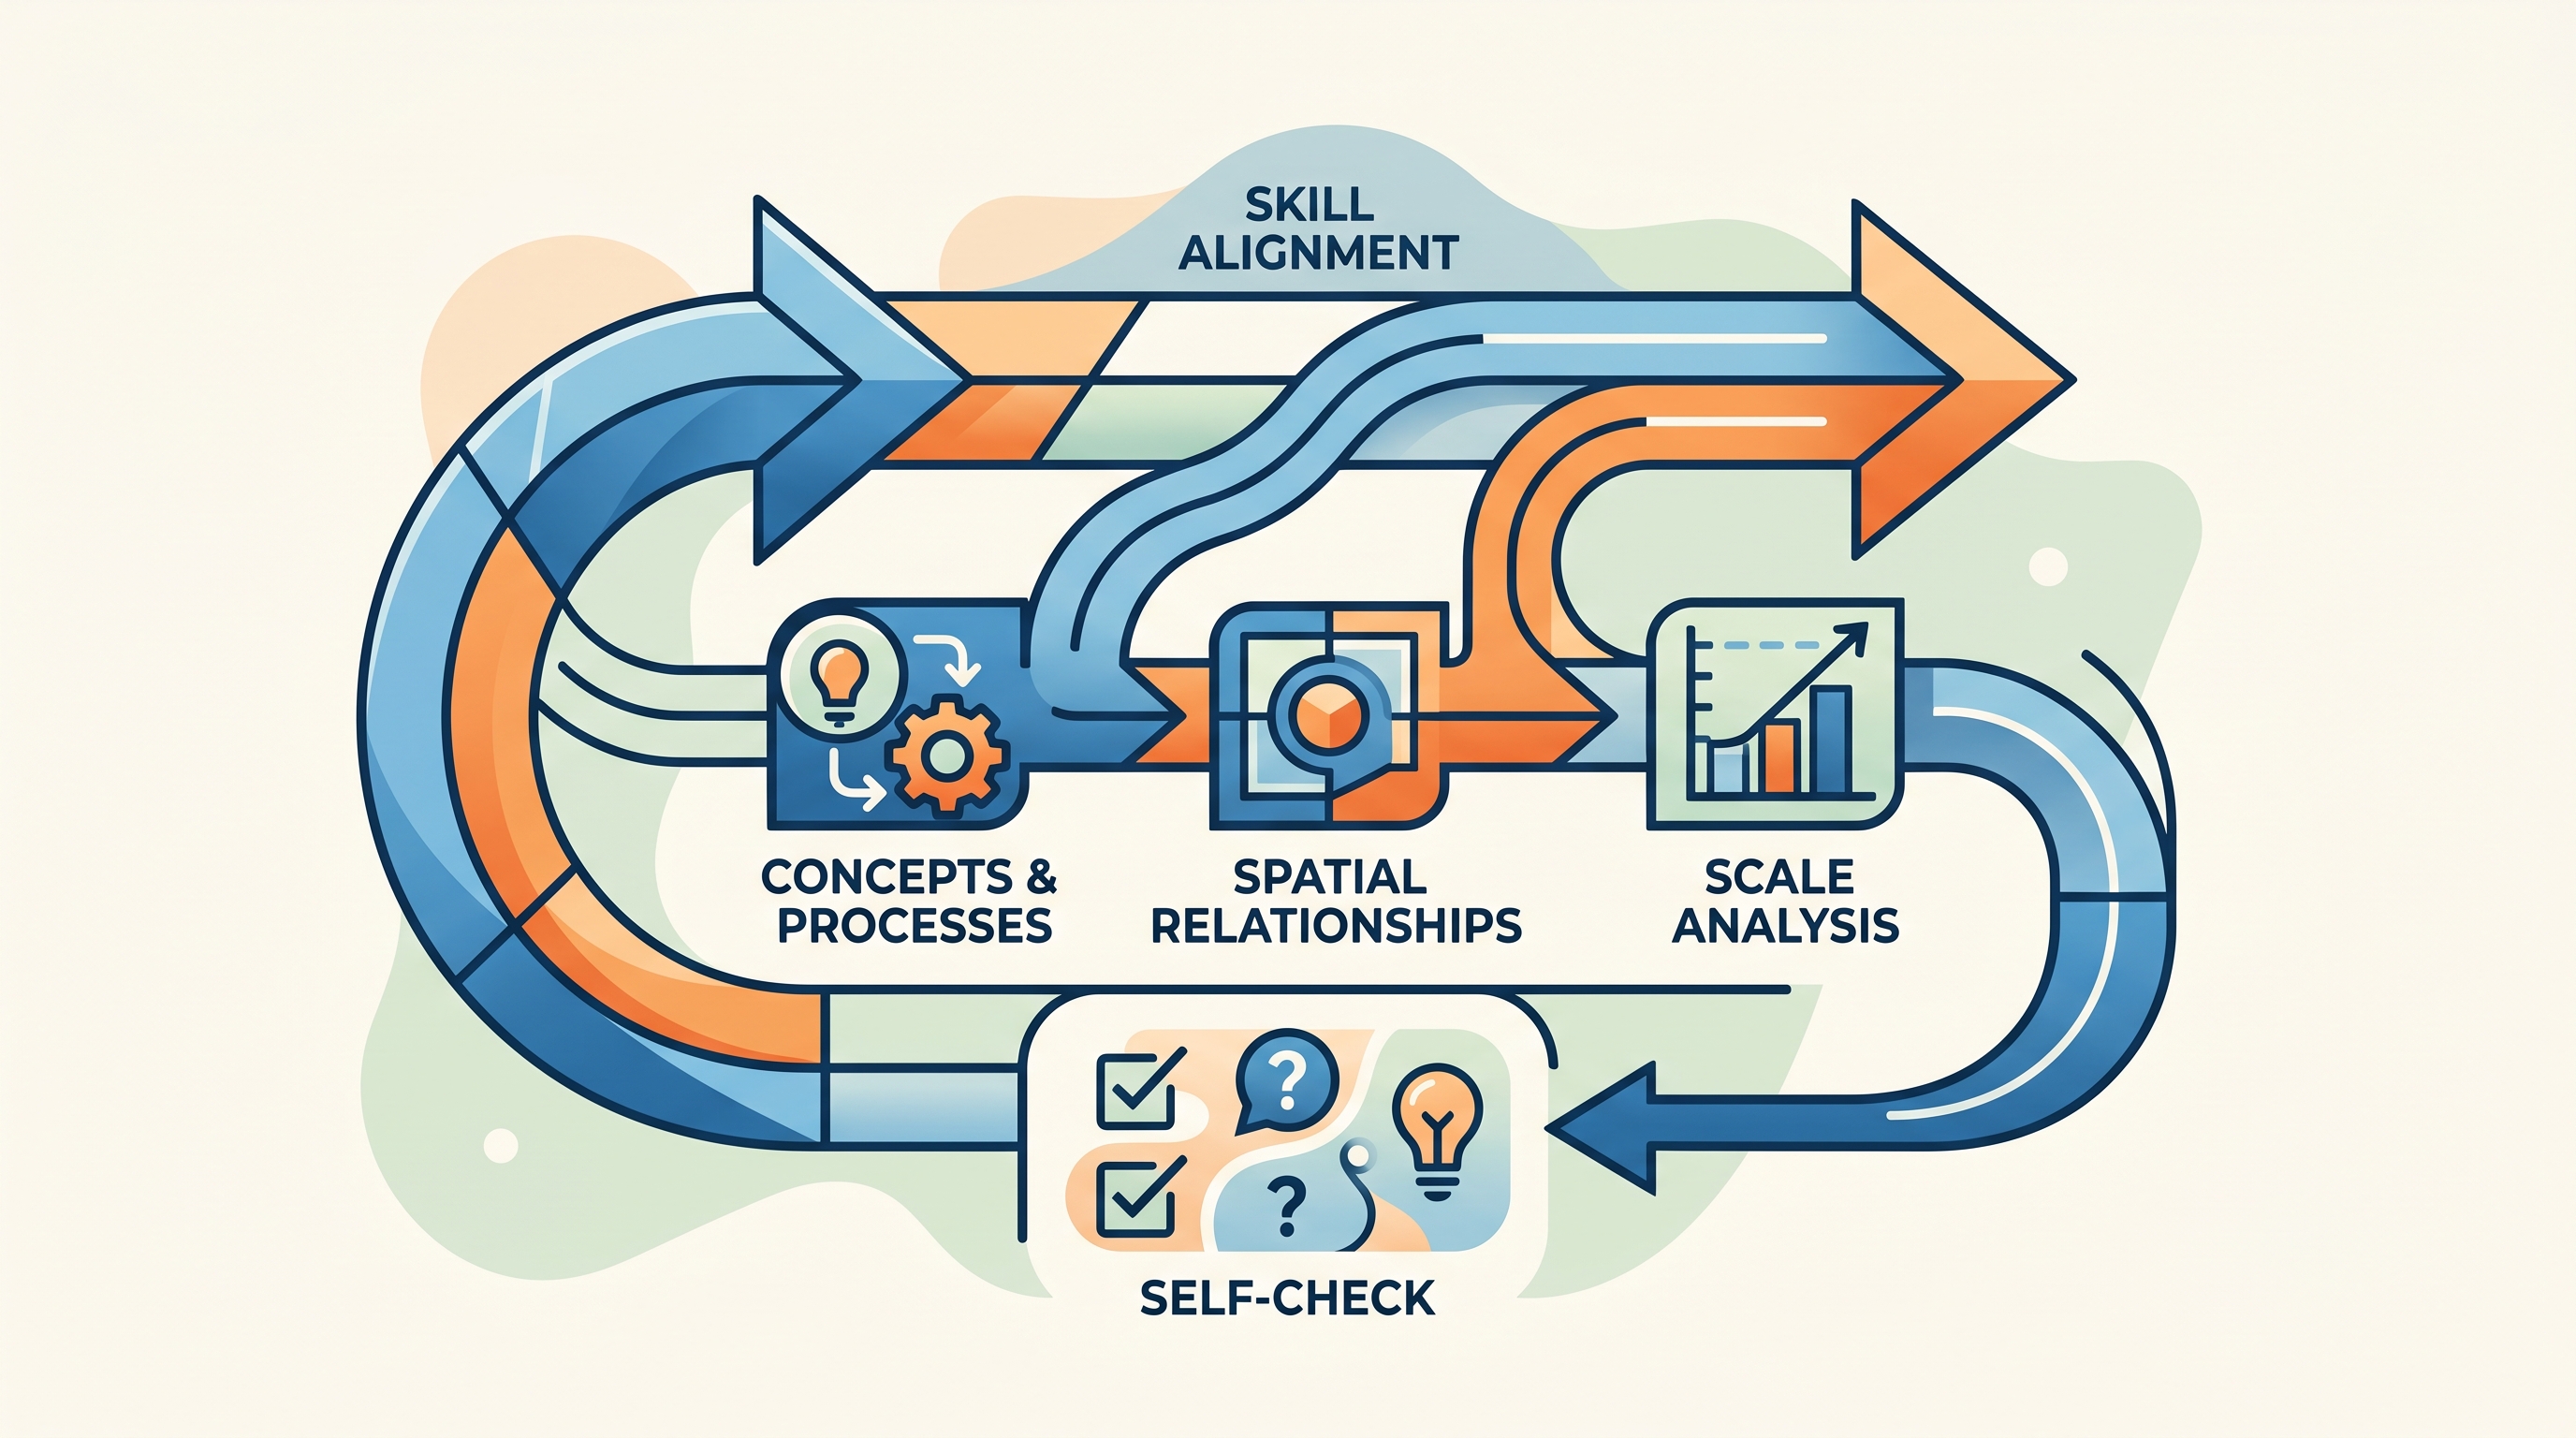
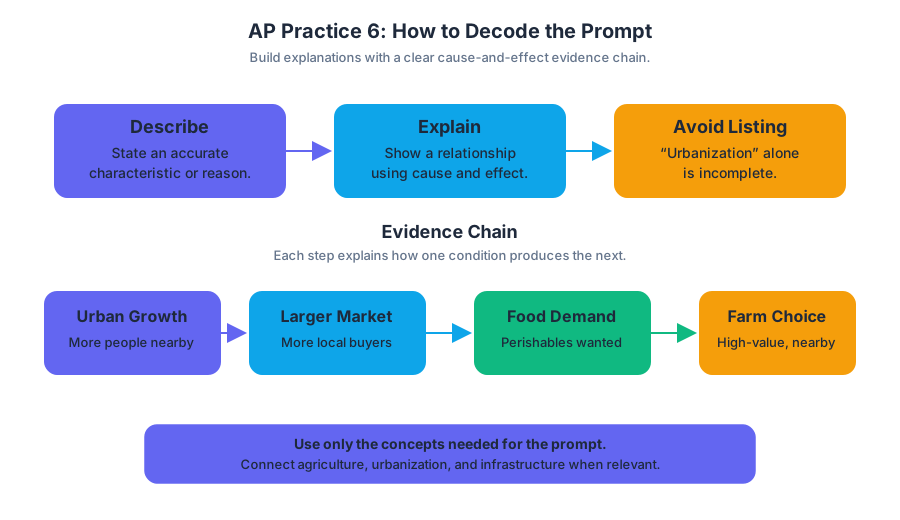
Source Materials
- AP Human Geography Course and Exam Description
- AP Human Geography Course and Exam Description Clarifications and Corrections
- AP Human Geography Course Overview
- AP Human Geography Course at a Glance
- AP Human Geography Course at a Glance Poster
- AP Human Geography
- AP Human Geography
- AP Human Geography Sample Syllabus 1
- Figure — AP Human Geography Course and Exam Description (p. 1)
- Figure — AP Human Geography Course and Exam Description (p. 17)
- Figure — AP Human Geography Course and Exam Description (p. 23)
- Course Framework V.1 | 17 AP Human Geography Course and Exam Description
Study AP Human Geography with AI — Free on Lykke
Sign up for free to generate personalized flashcards, quizzes, and study guides from this course. Chat with an AI tutor that knows the material.
Get Started FreeView this course wiki on Lykke · Browse all public course wikis