From the free course AP Human Geography on Lykke
4.2 Political Processes
A boundary may look like a line on a map, but political processes determine who draws it, who votes within it, and whose interests receive attention afterward.
4.2 Political Processes
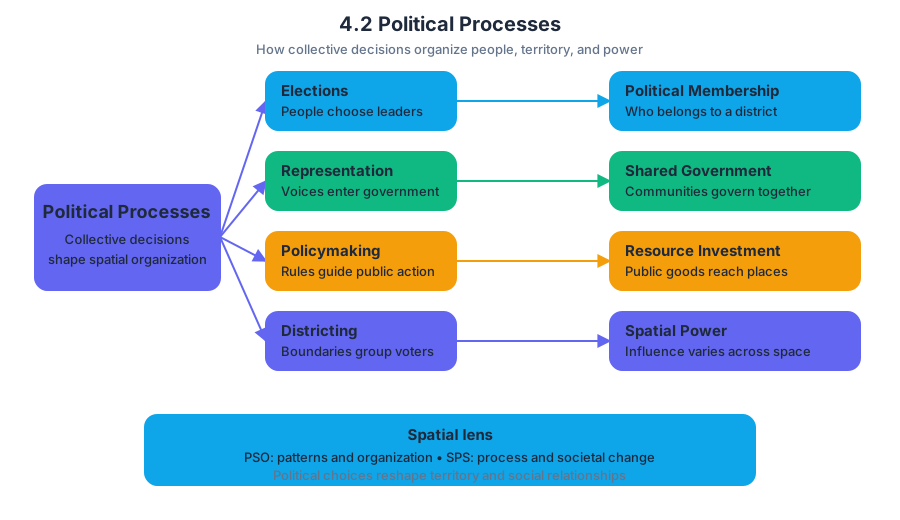
A boundary may look like a line on a map, but political processes determine who draws it, who votes within it, and whose interests receive attention afterward. Political processes are the actions and institutions through which people and governments make collective decisions, including elections, representation, policymaking, and the organization of voting districts.
Learning Objective 4.2.A: Explain how political processes impact the spatial organization of society.
Political decisions are never purely “nonspatial.” They organize territory by deciding which people belong to the same district, which communities share a government, where public resources are invested, and how political power is distributed across space. This makes Topic 4.2 a direct application of the course’s recurring ideas of Patterns and Spatial Organization (PSO) and Spatial Process and Societal Change (SPS).
Elections turn space into political representation
An election connects a population to a territory. Voters are grouped into geographic units—precincts, wards, constituencies, or districts—and those units determine how votes become seats or political authority. Because the design of these units affects outcomes, the same population can produce different political results under different spatial arrangements.
Representation means acting politically on behalf of a population. Ideally, districts contain roughly equal populations so that each person’s vote has comparable influence. In practice, representation can be shaped by uneven population growth, territorial boundaries, voting rules, and decisions about which communities are grouped together.
Worked example: redistricting after population change
Imagine a region with three districts, each intended to contain approximately $100{,}000$ residents. Over a decade, one urban area grows to $160{,}000$ people while a rural area declines to $60{,}000$. If the boundaries remain unchanged, an urban resident and a rural resident no longer have equal representational weight: one elected official represents many more people in the urban district than in the rural district.
A redistricting process redraws the district boundaries to reflect the new population distribution. That process may improve political equality, but the exact map still matters. If urban neighborhoods are divided among several districts, their shared interests may be diluted; if they remain concentrated in one district, they may gain stronger collective representation.
Redistricting and gerrymandering
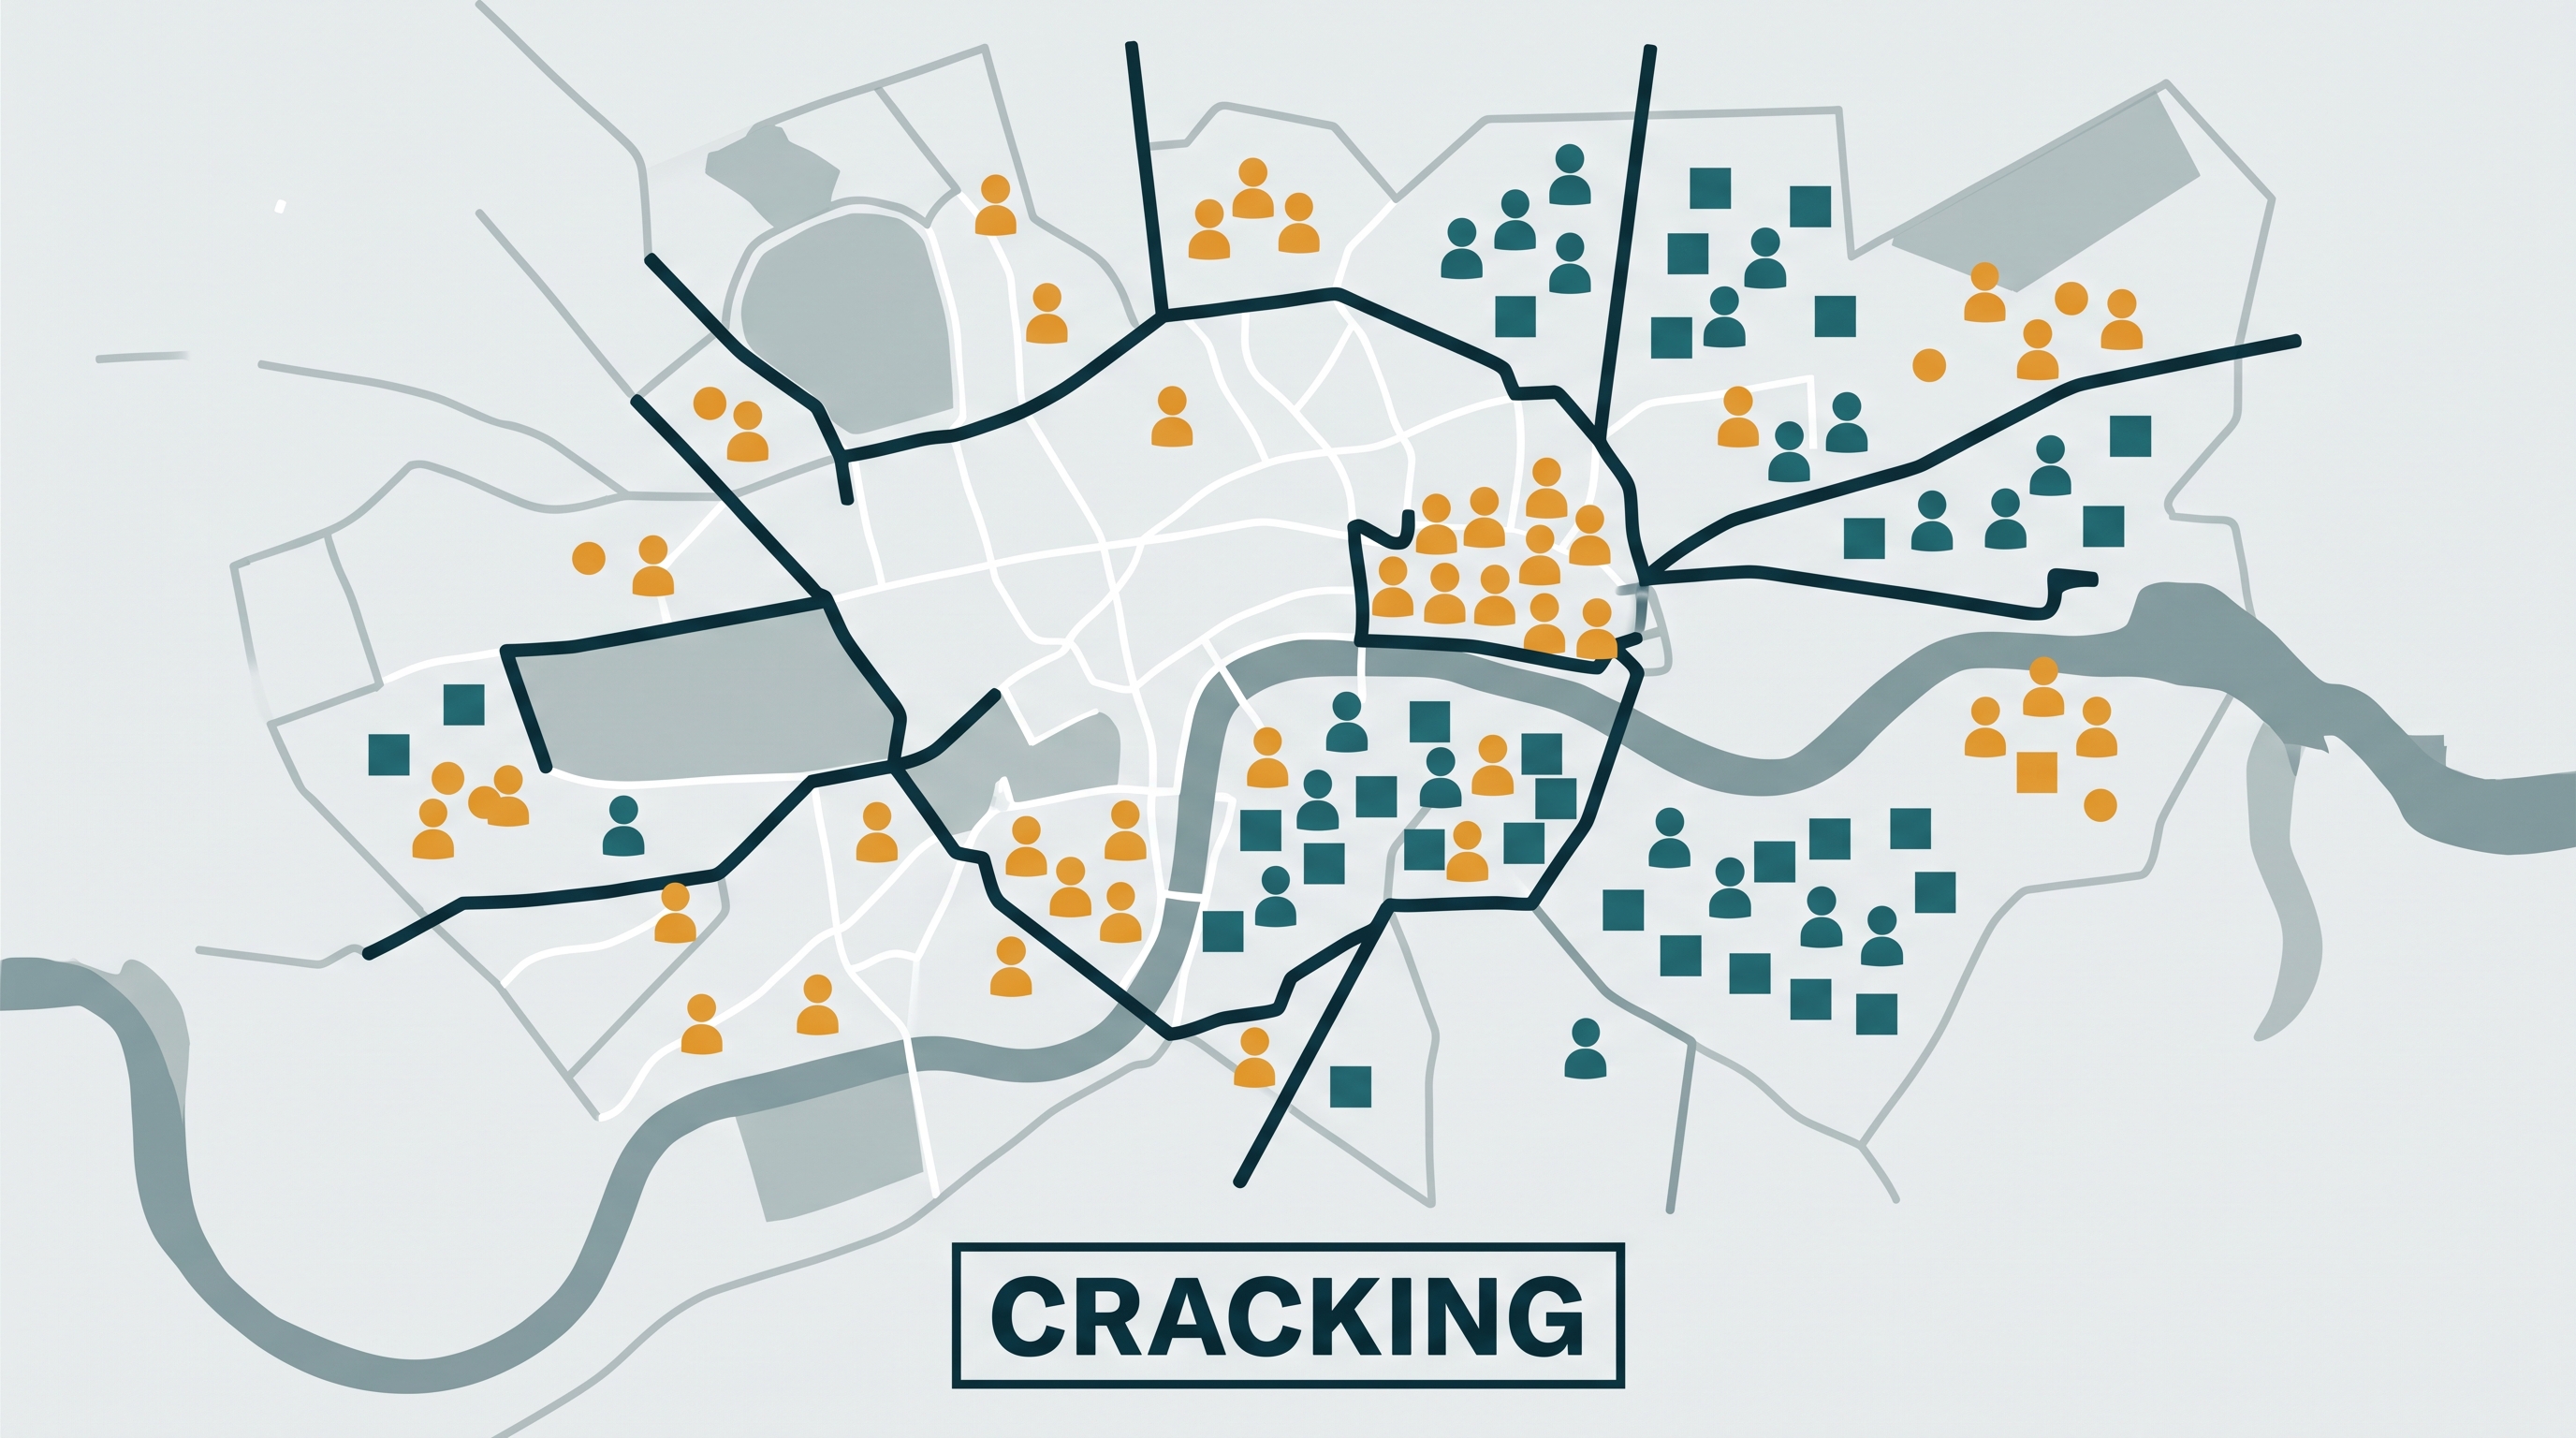
Redistricting is the redrawing of electoral boundaries, usually after a census or other population count. Redistricting is necessary when population distributions change, but it can also become a struggle over political power. Gerrymandering is the deliberate manipulation of electoral district boundaries to advantage a political party or another group.
Two common techniques explain how a map can change political outcomes without changing the voters:
- Packing concentrates members of an opposing group into a small number of districts, allowing them to win those districts by large margins but reducing their influence elsewhere.
- Cracking divides members of an opposing group among many districts, preventing them from forming a majority in any of them.
A useful way to visualize the difference is to imagine $40$ voters from Group A and $60$ voters from Group B distributed across four districts. If Group A voters are packed into one district, they may win that district with $100%$ of the vote but lose the other three. If they are cracked into four groups of $10$, Group B can form a majority in every district. The population has not changed; the spatial organization of voting power has.
Political processes distribute resources
Political processes also shape the geography of public investment. Elected officials and governments decide where to place schools, roads, hospitals, transit lines, public housing, military facilities, and environmental protections. These choices can reinforce existing inequalities when well-connected communities receive more resources or when marginalized communities are excluded from decision-making.
The process operates at multiple scales. A national government may distribute funding among regions, a state or province may allocate money among municipalities, and a city council may decide which neighborhoods receive infrastructure improvements. A pattern visible at one scale can look different at another, so Scale Analysis is essential when interpreting political outcomes.
Misconception check: “A map is neutral”
Misconception: Electoral maps merely reflect where people live.
Correction: Maps both reflect and shape political geography. Population distribution constrains the available choices, but boundary-makers decide how populations are grouped. A district map can therefore influence representation, policy priorities, and future political power.
AP skills in action
Topic 4.2 most directly develops Skill 1: Concepts and Processes, especially the analysis of political processes in applied contexts; Skill 2: Spatial Relationships, by connecting district patterns to political outcomes; Skill 3: Data Analysis, when interpreting population counts, election results, maps, or charts; Skill 4: Source Analysis, when evaluating electoral maps and other geographic representations; and Skill 5: Scale Analysis, when comparing local, regional, and national political effects.
On an exam, a strong explanation does more than identify gerrymandering or redistricting. It links a spatial arrangement to a political consequence: dividing a concentrated urban population among multiple districts can reduce its ability to elect a preferred representative because each district contains a larger opposing majority.
Retrieval check
A population group forms $55%$ of a city but wins only one of five electoral districts. What spatial process could explain this pattern, and how might it have affected political representation? A complete answer should identify cracking or another form of boundary manipulation and explain that dispersing the group across districts can prevent it from forming a majority in enough districts to gain proportional representation.
Source Materials
- AP Human Geography Course and Exam Description
- AP Human Geography Course and Exam Description Clarifications and Corrections
- AP Human Geography Course Overview
- AP Human Geography Course at a Glance
- AP Human Geography Course at a Glance Poster
- AP Human Geography
- AP Human Geography
- AP Human Geography Sample Syllabus 1