From the free course AP Human Geography on Lykke
1.4 Spatial Concepts
Key concepts: Spatial patterns · Spatial distribution · Spatial relationships · Diffusion · Domestication · Agglomeration · Clustering · Relative location · Geographic scale · Source analysis
A spatial pattern is never random decoration on a map: it records where phenomena are located, how they are arranged, and what relationships connect them.
1.4 Spatial Concepts
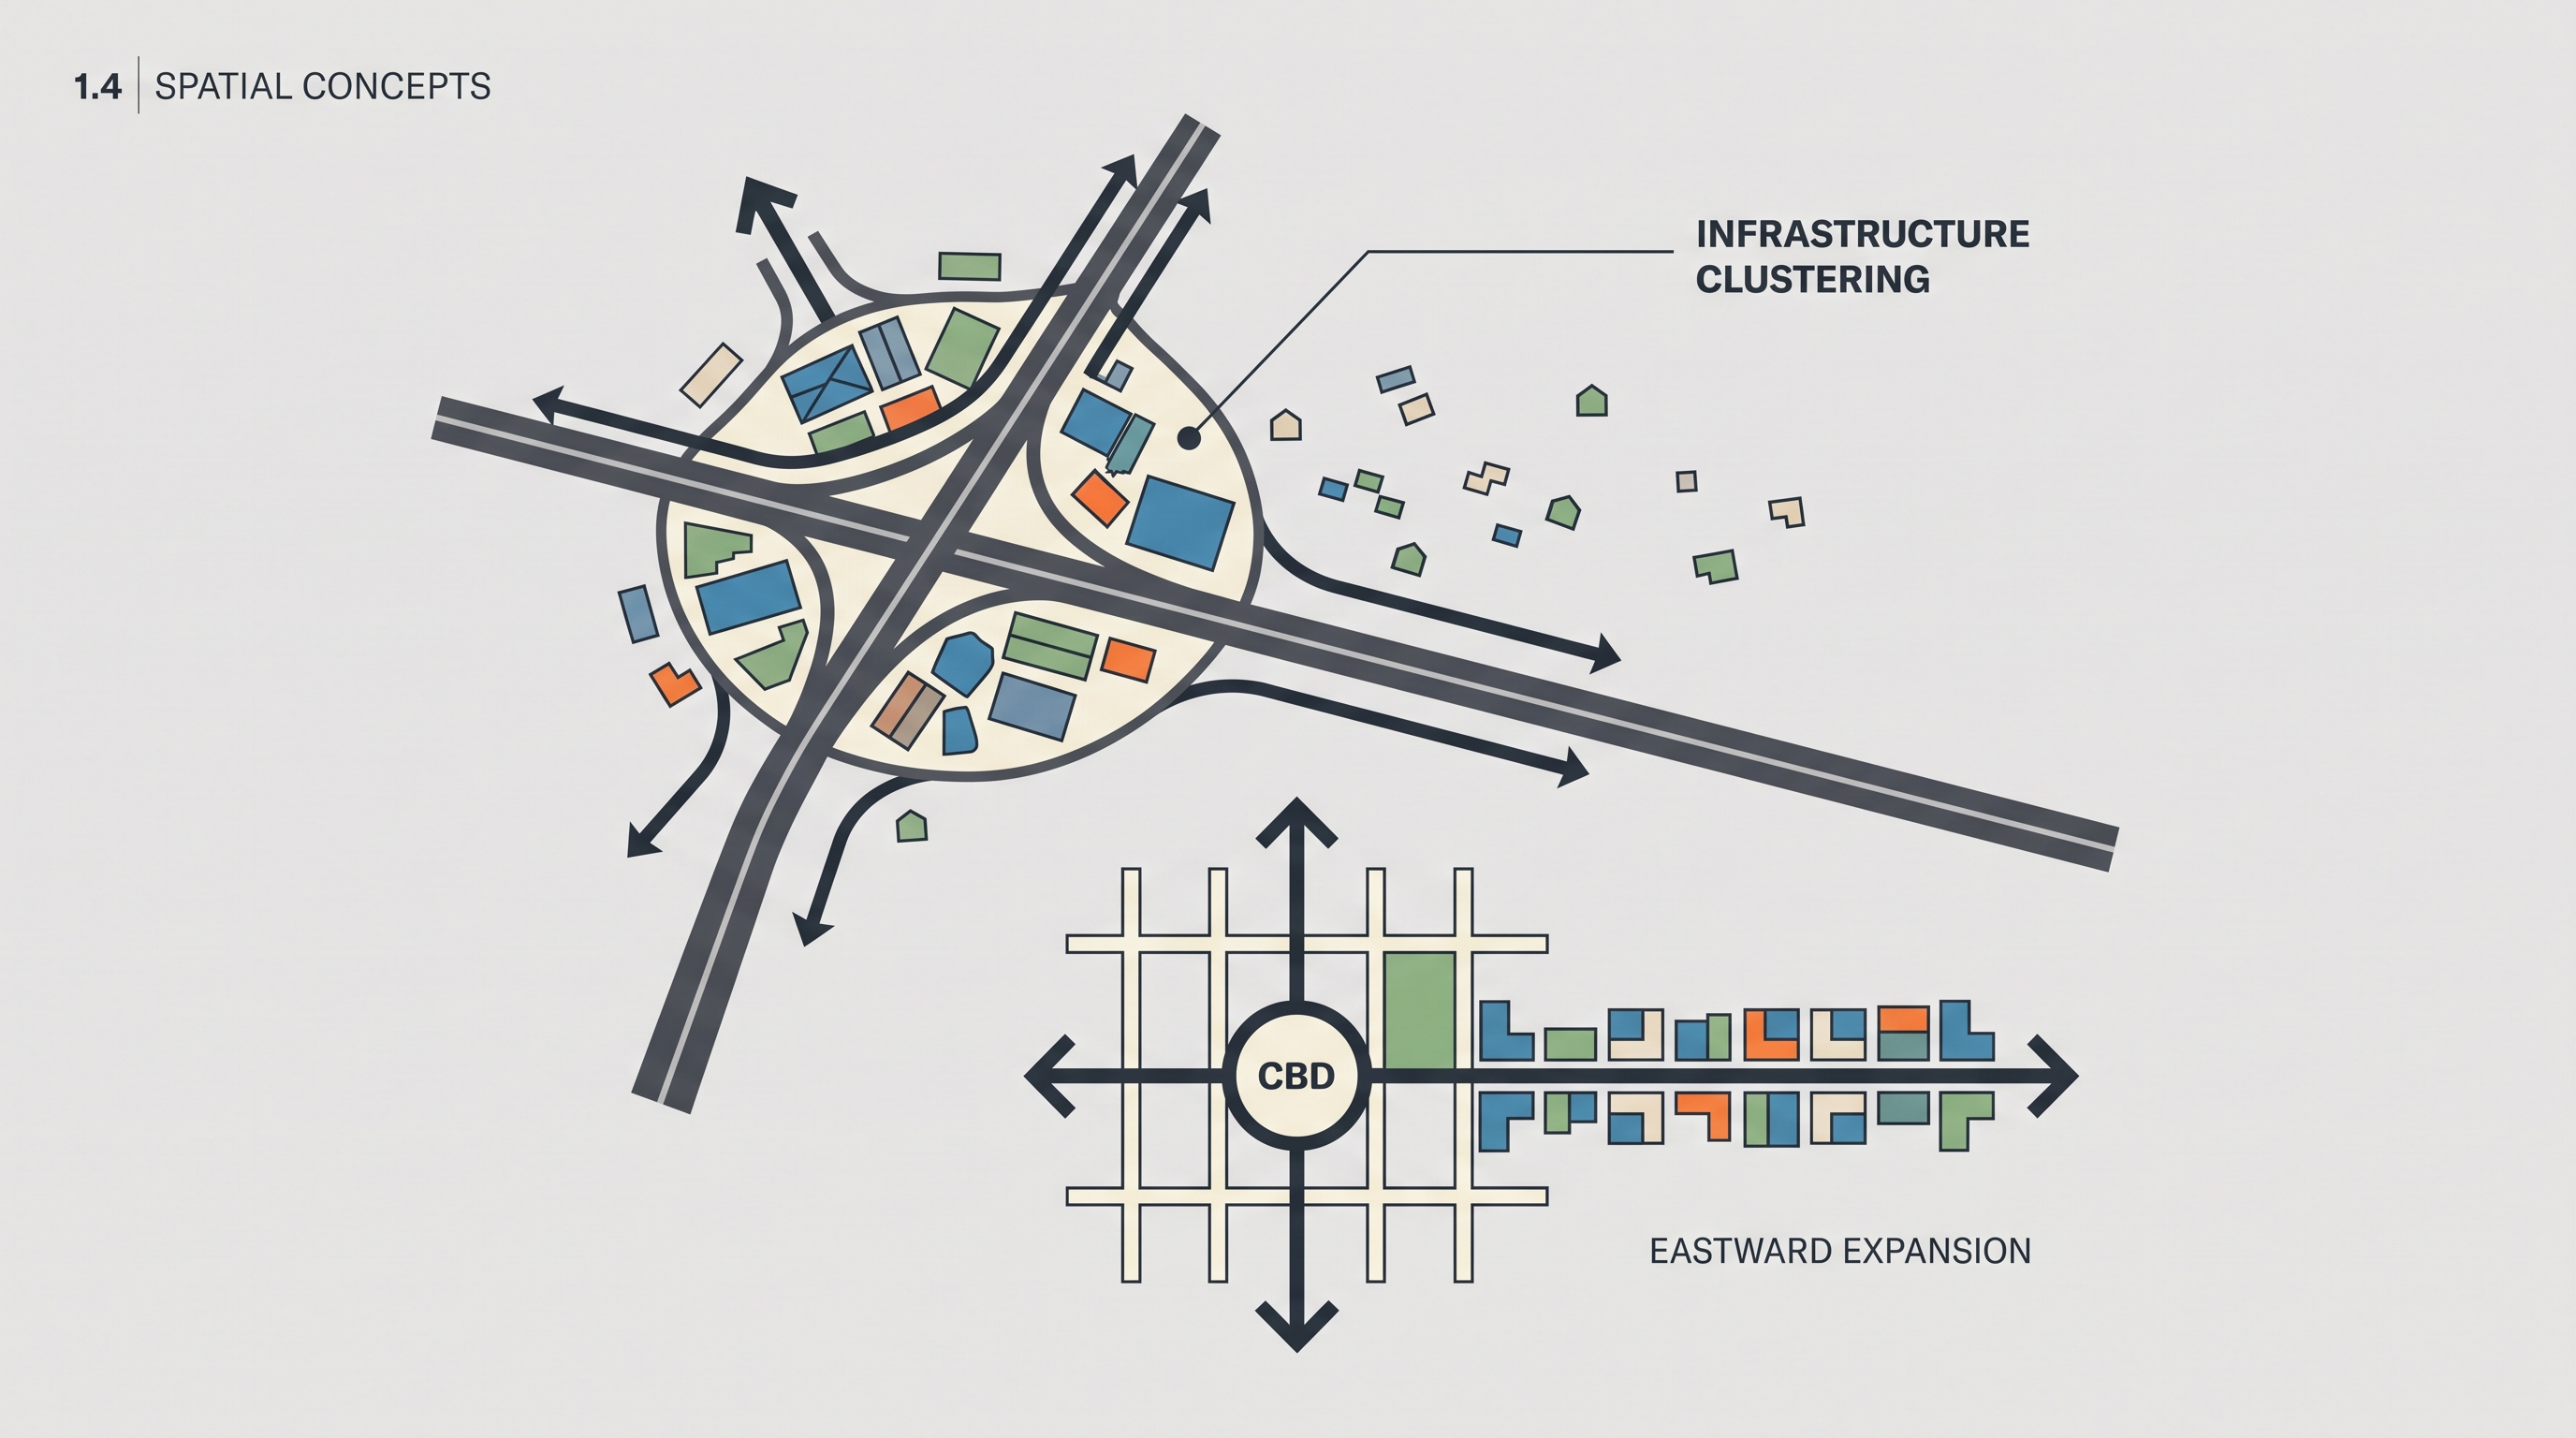
A spatial pattern is never random decoration on a map: it records where phenomena are located, how they are arranged, and what relationships connect them. A row of neighborhoods east of a central business district, farms clustered along a highway, or domesticated animals spreading from several early hearths can all be analyzed as spatial patterns.
From location to spatial relationship
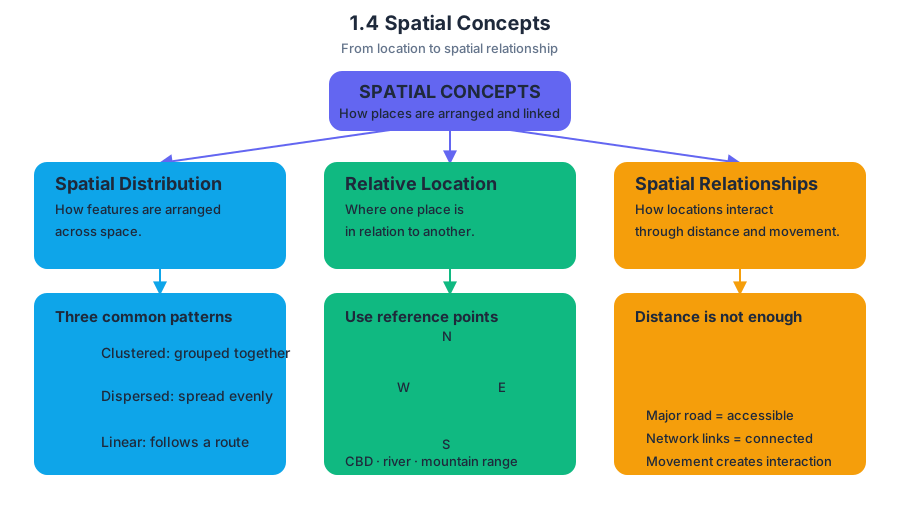
Spatial distribution describes how something is arranged across space. Geographers commonly describe a distribution as clustered, dispersed, or linear. Clustering occurs when features are concentrated near one another; dispersion occurs when they are spread relatively evenly; and a linear pattern follows a route or axis such as a river, road, coastline, or railway.
Relative location identifies where one place is in relation to another. Use cardinal directions—north, south, east, and west—along with recognizable reference points such as a central business district, river, or mountain range. “Neighborhoods east of the CBD and aligned along an east-west axis” is a stronger geographic description than “the neighborhoods are on the right side of the map.”
Spatial relationships explain how locations interact through distance, direction, accessibility, connectivity, and movement. Accessibility is the relative ease of reaching a place; connectivity is the degree to which places are linked by transportation or communication networks. A location beside a major road may be more accessible than an equally distant location connected only by a narrow local street.
Infrastructure, clustering, and agglomeration
Infrastructure does not merely occupy space—it reorganizes it. When a new road connects a rural settlement to a regional market, businesses, warehouses, housing, and services may gather near intersections or highway exits. This concentration is agglomeration: the clustering of related activities because proximity creates advantages such as shared labor, customers, suppliers, information, and transportation.
The same process can appear at several scales. Locally, shops may cluster along one road. Regionally, factories may concentrate around a connected metropolitan corridor. Globally, firms may agglomerate in cities with ports, airports, universities, and skilled labor. A common error is to treat clustering as proof that every feature has the same cause; a map shows the pattern, but explanation requires considering accessibility, historical development, land costs, and infrastructure.
Key distinction: Clustering describes where features are arranged. Agglomeration explains why related activities benefit from locating together.
Domestication as a spatial process
Domestication is the long-term process through which humans selectively breed and manage plants or animals for desired traits. Major early hearths of domestication arose in the Fertile Crescent, the Indus River Valley, Southeast Asia, and Central America. These hearths were not a single point of origin for all agriculture; different societies domesticated different species in different places.
The required learning objective SPS-5.A, “Identify major centers of domestication of plants and animals,” depends on SPS-5.A.1, which identifies the Fertile Crescent, Indus River Valley, Southeast Asia, and Central America as major hearth regions. The geographic question is therefore both what was domesticated and where that process began.
Domesticated species later diffused through migration, trade, conquest, and colonization. The Columbian Exchange moved plants, animals, people, and diseases between the Americas and Afro-Eurasia after 1492, while agricultural revolutions expanded the geographic reach and productivity of farming. This fulfills SPS-5.B, “Explain how plants and animals diffused globally,” supported by SPS-5.B.1, which identifies the Columbian Exchange and agricultural revolutions as major diffusion processes.
Pigs illustrate how diffusion creates a visible geographic pattern. Wild boar were domesticated in multiple parts of Eurasia, and domesticated pigs later moved with human populations and trade networks. On a production map, high pork production may form clusters where pigs are culturally accepted, economically valuable, and supported by feed, markets, and transportation; low production may appear where religious practices, environmental conditions, or food traditions discourage pig raising. The pattern is not explained by climate alone.
Reading patterns and explaining tensions
A map showing irrigated farms expanding along a river may reveal a linear agricultural pattern and increasing connectivity to markets. At the same time, the expansion can reduce the continuous land available for nomadic travel, producing spatially expressed tension between a settled farming distribution and a mobile pastoral distribution. The key analysis is the relationship between land uses, routes, and scale—not simply a claim that one group “caused” conflict.
Industrialization likewise produces uneven spatial distributions when roads, utilities, factories, and skilled labor concentrate in selected places. At the neighborhood scale, infrastructure can create corridors and clusters; at the regional scale, it can produce growth poles and connected urban networks. Scale analysis asks whether the same pattern persists, changes, or becomes more complicated when viewed locally, regionally, or globally.
AP skills in action
This topic most directly exercises Skill Category 1: Concepts and Processes—1.A Identify and define geographic concepts and processes, 1.B Describe geographic concepts, processes, models, and theories, and 1.C Explain geographic concepts, processes, models, and theories—when distinguishing diffusion, clustering, agglomeration, and domestication.
It also develops Skill Category 2: Spatial Relationships—2.A Describe spatial patterns, 2.B Explain spatial relationships, and 2.C Explain a spatial pattern using geographic concepts, processes, models, or theories—when interpreting directions, axes, roads, production clusters, and diffusion routes. Skill Category 4: Source Analysis, especially 4.A Identify information from geographic representations and 4.B Describe spatial patterns in geographic representations, applies when extracting evidence from maps. Finally, 5.B Scale Analysis: Explain spatial relationships across various geographic scales using geographic concepts, processes, models, or theories requires explaining how infrastructure or diffusion operates differently at neighborhood, regional, and global scales.
Misconception check
Misconception: “A cluster means the phenomenon is evenly distributed within that area.”
A cluster means concentration relative to surrounding space; it may still contain gaps and internal variation. Similarly, a linear pattern does not necessarily mean every feature lies in a perfect line—it means the arrangement follows a recognizable route or directional axis.
Retrieval check
A map shows markets and warehouses concentrated around highway intersections, while nearby homes are dispersed across the countryside. Identify one spatial pattern, explain how infrastructure produced it, and name the process that describes businesses benefiting from locating together. Then describe a second map showing neighborhoods east of a CBD along an east-west axis using both a cardinal direction and relative location.
Source Materials
- AP Human Geography Course and Exam Description
- AP Human Geography Course and Exam Description Clarifications and Corrections
- AP Human Geography Course Overview
- AP Human Geography Course at a Glance
- AP Human Geography Course at a Glance Poster
- AP Human Geography
- AP Human Geography
- AP Human Geography Sample Syllabus 1