From the free course AP Human Geography on Lykke
AP Practice 4
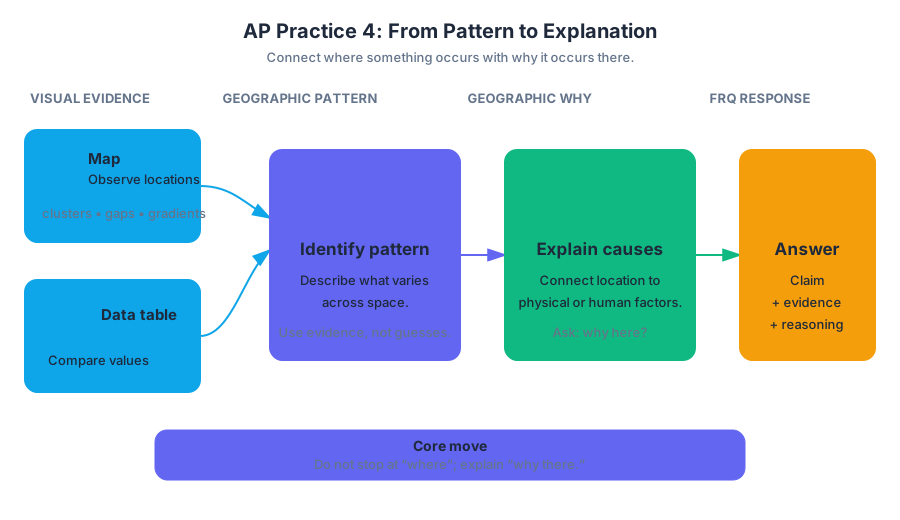
A geographic pattern becomes meaningful only when you connect where something occurs with why it occurs there. In this original, unofficial stimulus-based free-response question, a map and data table require you to move from visual evidence to geographic explanation.
AP Practice 4
A geographic pattern becomes meaningful only when you connect where something occurs with why it occurs there. In this original, unofficial stimulus-based free-response question, a map and data table require you to move from visual evidence to geographic explanation.
Practice target: stimulus-based FRQ
Allow approximately 15 minutes. Read the map and table before reading the parts. Mark two things: the spatial pattern shown by the map and the relationship suggested by the data. The strongest responses use evidence from the stimulus and then explain the geographic process behind that evidence.
Stimulus: Coastal solar-farm development in the fictional country of Lydora
Map 1. Solar-farm locations and annual precipitation
                         NORTH
      ┌─────────────────────────────────────────┐
      │  Highland interior                       │
      │        ▲ ▲ ▲                             │
      │     ●      ▲        ●                    │
      │                                           │
      │                 River basin               │
      │              ●        ●                  │
      │                                           │
      │  Coastal plain        ● ● ● ●             │
      │  Port city ★      ● ● ● ●                 │
      └─────────────────────────────────────────┘
      Legend: ● solar farm   ★ major port
      ▲ high-relief land
      Darker shading toward the coast indicates
      lower annual precipitation.
| Region | Annual precipitation in millimeters | Average distance to major transmission lines in kilometers | Solar farms |
|---|---|---|---|
| Highland interior | 1,180 | 74 | 2 |
| River basin | 760 | 39 | 4 |
| Coastal plain | 310 | 12 | 8 |
A. Identify the region with the greatest concentration of solar farms and describe the spatial pattern shown on Map 1.
B. Using Map 1 and the data table, explain one environmental factor that may encourage solar-farm development in the region identified in part A.
C. Using the data table, explain how infrastructure may influence the distribution of solar farms.
D. Explain one reason why the map pattern alone cannot establish that low precipitation caused the distribution of solar farms.
Worked reasoning
Part A: Identify and describe
The correct region is the coastal plain, which contains eight solar farms, the largest number in the table. A complete spatial description states more than “the farms are near the coast”: the farms are clustered on the low-precipitation coastal plain and become less numerous toward the wetter, higher-relief interior.
Scoring logic: Earn the identification point by naming the coastal plain. Earn the description point by explaining the concentration or gradient using the map, such as the coastal clustering and decreasing number of farms inland. Naming a region without describing its pattern is incomplete.
Part B: Connect location to environment
An environmental factor is the coastal plain’s relatively low precipitation: it receives $310$ millimeters annually, compared with $760$ millimeters in the river basin and $1{,}180$ millimeters in the highlands. Lower precipitation can mean fewer clouds and more consistently sunny conditions, which may increase the reliability of solar-energy generation.
Scoring logic: The response must identify an environmental factor and connect it to the location of solar farms. “The coast is dry” earns little by itself; “lower precipitation may produce more sunlight, supporting solar generation” supplies the required geographic explanation.
Part C: Analyze infrastructure
The coastal plain has the shortest average distance to major transmission lines, only $12$ kilometers, while the river basin averages $39$ kilometers and the highlands $74$ kilometers. Because electricity must be transported from a generating site to consumers, developers may prefer locations close to existing transmission infrastructure: shorter connections generally reduce construction costs and energy loss.
Scoring logic: This earns the point because it uses quantitative evidence and explains a mechanism. The answer does not merely repeat that the coastal plain is “closest”; it explains why proximity to transmission lines can affect site selection.
Part D: Avoid a causation error
The pattern shows an association, not definite causation. Other factors could also influence the distribution, including land prices, government incentives, available land, proximity to the port, or local zoning rules. In addition, the table compares only three broad regions, so it cannot isolate precipitation from these other variables.
Scoring logic: A strong answer distinguishes correlation—two patterns occurring together—from causation, in which one factor produces a change in another. This response also identifies a plausible confounding factor or limitation of the data.
Skills being assessed
- Skill 2: Spatial Relationships — interpreting the clustering, gradient, and regional distribution shown on the map.
- Skill 3: Data Analysis — comparing precipitation, infrastructure distance, and solar-farm counts.
- Skill 4: Source Analysis — extracting geographic evidence from a map as a visual source.
- Skill 5: Scale Analysis — recognizing that broad regional averages may conceal differences among individual sites.
Timing and error review
Use about 2 minutes to inspect the stimulus, 10 minutes to answer, and 3 minutes to review. During review, underline every numerical or mapped piece of evidence. Then ask: Did I identify the pattern? Did I explain a process? Did I use the stimulus rather than rely on outside knowledge?
Common errors include describing the map without explaining it, giving a cause without stimulus evidence, and treating a regional association as proof of causation. If an answer says only “solar farms are near transmission lines,” revise it to include the distance comparison and the mechanism connecting infrastructure to development.

Source Materials
- AP Human Geography Course and Exam Description
- AP Human Geography Course and Exam Description Clarifications and Corrections
- AP Human Geography Course Overview
- AP Human Geography Course at a Glance
- AP Human Geography Course at a Glance Poster
- AP Human Geography
- AP Human Geography
- AP Human Geography Sample Syllabus 1
- AP Human Geography-AP Students-College board
- AP Human Geography Units: Complete Breakdown
- AP Human Geography-National Council for Geographic Foundation
- Free AP Human Geography Resources for 2026-Knowt