From the free course AP Human Geography on Lykke
2.5 The Demographic Transition Model
Key concepts: Demographic Transition Model (DTM) · Population change over time · Epidemiological transition · Fertility rates · Mortality rates · Migration rates · Crude birth rate · Crude death rate · Rate of natural increase · Population pyramids
A country can move from rapid population growth to population decline even when people live much longer. The Demographic Transition Model (DTM) explains this historical change by tracking how fertility rates and mortality rates change as environmental, economic, cultural, and political conditions change.
2.5 The Demographic Transition Model
A country can move from rapid population growth to population decline even when people live much longer. The Demographic Transition Model (DTM) explains this historical change by tracking how fertility rates and mortality rates change as environmental, economic, cultural, and political conditions change.
IMP-2.B.1 — The demographic transition model can be used to explain population change over time.
The population-accounting foundation
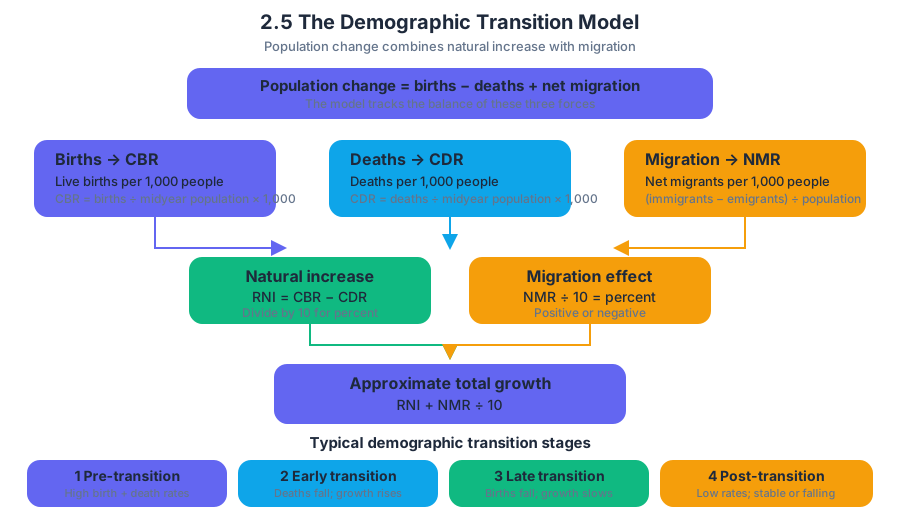
Population change depends on three components: births, deaths, and migration. A useful accounting relationship is
$$ \text{Population change} = \text{births} - \text{deaths} + \text{net migration}. $$
The crude birth rate (CBR) is the number of live births per $1{,}000$ people per year:
$$ \text{CBR}=\frac{\text{number of live births in one year}}{\text{midyear population}}\times 1{,}000. $$
$$ \text{CDR}=\frac{\text{number of deaths in one year}}{\text{midyear population}}\times 1{,}000. $$
The rate of natural increase (RNI) measures population growth from births and deaths alone, excluding migration:
$$ \text{RNI}=\text{CBR}-\text{CDR}. $$
Because CBR and CDR are usually expressed per $1{,}000$, divide by $10$ to express RNI as a percentage. For example, if a country has a CBR of $28$ and a CDR of $8$, its RNI is $20$ per $1{,}000$, or $2.0%$.
Migration rates must also be expressed relative to population size. The net migration rate (NMR) is net migration per $1{,}000$ people:
$$ \text{NMR}=\frac{\text{immigrants}-\text{emigrants}}{\text{midyear population}}\times 1{,}000. $$
Thus, approximate total population change in percentage terms is
$$ \text{Total growth rate} \approx \text{RNI}+\frac{\text{NMR}}{10}. $$
A country with an RNI of $-0.4%$ and an NMR of $+6$ per $1{,}000$ has an approximate total growth rate of $+0.2%$. Natural decrease is being offset by immigration.
Reading the DTM as a sequence
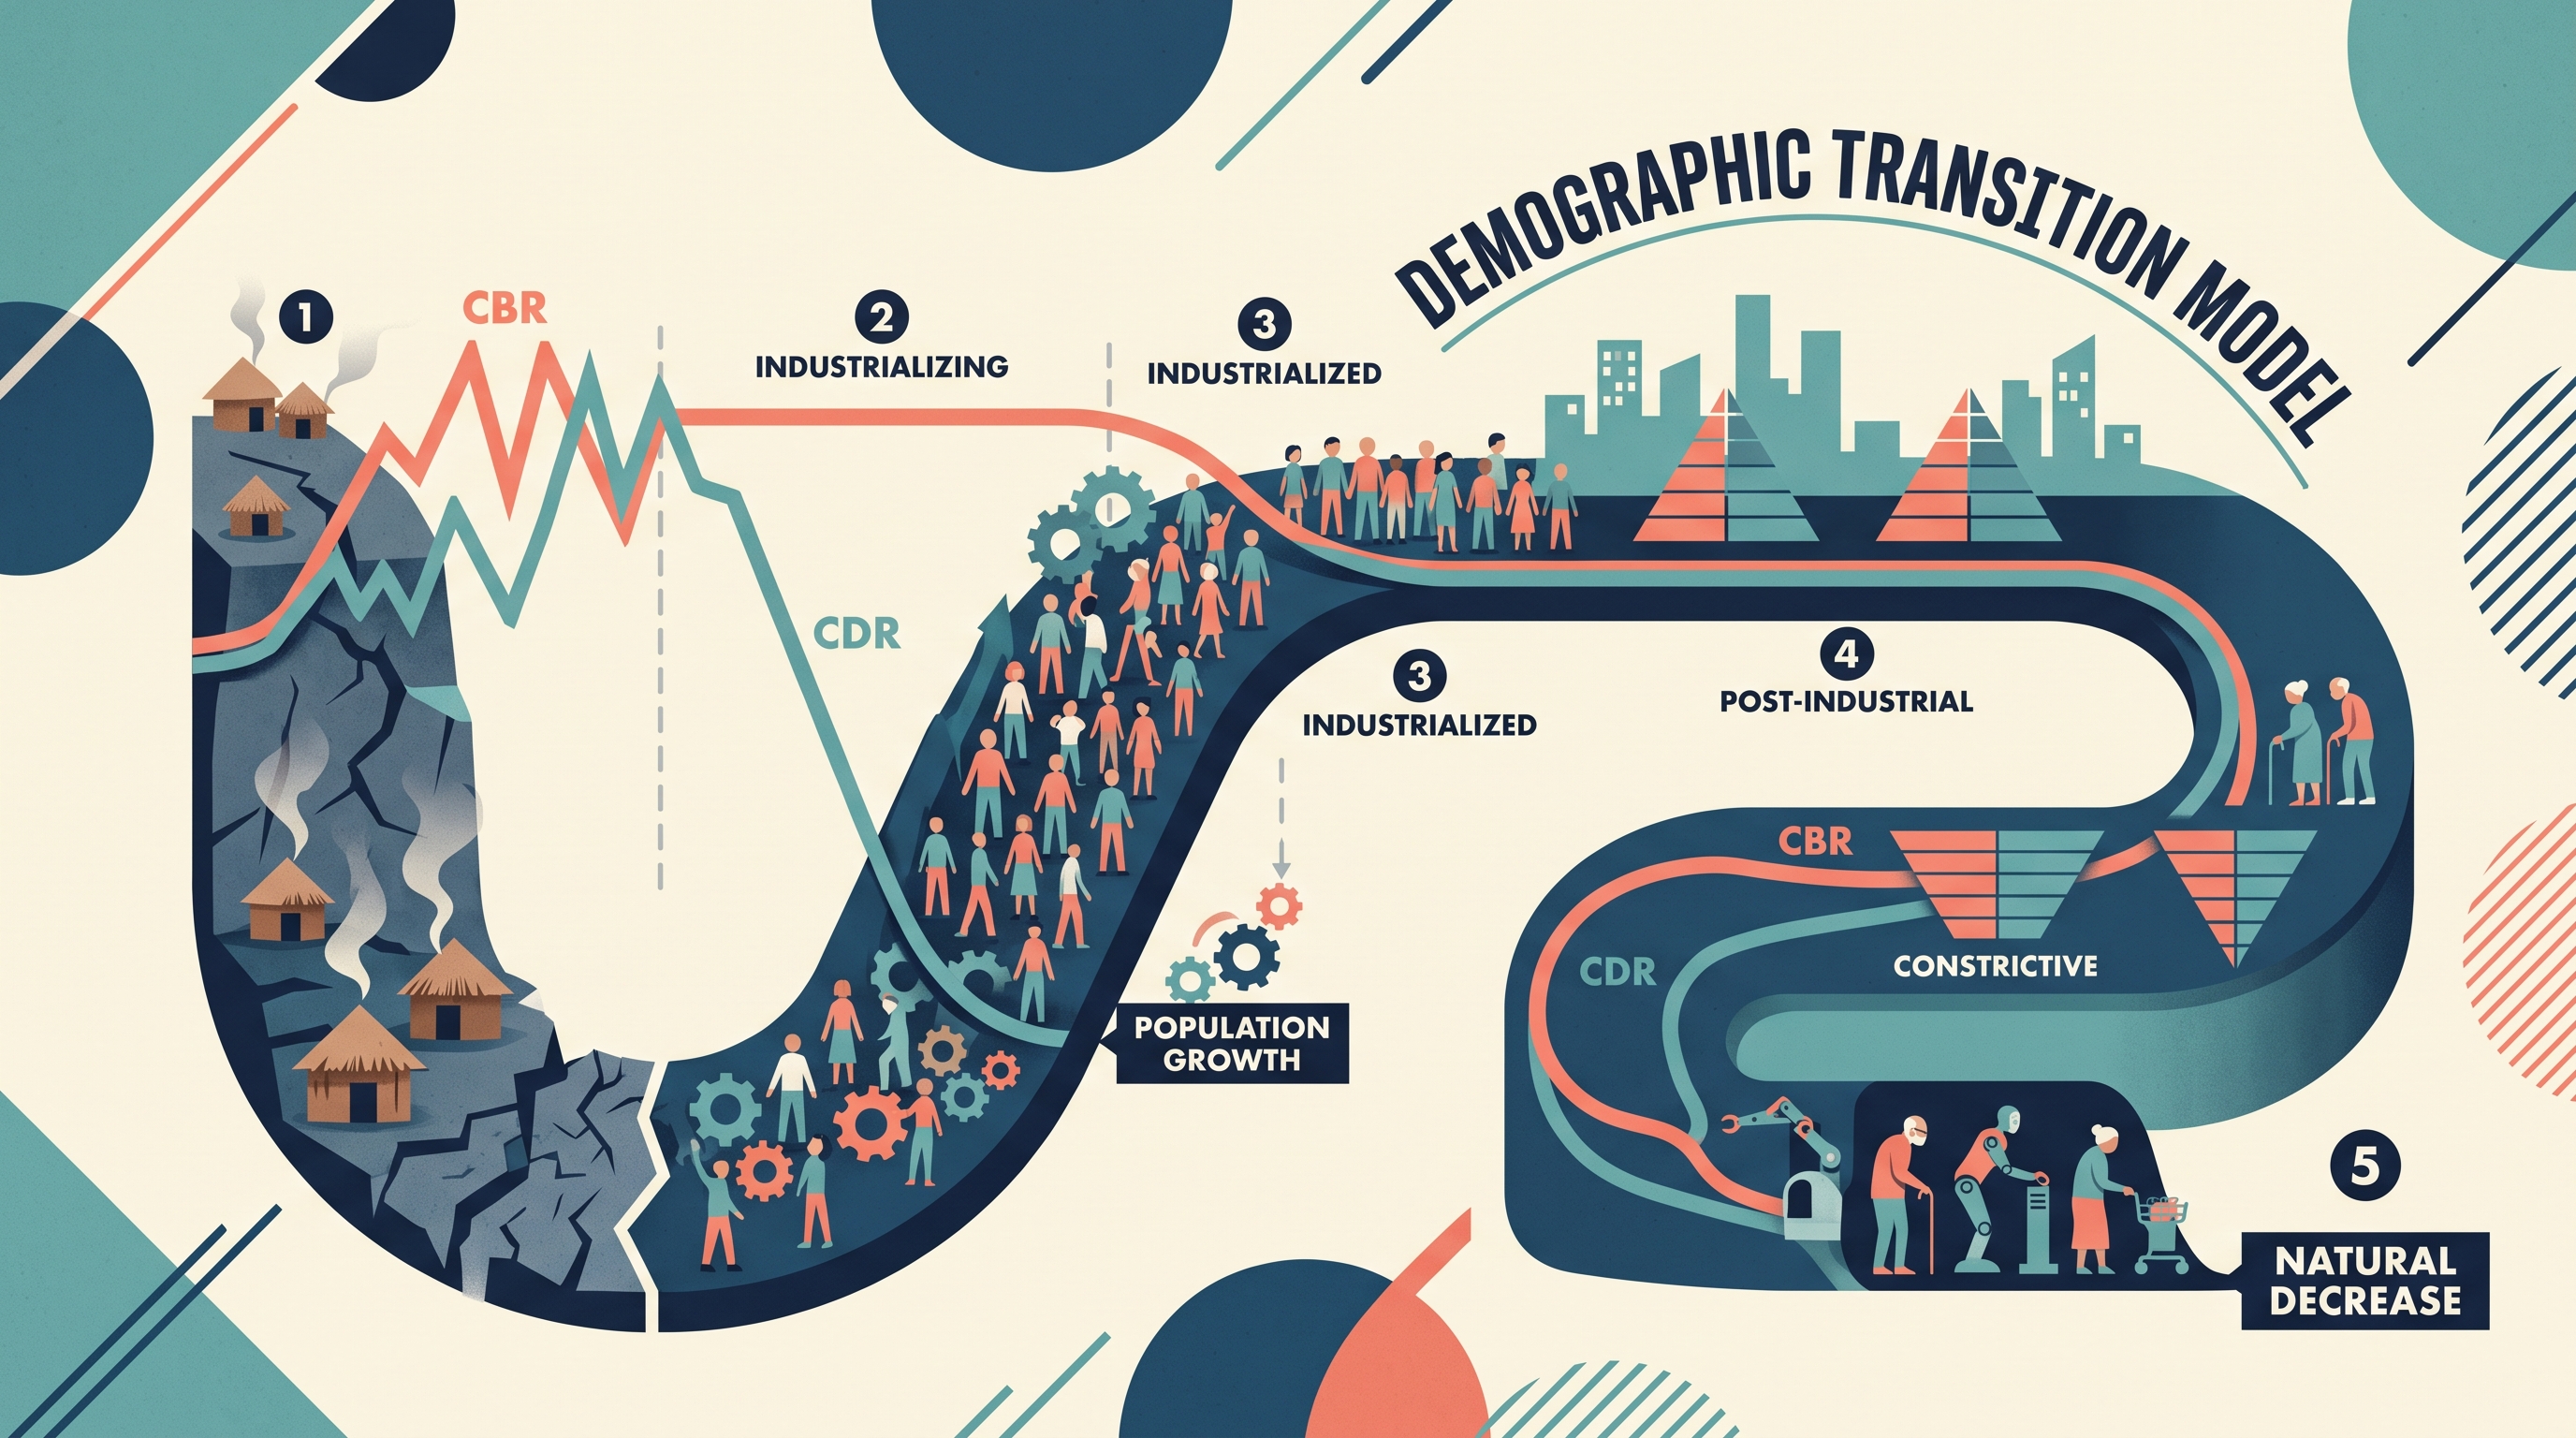
The DTM is a model, not a universal law. Its stages describe a common pattern:
| Stage | Birth rates | Death rates | Overall population pattern |
|---|---|---|---|
| 1 | High | High and fluctuating | Slow growth |
| 2 | Remain high | Fall rapidly | Rapid growth |
| 3 | Fall substantially | Low | Growth slows |
| 4 | Low | Low | Stable or very slow growth |
| 5, in some versions | Very low | Low or rising slightly | Natural decrease |
In Stage 1, limited sanitation, medical care, and food security produce high mortality, while families often have many children. In Stage 2, mortality falls first because of cleaner water, improved sanitation, better nutrition, disease control, and medical advances. Fertility may remain high because cultural expectations, limited access to contraception, agricultural labor needs, and uncertainty about child survival persist.
In Stage 3, urbanization, education, contraception, rising household costs, and expanded employment opportunities—especially for women—contribute to declining fertility. Stage 4 combines low fertility with low mortality; Stage 5 describes countries where fertility remains below replacement level and deaths exceed births.
IMP-2.B.2 — The epidemiological transition explains causes of changing death rates.
Why death rates change: the epidemiological transition
The epidemiological transition describes the shift from deaths caused mainly by infectious diseases, famine, and poor sanitation toward deaths caused mainly by chronic and degenerative diseases such as heart disease and cancer. Mortality therefore falls sharply when public health improves, even before a society becomes highly industrialized.
Later, mortality may remain low but increase at older ages because a larger share of the population survives into late adulthood. This does not mean health has suddenly worsened; it can reflect population aging and the fact that chronic diseases become more common when infectious diseases no longer dominate.
Fertility is not the same as the birth rate
A fertility rate measures childbearing behavior more directly than a crude birth rate. The total fertility rate (TFR) is the average number of children a woman is expected to have over her lifetime, based on current age-specific fertility rates.
CBR describes births relative to the entire population, while TFR describes the average births associated with women of reproductive age. A country with many elderly people may have a low CBR partly because a smaller share of its population is in childbearing ages, even if its TFR is not extremely low. As TFR declines, smaller younger cohorts eventually enter reproductive ages, reinforcing later-stage population aging and possible decline.
Population pyramids: a snapshot of the model
A population pyramid displays age-sex structure: males are usually shown on the left, females on the right, and younger ages at the bottom. Its shape provides a visual clue about demographic conditions.
- A broad triangular base suggests high fertility and a large child population, commonly associated with Stage 2.
- A more column-shaped pyramid suggests low fertility and low mortality, associated with Stage 4.
- A narrow base with a wider middle or upper section suggests very low fertility, aging, and possible natural decrease, as seen in contemporary Japan.
- Uneven bulges may reveal migration, war, disease, or a baby boom rather than a normal DTM stage.
Misconception check — “A pyramid predicts population growth by itself.” It does not. A young population may create population momentum because many people will soon enter childbearing ages, but migration policy, fertility behavior, mortality, and economic conditions can alter the outcome.
Applying the model geographically
To analyze a map or dataset, identify the spatial pattern first, then connect it to a demographic process. Regions with youthful pyramids and high RNI may reflect lower incomes, limited contraception, or rural labor systems; regions with aging pyramids may reflect urbanization, delayed marriage, high education costs, or sustained low TFR. Political policies—such as pronatalist programs or immigration rules—and environmental pressures can modify any expected trajectory.
Worked interpretation: Japan’s constrictive pyramid, low fertility, and aging population indicate late-stage transition and natural decrease. Immigration can reduce the speed of total decline, but it does not automatically reverse low fertility or aging because NMR affects total population directly while RNI captures only births minus deaths.
AP skills: 1.B — Explain geographic concepts, processes, models, and theories by linking each DTM stage to changing CBR, CDR, and RNI. 3.B — Describe spatial patterns presented in maps and in quantitative and geospatial data by identifying pyramid shapes, regional clusters, and trends. 3.C — Explain patterns and trends in maps and in quantitative and geospatial data by connecting those patterns to environmental, economic, cultural, and political factors.
Retrieval check: A country has CBR $9$, CDR $12$, and NMR $+8$ per $1{,}000$. What are its RNI and approximate total growth rate?
Answer: RNI is $-3$ per $1{,}000$, or $-0.3%$. Adding NMR’s $+0.8%$ gives approximately $+0.5%$ total growth.
Source Materials
- AP Human Geography Course and Exam Description
- AP Human Geography Course and Exam Description Clarifications and Corrections
- AP Human Geography Course Overview
- AP Human Geography Course at a Glance
- AP Human Geography Course at a Glance Poster
- AP Human Geography
- AP Human Geography
- AP Human Geography Sample Syllabus 1