From the free course AP Human Geography on Lykke
1.2 Geographic Data
Key concepts: Geographic data · Maps · Quantitative data · Geospatial data · Map-based identification · Spatial analysis · Language patterns · Cultural traits · Food preferences as cultural traits · Ethnic neighborhood clustering
Geographic data are information organized around locations, allowing geographers to ask not only what is happening, but also where, how much, and in what spatial pattern.
1.2 Geographic Data
Geographic data are information organized around locations, allowing geographers to ask not only what is happening, but also where, how much, and in what spatial pattern. A county map showing household language, a table reporting percentages, and a GIS layer locating neighborhoods are different presentations of geographic data.
Three forms of geographic data
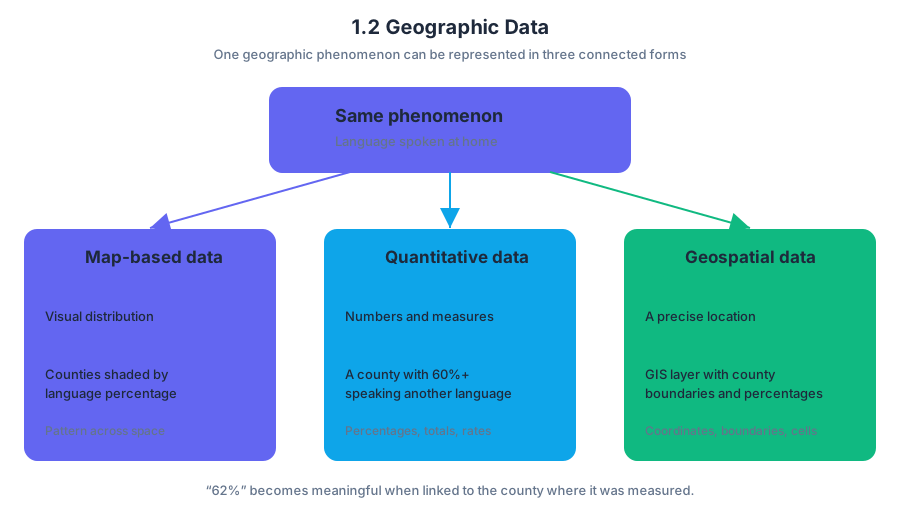
The same geographic phenomenon can appear in three closely connected forms:
| Form | What it shows | Example |
|---|---|---|
| Map-based data | A visual distribution across space | Counties shaded by the percentage of residents who speak a language other than English at home |
| Quantitative data | Numerical measurements or counts | A county in which $60%$ or more of residents speak another language at home |
| Geospatial data | Information linked to precise geographic coordinates or spatial features | A GIS layer containing county boundaries and language-use percentages |
Quantitative data use numbers: percentages, totals, rates, averages, or rankings. Geospatial data add a location component, such as coordinates, boundaries, routes, or raster cells. A number becomes more geographically useful when it can be connected to a place—for example, “$62%$” becomes meaningful when the geospatial record identifies the county where that percentage was measured.
Reading a map as data—not decoration
Map interpretation often begins with map-based identification, the act of locating a particular point, county, region, or category shown in a map. Before making an inference, read the title, legend, geographic scale, and classification ranges. On a choropleth map, darker shading usually indicates a larger value, but the legend—not the shade alone—determines the exact meaning.
The language map classifies counties according to the percentage of people age five and older who spoke a language other than English at home. Its darkest category represents $60.0%$ or more, while progressively lighter categories represent $35.0$–$59.9%$, $17.9$–$34.9%$, $4.6$–$17.8%$, and $4.5%$ or less.
Worked example: identifying a cultural pattern
Question 11 asks which languages are most likely spoken in counties where at least $60%$ of residents speak a language other than English at home. The options include French and French Creole; Spanish and American Indian; German and Dutch; Russian and Hindi; and Chinese and Arabic.
Step 1: Identify the relevant map category. Select the black counties, because the legend defines black as $60.0%$ or more.
Step 2: Locate the strongest clusters. Major concentrations appear along the southern border and in parts of the Southwest, including the Four Corners region.
Step 3: Connect location to geographic knowledge. Counties along the southern border are strongly associated with Spanish-speaking populations because of proximity to Mexico and longstanding cultural ties. Concentrated areas in the Four Corners region include major Indigenous communities, such as the Navajo Nation, where American Indian languages are spoken.
Step 4: Select the best-supported conclusion. The answer is (B) Spanish and American Indian languages.
From identification to spatial analysis
Spatial analysis examines how geographic phenomena are arranged. Instead of merely naming a location, it describes patterns such as clustering—features concentrated near one another—or orientation—a distribution organized along a particular direction, border, coast, river, or transportation corridor.
For example, “the darkest counties are in the Southwest” is a location statement. “The darkest counties form clusters along the southern border and around the Four Corners region” is spatial analysis because it identifies concentration, relative location, and regional orientation.
Geographic data can reveal culture
A culture trait is a characteristic associated with a cultural group. PSO-3.A.2: Culture traits include such things as food preferences. Foods may have distinctive ingredients or methods of preparation, and beliefs may identify certain foods as permitted or forbidden. Consequently, food preferences can be mapped as evidence of cultural patterns, just as language, religion, architecture, or clothing can.
For instance, a regional food pattern may reflect local ingredients, historical migration, a specific cultural tradition, or religious rules about preparation and consumption. The geographic distribution of the food is therefore not random: it may show cultural diffusion, persistence, or connection to a particular region.
Skills and misconceptions
This topic develops Skill 1.B: Explain geographic concepts, processes, models, and theories when connecting a mapped pattern to concepts such as culture traits. It also develops Skill 3.C: Explain patterns and trends in maps and in quantitative and geospatial data to draw conclusions, especially when moving from a map’s visual evidence to a defensible geographic inference.
Misconception check: The darkest county is not automatically the county with the largest population of non-English speakers. Choropleth shading shows a percentage category, not necessarily a total number of people. A sparsely populated county could have a high percentage while containing fewer speakers overall than a densely populated county with a lower percentage.
Retrieval check
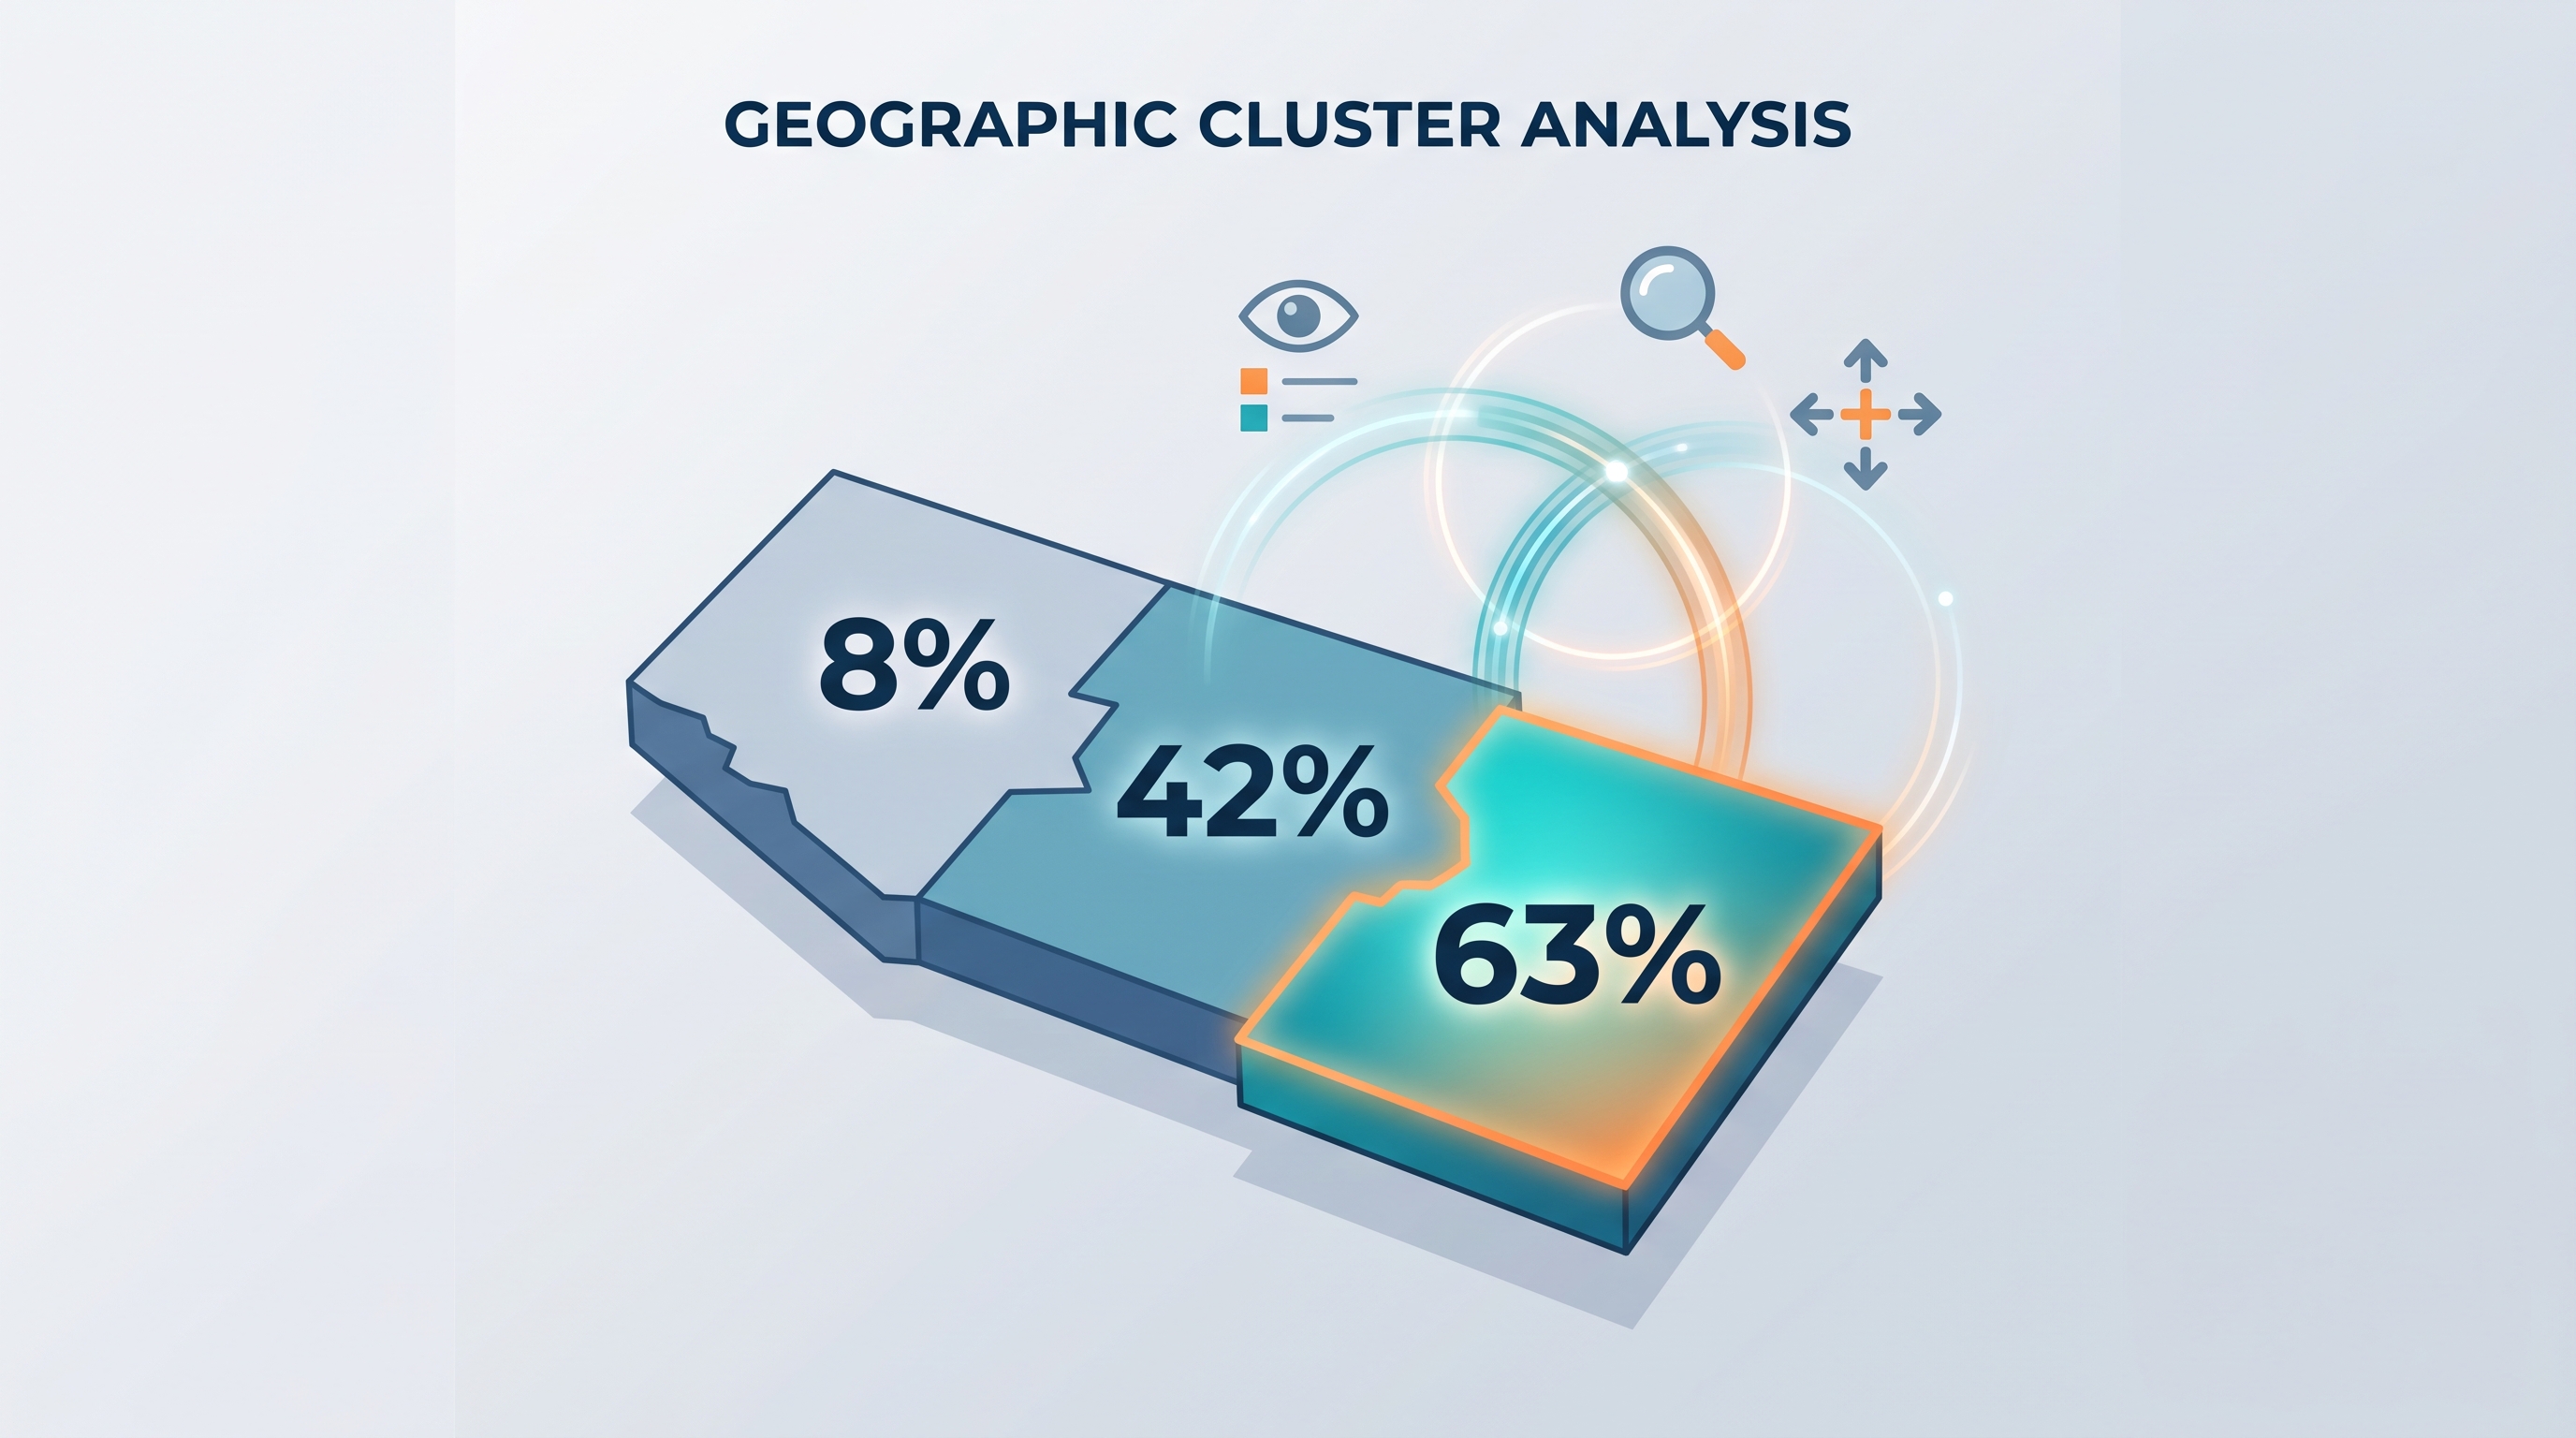
A map shows three neighboring counties with values of $8%$, $42%$, and $63%$. Which county belongs to the highest category on the language map, and what additional evidence would you use before claiming that the counties form a meaningful spatial cluster? The correct reasoning identifies the $63%$ county, then checks adjacency, scale, the legend, and whether the pattern persists across surrounding counties.
Source Materials
- AP Human Geography Course and Exam Description
- AP Human Geography Course and Exam Description Clarifications and Corrections
- AP Human Geography Course Overview
- AP Human Geography Course at a Glance
- AP Human Geography Course at a Glance Poster
- AP Human Geography
- AP Human Geography
- AP Human Geography Sample Syllabus 1