From the free course AP Human Geography on Lykke
2.3 Population Composition
Key concepts: Population composition · Population pyramids · Using population pyramids to predict future population needs · Data analysis of population information
A country’s population is not just a total count: its population composition—the characteristics of the people who live there—reveals what services it needs now and what pressures it may face later.
2.3 Population Composition
A country’s population is not just a total count: its population composition—the characteristics of the people who live there—reveals what services it needs now and what pressures it may face later. Two countries with the same population size can require entirely different schools, hospitals, housing, and labor policies if one is mostly young and the other is mostly elderly.
Population composition is the structure of a population according to characteristics such as age, sex, race, ethnicity, and other demographic traits. Age and sex are especially important because they strongly influence births, deaths, employment, health care demand, and dependency.
The official learning objective PSO-2.E: Explain the effects of population composition on a society connects demographic structure to social and economic consequences. The essential knowledge identifiers are PSO-2.E.1, which concerns the characteristics used to describe population composition; PSO-2.E.2, which concerns population pyramids as visual representations of composition; and PSO-2.E.3, which concerns using population pyramids to predict future population needs.
Reading a population pyramid
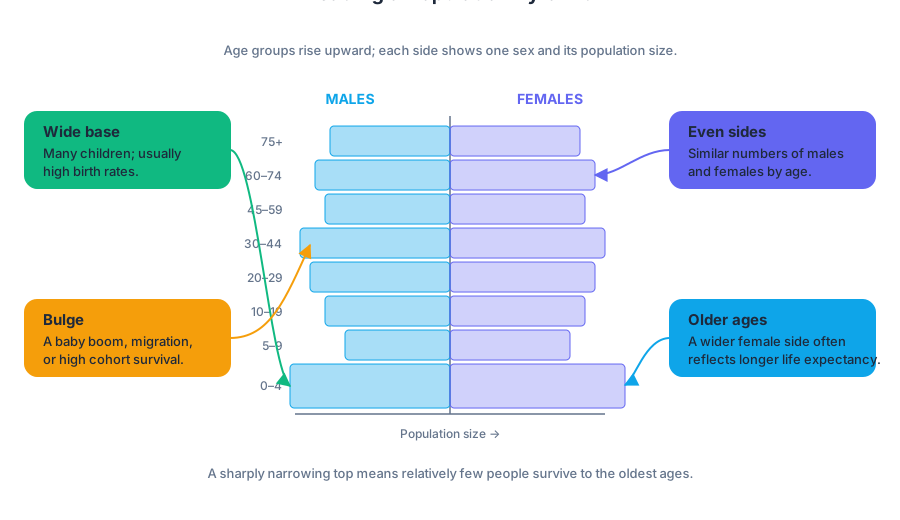
A population pyramid is a bar graph that displays a population by age and sex. Age groups are arranged vertically, usually from youngest at the bottom to oldest at the top. One sex is shown on the left and the other on the right, allowing the graph to show both the number and proportion of people in each age-sex cohort.
The pyramid’s shape is meaningful:
- A wide base indicates many children and usually reflects high birth rates.
- A narrow base indicates fewer recent births and usually reflects low fertility.
- A relatively even-sided shape suggests similar numbers of males and females at many ages.
- A wider female side among older groups often reflects women’s longer average life expectancy.
- A bulge in one age group may represent a baby boom, a migration wave, or unusually high survival for that cohort.
- A sharply narrowing top indicates that relatively few people survive into the oldest age groups.
A pyramid does not merely show “how many people live in a country.” It shows when those people were born and how the population is divided among age groups and sexes. That structure affects the balance between people likely to work and people more likely to depend on others for support.
From shape to future needs
A population pyramid can be used as demographic data to make a conditional prediction: if the current age structure and fertility pattern continue, what services and resources will become more important? The prediction should identify a visible pattern, connect it to a demographic process, and name the resulting need.
Worked example: a rapidly growing population
Imagine Country A has a very broad base: its cohorts ages $0$–$4$, $5$–$9$, and $10$–$14$ are much larger than its older cohorts. This pattern indicates many children and likely high birth rates. As these large cohorts move into school age, Country A will need more classrooms, teachers, child-care facilities, and children’s products.
The reasoning chain is:
$$ \text{wide base} \rightarrow \text{many young people} \rightarrow \text{more school-age children} \rightarrow \text{greater future demand for schools and child care} $$
The same population may later create a large labor force when those children reach working age. However, the pyramid alone does not prove that the economy will create enough jobs; it supports a prediction about demographic pressure, not a complete prediction about economic success.
Worked example: an aging population
Country B has a narrow base and a relatively large share of adults in older age groups. This shape indicates low fertility and an aging population. In the future, Country B may need expanded elderly medical care, specialized housing, accessible transportation, and products designed for senior citizens.
$$ \text{narrow base} \rightarrow \text{fewer future workers and children} \rightarrow \text{larger relative older population} \rightarrow \text{greater demand for elder care and health services} $$
A country with both low birth rates and many older adults may also face labor shortages. One possible response is increased immigration, although the pyramid itself shows the demographic pressure rather than determining the policy response.
Data-analysis skills
Population pyramids require Skill 3.E (Data Analysis): use data visualization to identify what the evidence shows and support a precise inference. A strong response does not say only “the country is old” or “the country is growing.” It identifies the relevant part of the pyramid and explains its consequence.
They may also require Skill 2.A (Spatial Relationships): Describe spatial patterns, when comparing age-sex structures among countries or regions, and Skill 5.C (Scale Analysis), when explaining how population composition differs between scales such as a country, county, or urban area. For example, an urban area may have a different life-expectancy pattern from an entire county because access to food, health care, sanitation, and social services varies by scale.
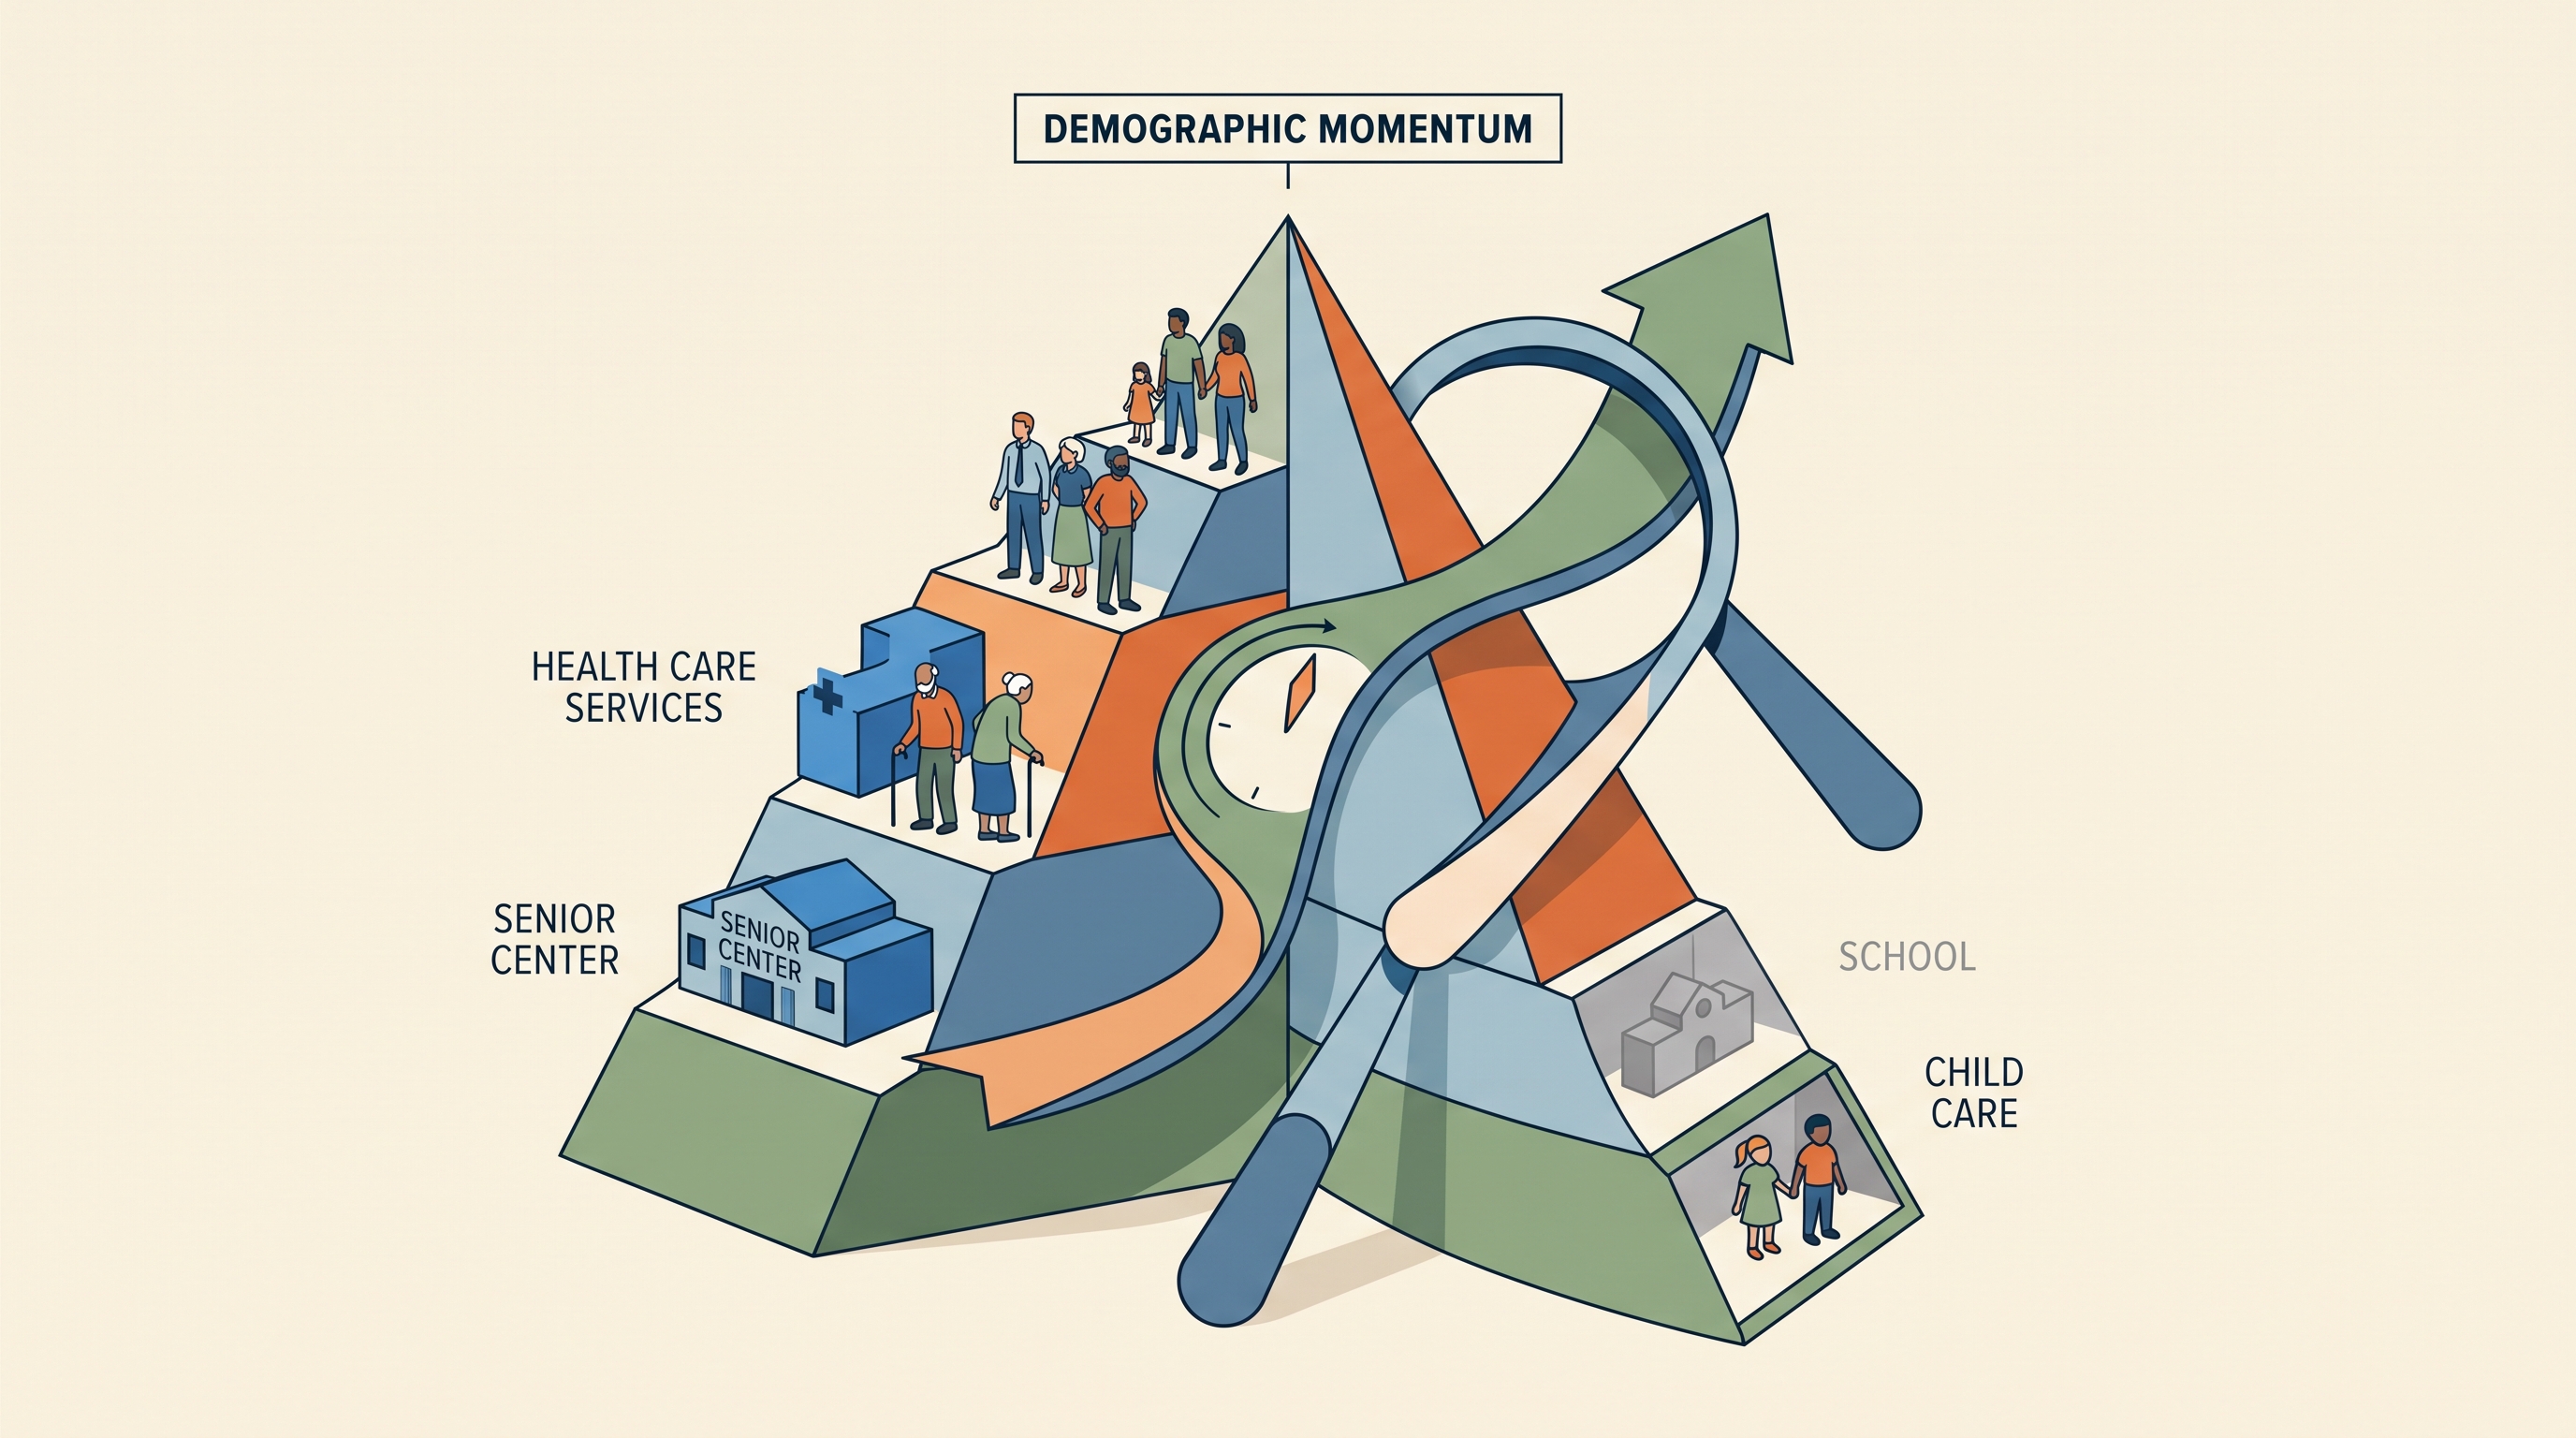
Common misconception — “A population pyramid predicts the future with certainty.” It does not. Fertility, mortality, migration, policies, conflict, disease, and economic conditions can change. The accurate claim is that the pyramid reveals demographic momentum and helps forecast likely needs if major conditions remain similar.
Retrieval check: A country’s pyramid has a narrow base, a large middle-aged population, and a widening female advantage among older adults. What two future needs are most defensible? Answer: fewer new schools and child-care facilities because birth rates are low, and more health care or elder-care services because the population is aging. Explain each prediction by pointing to the pyramid feature that supports it.
Source Materials
- AP Human Geography Course and Exam Description
- AP Human Geography Course and Exam Description Clarifications and Corrections
- AP Human Geography Course Overview
- AP Human Geography Course at a Glance
- AP Human Geography Course at a Glance Poster
- AP Human Geography
- AP Human Geography
- AP Human Geography Sample Syllabus 1