From the free course AP Human Geography on Lykke
1.7 Regional Analysis
Key concepts: Regional analysis · Types of boundaries · Site characteristics · Spatial distribution of political power · Ethnic residential patterns · Regional scale and map limitations · Territoriality and devolution · Climate-based crop specialization and regional interdependence · Spatial concentration of economic activities · Linear and regional concentration
A region is an area grouped together because its places share a characteristic, function, or perceived identity. Regional analysis turns a complicated map into a meaningful pattern: instead of asking only where is something?, geographers ask which places belong together, why, and at what scale does that grouping…
1.7 Regional Analysis
A region is an area grouped together because its places share a characteristic, function, or perceived identity. Regional analysis turns a complicated map into a meaningful pattern: instead of asking only where is something?, geographers ask which places belong together, why, and at what scale does that grouping make sense?
CED alignment: Topic 1.7 Regional Analysis; Learning Objective 1.7; Essential Knowledge 1.7.A, 1.7.A.1, 1.7.A.2, and 1.7.A.3. The topic develops Skill Category 1: Concepts and Processes (1.A Identify geographic concepts, 1.B Explain geographic concepts), Skill Category 2: Spatial Relationships (2.A Describe spatial patterns, 2.B Explain spatial relationships), and Skill Category 5: Scale Analysis (5.A Identify the scales of analysis, 5.B Explain how scale of analysis affects geographic information).
What makes a region?
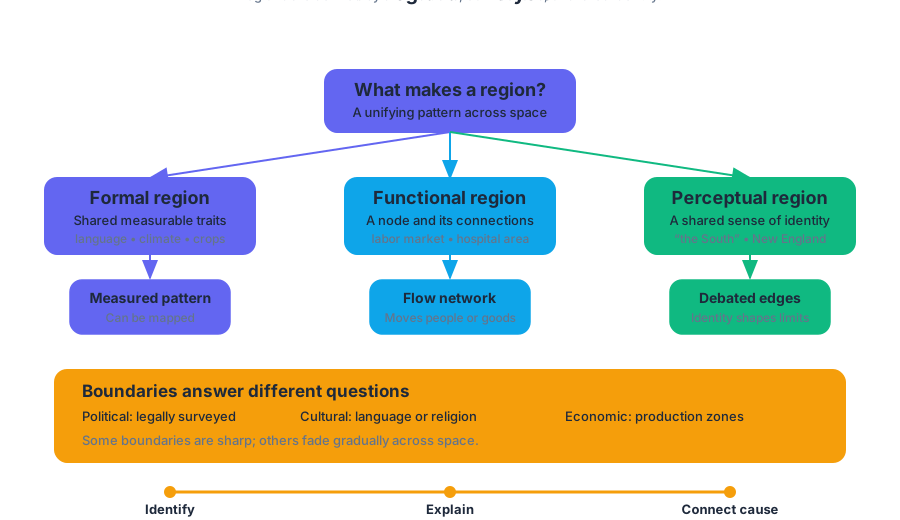
A formal region has one or more measurable characteristics shared across its territory, such as a language, climate, crop, political system, or level of economic development. A functional region is organized around a central node and the connections flowing to or from it, such as a metropolitan labor market, a hospital service area, or a transportation network. A perceptual region exists because people believe an area has a shared identity, even when its boundaries are debated—for example, “the South” or “New England.”
Boundaries help show where a region begins and ends, but different boundaries answer different questions. A political boundary may be legally surveyed; a cultural boundary may mark a transition between languages or religions; an economic boundary may separate production zones. Some boundaries are sharp, while others fade gradually across space.
Skill move — identify, then explain: First identify the regional pattern visible on a map. Then explain the unifying characteristic or relationship that creates it. “The points cluster near the coast” describes a pattern; “the coast attracts port industries because of transportation access” explains the spatial relationship.
Site characteristics and political power
A place’s site characteristics are its physical and built features at a specific location: terrain, waterways, climate, transportation access, infrastructure, and existing structures. Washington, D.C., illustrates how site can support political importance. It occupies a planned federal district along the Potomac River, positioned between historically powerful regions and designed to serve as the national capital rather than as part of a state.
Washington, D.C., also reveals the spatial distribution of political power. In the U.S. federal system, authority is divided between the national government and state governments, but the capital concentrates national institutions—the White House, Congress, Supreme Court, and executive agencies—in one place. Political decisions made there affect the entire country, so a relatively small area exercises influence at a national scale.
Key insight: The size of a region does not determine its political importance. A small capital district can function as the command center of a much larger political territory.
Ethnic residential patterns
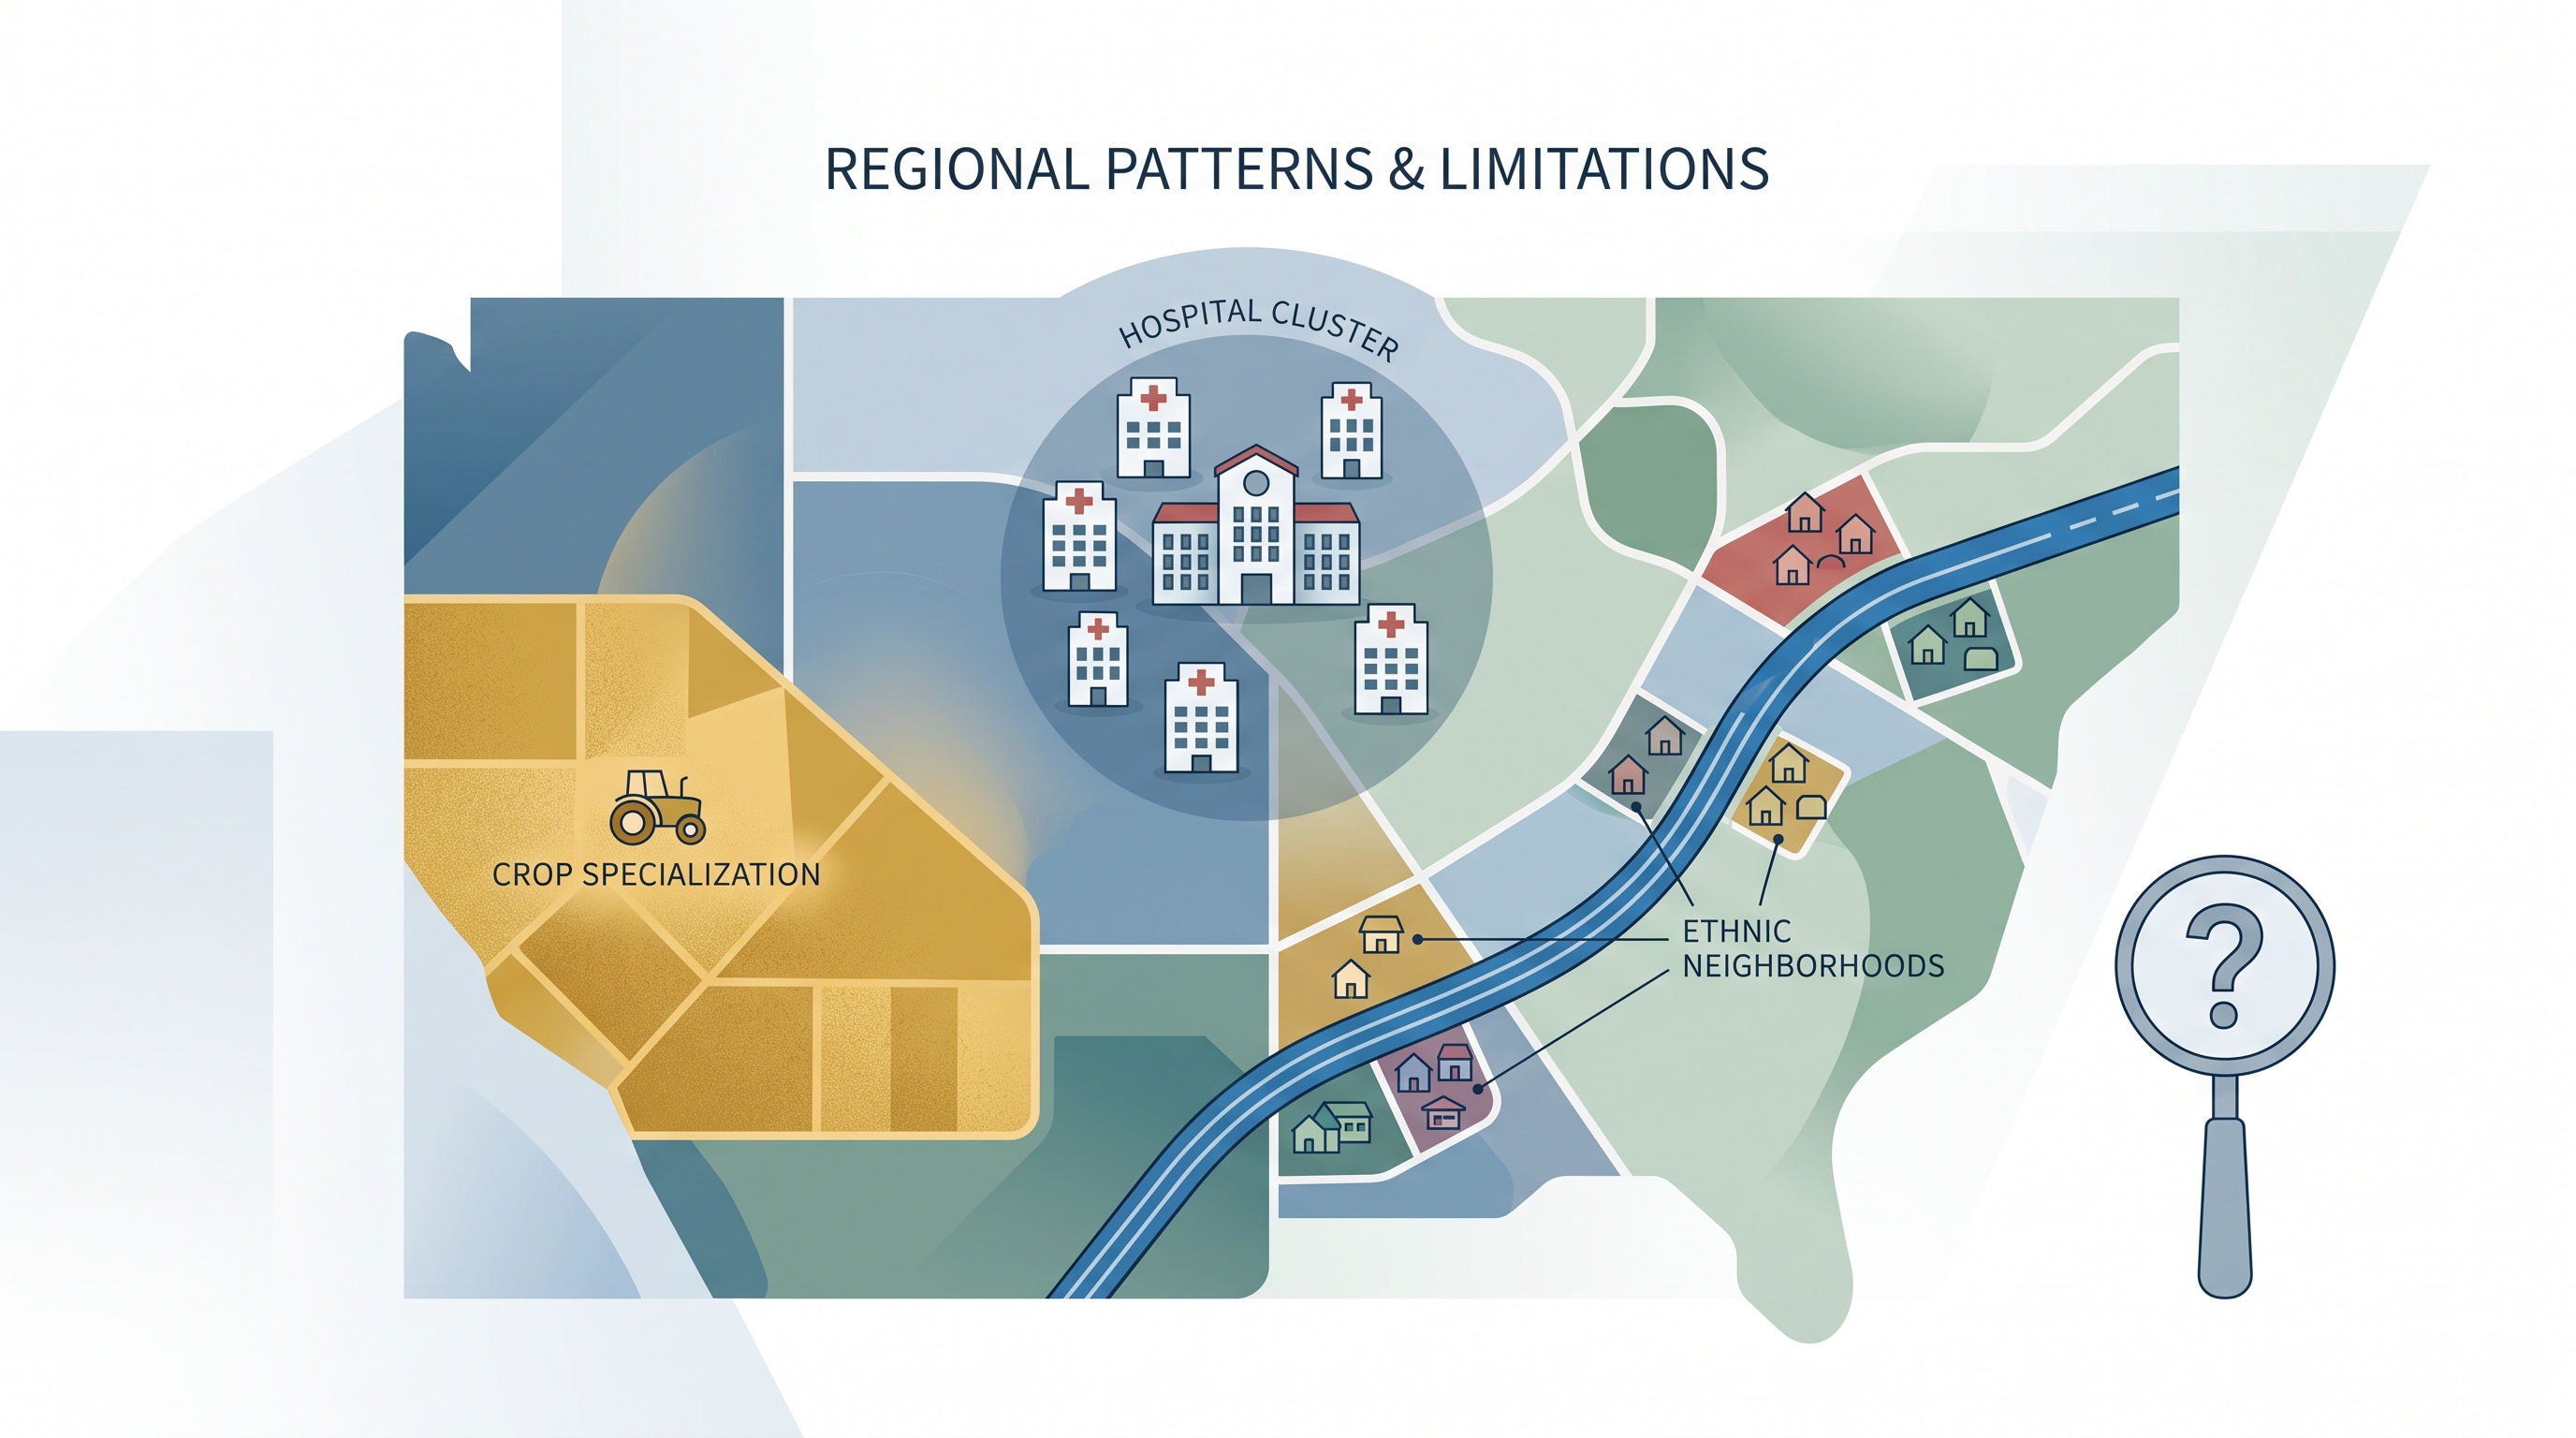
Ethnic neighborhoods are regional patterns produced by migration, family networks, housing access, employment, cultural institutions, and sometimes discrimination. In a metropolitan area, a neighborhood where Chinese Americans and Korean Americans reside together would be an example of overlapping ethnic residential patterns. The pattern may be clustered rather than uniformly distributed: several neighborhoods may contain concentrations, while nearby areas contain fewer residents.
On a regional map, Chinese American neighborhoods might appear concentrated in selected parts of a metropolitan area, connected by transportation routes, or distributed in several clusters rather than forming one continuous zone. A strong description names the pattern—such as clustering, linear concentration, or dispersed concentration—and supports it with locations shown on the map.
Misconception check — “one neighborhood equals one culture”: An ethnic neighborhood does not imply that every resident shares the same ancestry or that the group lives only there. Regional maps show concentration, not exclusivity.
Scale limitations and territoriality
A conclusion drawn from a regional-scale map may not apply to smaller scales or to individual locations within the region. If a region appears economically specialized in technology, that does not mean every city, firm, or worker inside it works in technology. Applying a regional average to individuals can create an ecological fallacy—an inaccurate assumption that a group-level pattern describes every member.
Territoriality is the connection people develop between a group and its land. When a cultural or national group believes that its territory deserves greater political control, territoriality can contribute to devolution, the transfer of power from a central government to a regional government. Scotland’s proposed independence from the United Kingdom illustrates how a distinct national identity, historical territory, and desire for self-government can challenge an existing state structure.
Economic concentration and interdependence
Economic regions can be recognized through concentration, the grouping of similar economic activities. Agglomeration and clustering describe firms or related activities locating near one another to share labor, suppliers, infrastructure, information, and markets. Linear concentration occurs along transportation routes such as rivers or major roads, while regional concentration occurs within a particular metropolitan area, such as specialized activities concentrated in Massachusetts.
Climate-based crop specialization can create comparative or commodity advantages. One region may efficiently produce a crop suited to its climate, while another specializes in a different crop or manufactured good. Trade then creates regional interdependence: each region relies on the other for goods it does not produce as efficiently.
Information technology strengthens these connections by allowing firms, institutions, and workers to communicate, coordinate, analyze data, and provide services across distance. The result can be greater productivity, efficiency, and cost-effectiveness—but technology does not erase geography; infrastructure, skilled labor, markets, and reliable connectivity remain unevenly distributed.
Retrieval check
A map shows a dense cluster of hospitals around one university, crop specialization in a dry western region, and several ethnic neighborhoods along a major highway. Identify the regional concept represented by each pattern, then state one limitation of using the regional map to describe every individual location within it.
Source Materials
- AP Human Geography Course and Exam Description
- AP Human Geography Course and Exam Description Clarifications and Corrections
- AP Human Geography Course Overview
- AP Human Geography Course at a Glance
- AP Human Geography Course at a Glance Poster
- AP Human Geography
- AP Human Geography
- AP Human Geography Sample Syllabus 1