From the free course AP United States Government and Politics on Lykke
4.6 Evaluating Public Opinion Data
A poll can produce a precise-looking percentage and still support a misleading political claim. Evaluating public opinion data means judging both the political importance of the evidence and the reliability of the method used to collect it.
4.6 Evaluating Public Opinion Data
A poll can produce a precise-looking percentage and still support a misleading political claim. Evaluating public opinion data means judging both the political importance of the evidence and the reliability of the method used to collect it.
LO 4.6.A — Quality, credibility, and political influence
A claim based on public opinion data should be tested with two questions:
- Does public opinion matter in this political context?
- Can the data be trusted?
The first question concerns political influence. Public opinion may matter greatly during a closely contested election, when officials are deciding whether a policy has broad support, or when organized groups use polling results to pressure policymakers. It may matter less when elected officials face strong constitutional limits, party commitments, or an issue that the public is paying little attention to.
The 2012 election illustrates how polling could influence campaign strategy: candidates and parties watched changing preferences in competitive states and adjusted their messages and resource allocation. During the 2016 Clinton–Trump election, public opinion data likewise shaped claims about candidate strength, although differing polls and interpretations demonstrated why credibility matters as much as visibility.
Key insight: A poll’s political importance does not automatically make it accurate, and an accurate poll does not automatically determine policy.
EK 4.6.A.1 — Why credibility affects political claims
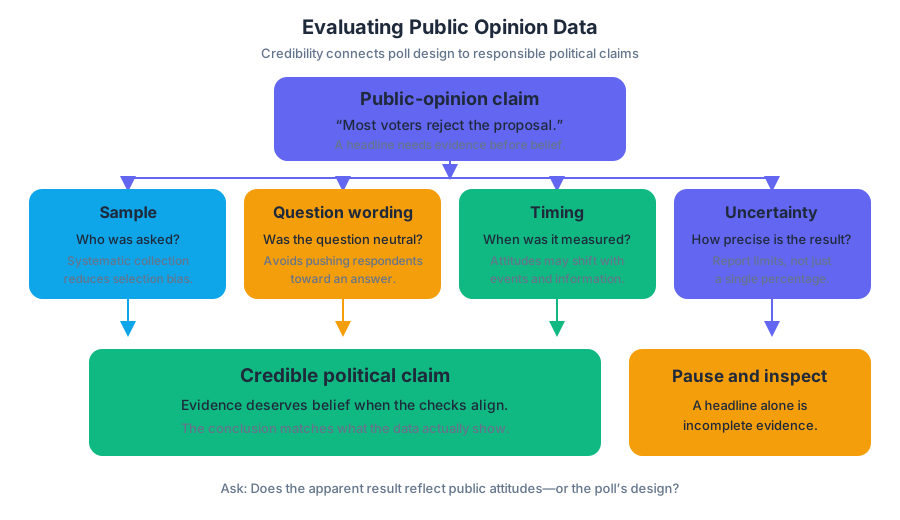
Credibility is the degree to which evidence deserves to be believed. A public-opinion claim becomes more credible when the data are collected systematically, the questions do not push respondents toward an answer, and the reported conclusion matches what the data actually show.
A headline such as “Most voters reject the proposal” is incomplete without information about the sample, question wording, timing, and uncertainty. A responsible evaluator asks whether the apparent result reflects genuine public attitudes or merely a feature of the poll’s design.
EK 4.6.A.2 — What makes polling methodology precise?
Polling methodology is the set of procedures used to select respondents, ask questions, collect answers, and report results. The methodology is more precise when it includes three features:
| Methodological feature | What it requires | Why it matters |
|---|---|---|
| Accurate sampling methods | Selecting respondents who reasonably represent the population being studied; reporting a margin of error | A biased or unrepresentative sample can distort the result |
| Neutral framing of questions | Using specific, balanced, and unbiased wording | Loaded wording can influence how people answer |
| Accurate reporting | Drawing conclusions that the data support and clearly stating limitations | A true number can still be used to create a false impression |
Worked example: evaluating one poll from start to finish
Imagine a poll of $600$ registered voters reports that $52%$ support a proposed transportation law, with a margin of error of $\pm 4$ percentage points.
Step 1: Evaluate the sample. If the poll used a sound method to select voters from the relevant population, the sample may provide useful evidence. If it surveyed only people who voluntarily clicked an online link, respondents may be unusually interested in the issue, so the result may not represent voters generally.
Step 2: Interpret the margin of error. The reported support is not best understood as exactly $52%$. The plausible range is approximately $48%$ to $56%$. Because that range includes both less than and more than half, the poll does not establish that a majority definitely supports the law.
Step 3: Inspect the question. “Do you support the transportation law?” is more neutral than “Do you support the law that will reduce dangerous traffic delays?” The second wording supplies a favorable description and may encourage agreement.
Step 4: Inspect the conclusion. “Support is measured at $52%$, with a margin of error of $\pm 4$ points” accurately reports the evidence. “Voters overwhelmingly demand the law” overstates it: the percentage is only slightly above half, and the uncertainty is substantial.
Named misconception check
Misconception: A larger number automatically makes a poll scientific. A large sample can improve precision, but it cannot repair a systematically biased sample or slanted question. For example, asking $10{,}000$ members of one advocacy organization about a national policy does not create a representative national poll.
Misconception: The margin of error is a guarantee. The margin of error describes sampling uncertainty under the poll’s assumptions; it does not correct inaccurate wording, nonresponse, dishonest answers, or a poorly chosen population.
AP Skill: Data Analysis — Explain what the data implies or illustrates
For the AP skill Data Analysis — Explain what the data implies or illustrates, do more than repeat a percentage. Identify the pattern, explain its political meaning, and connect the evidence to a principle, institution, process, policy, or behavior. A strong explanation might state that the transportation poll shows modest support but cannot demonstrate majority backing because its margin-of-error range crosses the $50%$ threshold.
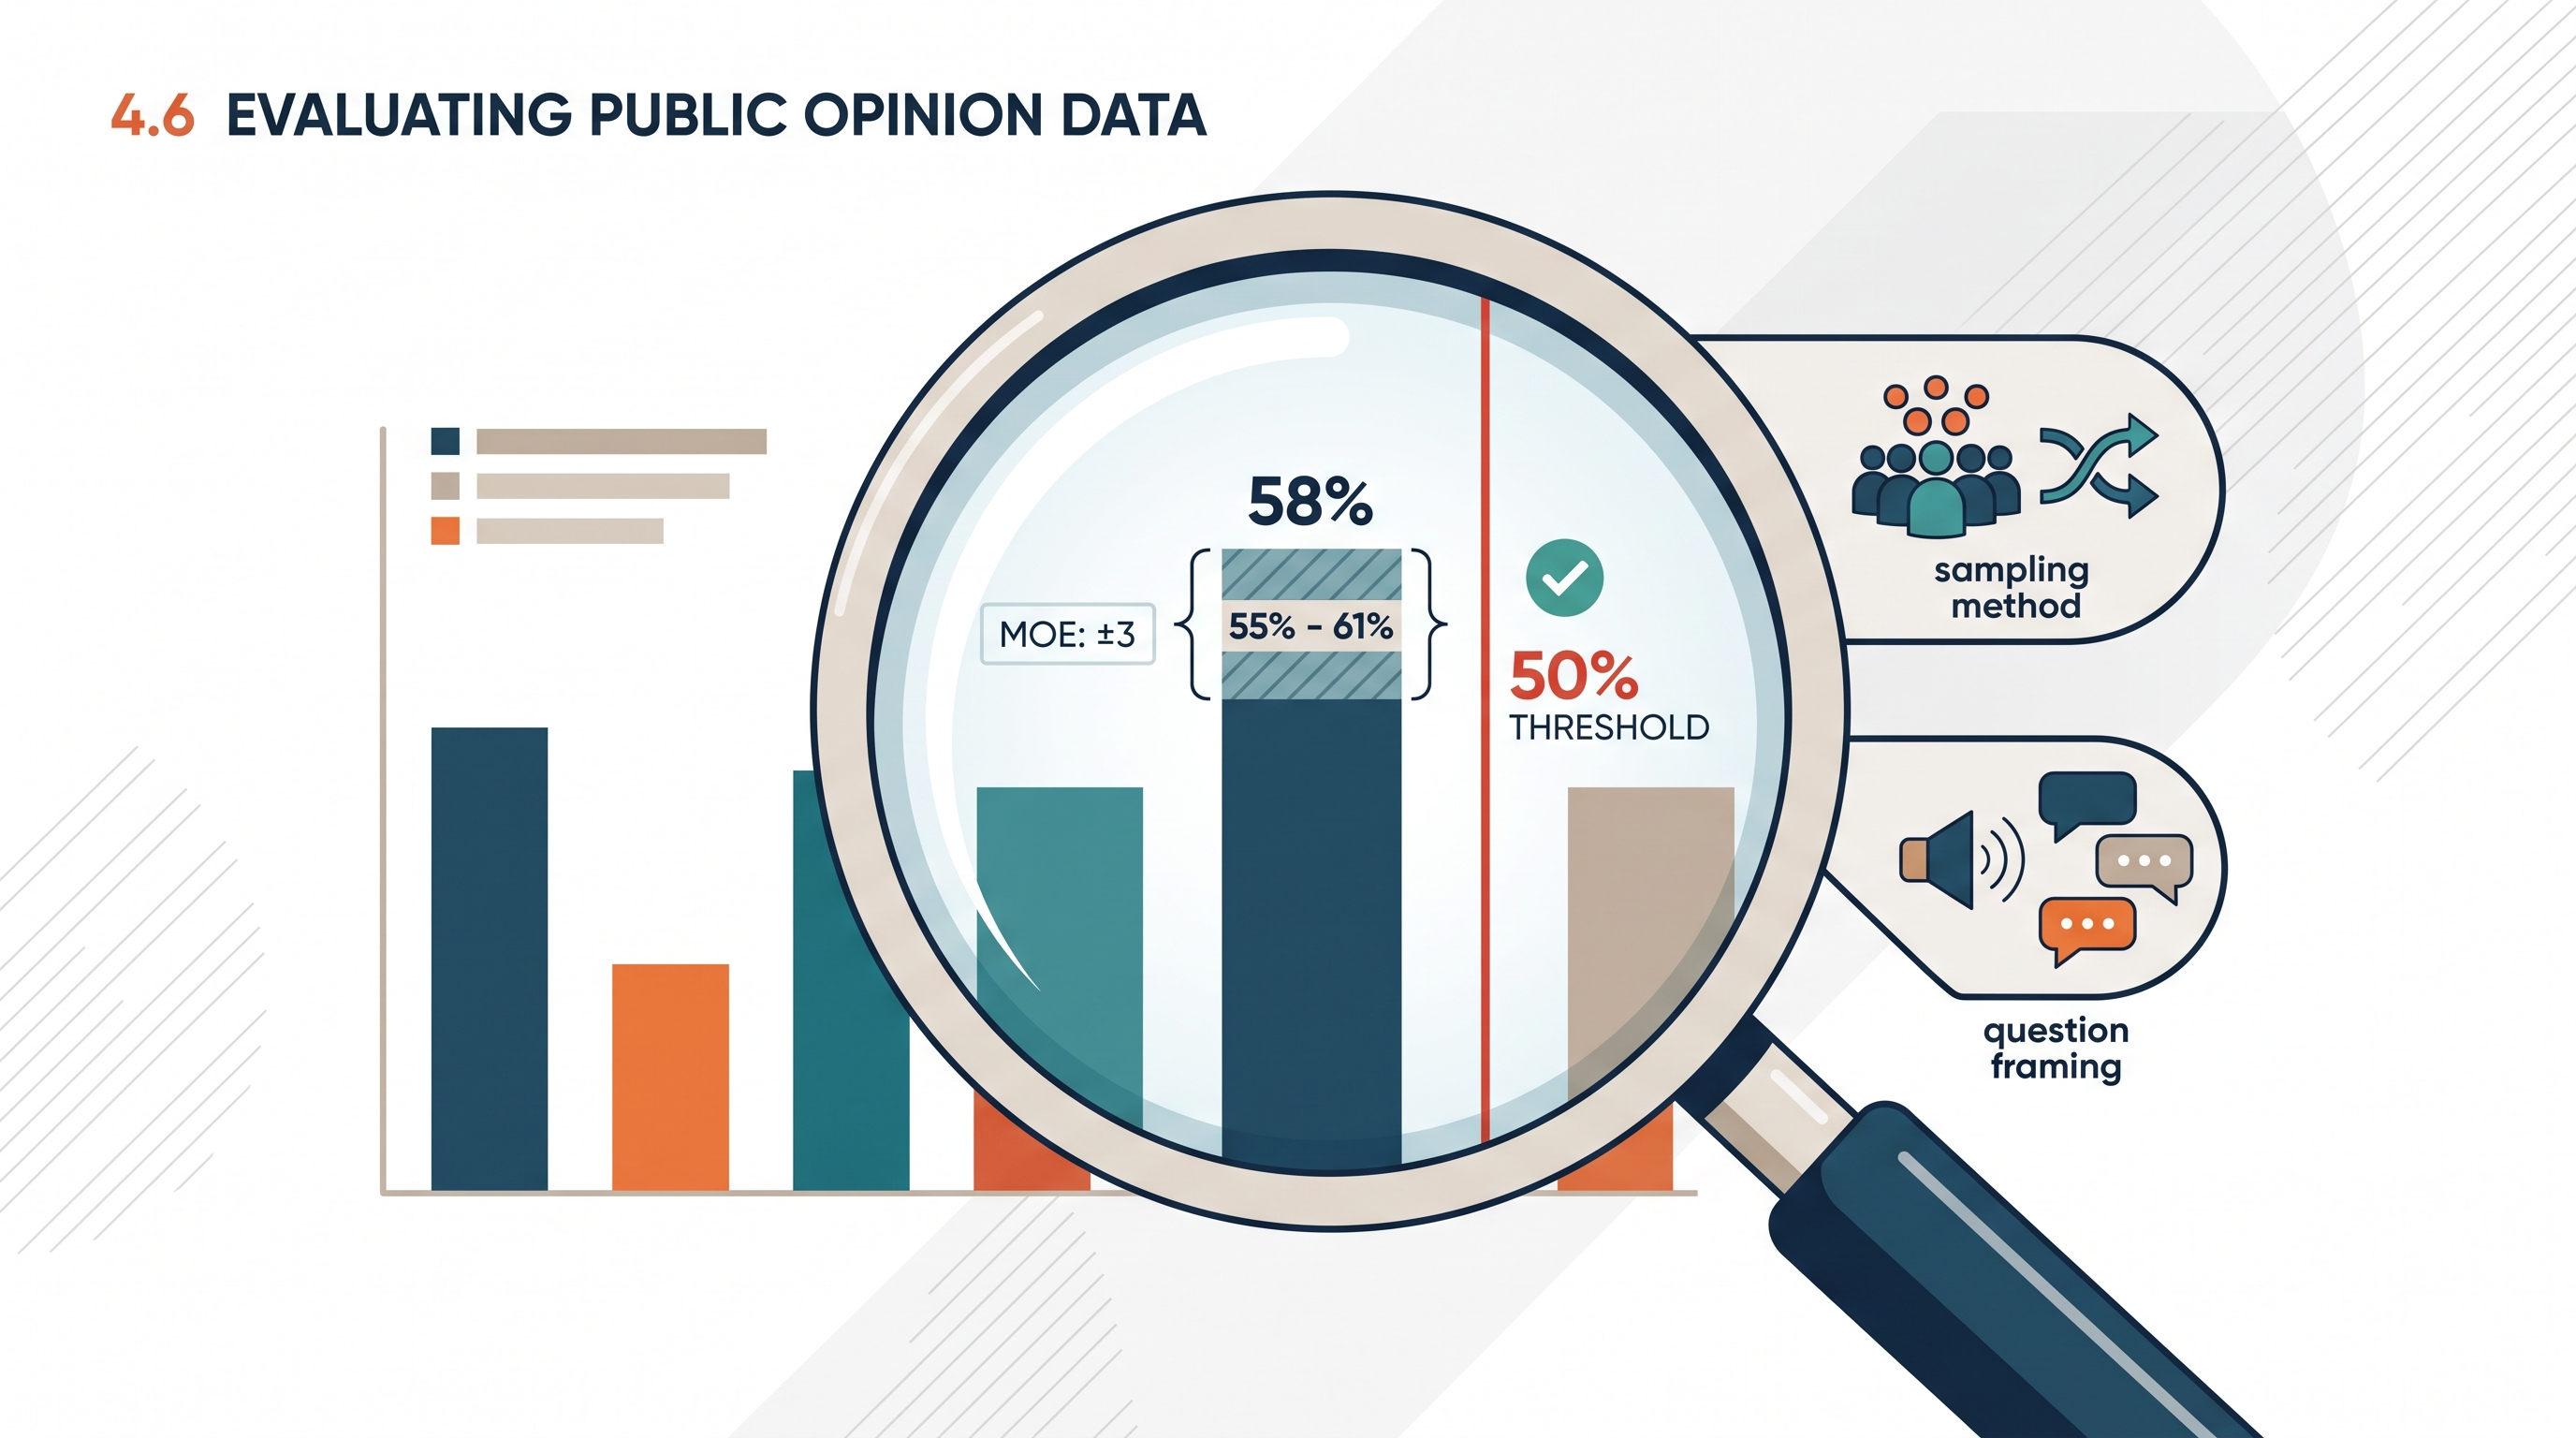
Retrieval check: A poll reports $58%$ support with a margin of error of $\pm 3$ points. What is the approximate range, and what additional information must you examine before calling the result credible? The range is $55%$ to $61%$; then examine the sampling method, question framing, and whether the reported conclusion accurately reflects those data.
Source Materials
- AP U.S. Government and Politics Course and Exam Description
- Learn More (.pdf)
- AP U.S. Government and Politics Course Overview
- AP U.S. Government and Politics Course at a Glance
- AP United States Government and Politics Course at a Glance Poster
- AP United States Government and Politics
- AP United States Government and Politics
- United States Government and Politics Sample Syllabus 1