From the free course AP United States Government and Politics on Lykke
AP Practice 2
A data set is never “just a graph.” It is evidence: a limited window into political behavior that must be described accurately before it can support a conclusion.
AP Practice 2
Quantitative Analysis Free-Response Question
A data set is never “just a graph.” It is evidence: a limited window into political behavior that must be described accurately before it can support a conclusion. The Quantitative Analysis free-response question tests whether you can identify patterns, compare values, draw defensible conclusions, and connect evidence to a political concept.
Exam task type: Quantitative Analysis FRQ
Primary skill: Data Analysis
Useful reasoning processes: identify relevant categories, describe patterns and trends, compare evidence, and draw conclusions supported by data.
Suggested timing: approximately 20 minutes, including reading, calculations, and checking.
Original Practice Prompt
The table shows the percentage of registered voters in four states who reported voting in a recent statewide election. It also shows the percentage of adults in each state who reported having contacted a public official during the previous year.
| State | Reported voter turnout among registered voters | Adults who contacted a public official |
|---|---|---|
| Northland | $72%$ | $18%$ |
| Eastmont | $61%$ | $24%$ |
| Southridge | $49%$ | $11%$ |
| Westhaven | $38%$ | $16%$ |
(a) Identify the state with the highest reported voter turnout.
(b) Describe one pattern in the relationship between voter turnout and contacting public officials shown in the table.
(c) Calculate the difference, in percentage points, between Northland’s voter turnout and Westhaven’s voter turnout.
(d) Explain how the data could support the claim that political participation includes more than voting.
Worked Reasoning and Scoring
Part (a): Locate a specific value
Northland has the highest reported voter turnout, at $72%$.
Why this earns credit: The response identifies the correct state and does not confuse the turnout column with the contacting-public-officials column.
Scoring target: State the correct value or category directly. Do not provide a vague answer such as “the northern state.”
Part (b): Describe a relationship
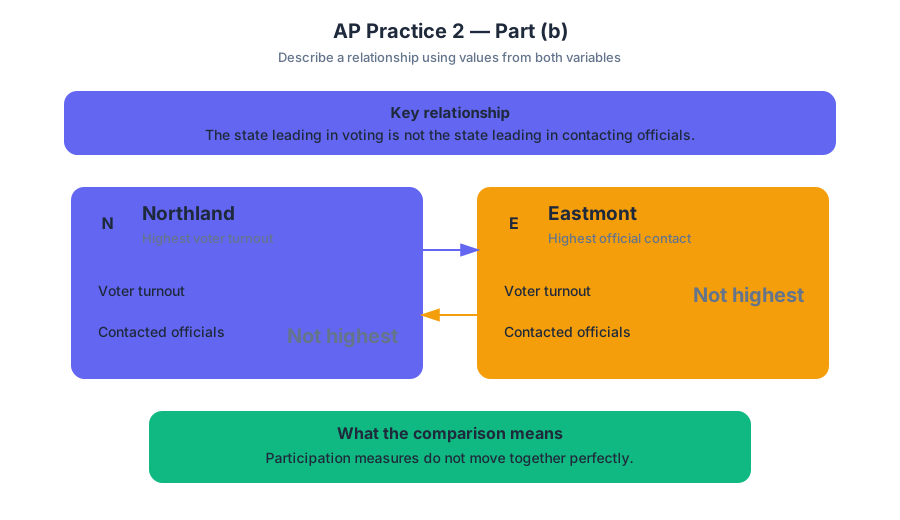
One valid pattern is that voter turnout and contacting public officials do not move together perfectly. Northland has the highest voter turnout, $72%$, but Eastmont has the highest percentage of adults who contacted a public official, $24%$.
Why this earns credit: The response describes a comparison using values from both variables. It does not merely repeat one column.
A weaker response would say, “Eastmont has $24%$ contacting officials.” That is accurate, but it does not describe a relationship. A stronger response explains what the comparison means: a state can rank highest in voting without ranking highest in another form of participation.
Part (c): Calculate a percentage-point difference
The requested difference is:
$$ 72% - 38% = 34 \text{ percentage points} $$
Northland’s reported voter turnout is $34$ percentage points higher than Westhaven’s.
Why this earns credit: The calculation uses the correct two states, subtracts in the requested direction, and reports the result as a percentage-point difference.
Do not confuse percentage points with percent change. The difference between $72%$ and $38%$ is $34$ percentage points. The percent increase relative to Westhaven would be calculated differently:
$$ \frac{72-38}{38}\times 100 \approx 89.5% $$
That is not what the prompt asks.
Part (d): Connect evidence to a political claim
The data support the claim because contacting a public official is a form of political participation separate from voting. Eastmont illustrates this distinction: it has the highest rate of contacting officials, $24%$, but its voter turnout, $61%$, is lower than Northland’s $72%$. Therefore, participation cannot be measured only by whether people cast ballots; citizens may also attempt to influence policy by communicating with government officials.
Why this earns credit: The explanation does three jobs:
- identifies a form of participation other than voting;
- cites relevant evidence from the table; and
- explains how that evidence supports the claim.
What Examiners Reward
| Response move | What it demonstrates | Common failure |
|---|---|---|
| Identify the correct state or value | Accurate data reading | Choosing the largest number from the wrong column |
| Describe a pattern | Comparison between variables or categories | Repeating one isolated statistic |
| Perform the calculation | Quantitative accuracy | Giving percent change when percentage points are requested |
| Explain the claim | Evidence linked to political meaning | Listing data without explaining its significance |
Misconception Check: Correlation Is Not Proof of Causation
The table does not prove that voting causes people to contact officials, or that contacting officials causes voting. It shows an observed relationship among four states. A careful answer describes what the data support without inventing an explanation that the table cannot establish.
Timing and Error Review
Use the first few minutes to read the title, labels, units, and question verbs. Then answer in the prompt’s order: locate, describe, calculate, explain. Reserve the final minute to check arithmetic, specify units, and confirm that every explanation contains both evidence and reasoning.
After scoring your response, label each missed point as one of four errors: reading error, comparison error, calculation error, or reasoning error. Rewrite only the sentence that lost the point, making the smallest possible correction; this reveals whether the problem was understanding the data or connecting the data to the political concept.
Retrieval check: If a table shows that one state has the highest turnout but another has the highest rate of contacting officials, what conclusion can you safely draw—and what conclusion would go beyond the evidence?

Source Materials
- AP U.S. Government and Politics Course and Exam Description
- Learn More (.pdf)
- AP U.S. Government and Politics Course Overview
- AP U.S. Government and Politics Course at a Glance
- AP United States Government and Politics Course at a Glance Poster
- AP United States Government and Politics
- AP United States Government and Politics
- United States Government and Politics Sample Syllabus 1
- AP US Gov Past Exam Questions — AP Central
- Khan Academy — AP US Government and Politics
- YouTube — Heimler's History
- YouTube — Jocz Productions