From the free course AP Biology on Lykke
8.6 Biodiversity
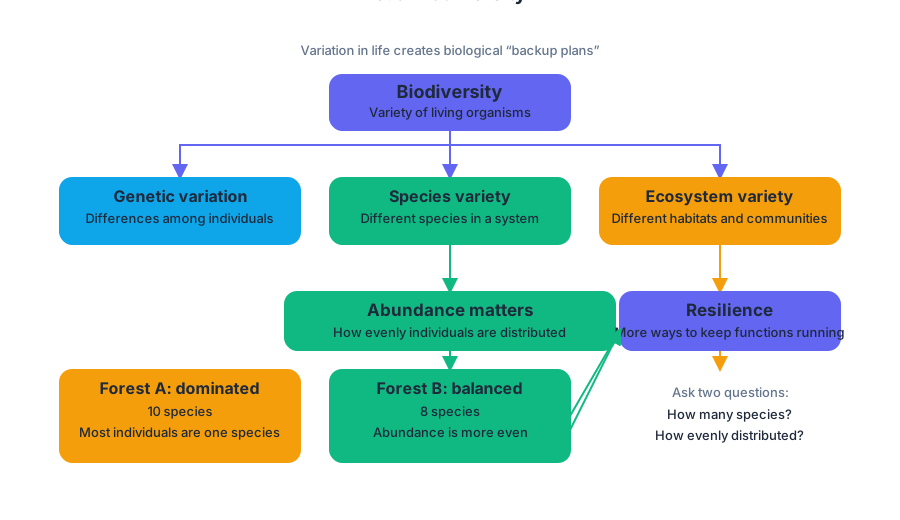
A diverse ecosystem is more likely to remain functional when conditions change because it contains more biological “backup plans.” Biodiversity is the variety of living organisms in a biological system, including variation among individuals, species, and ecosystems.
8.6 Biodiversity
A diverse ecosystem is more likely to remain functional when conditions change because it contains more biological “backup plans.” Biodiversity is the variety of living organisms in a biological system, including variation among individuals, species, and ecosystems.
The key question is not simply How many species are present? It is also How evenly is abundance distributed among those species? A forest containing ten species dominated almost entirely by one species may be less resilient than a forest containing eight species with more balanced abundances.
Measuring biodiversity
Two important components of biodiversity are species richness, the number of different species present, and relative abundance, the proportion of the community represented by each species. Species richness counts categories; relative abundance describes how the individuals are distributed among those categories.
A community with high richness and high evenness generally has greater biodiversity than a community with the same richness but extreme dominance by one species. The distinction matters because two communities can contain the same number of species yet differ substantially in ecological stability.
The AP Biology reference information includes Simpson’s Diversity Index, which combines richness and relative abundance. One common form is
$$D = 1-\sum \left(\frac{n_i}{N}\right)^2$$
Here, $n_i$ is the number of individuals belonging to species $i$, and $N$ is the total number of individuals sampled. Larger values of $D$ indicate greater diversity in this form of the index.
Worked example: two ponds
Suppose researchers sample two ponds, collecting $100$ organisms from each.
| Pond | Species counts | Simpson’s Diversity Index |
|---|---|---|
| A | $80$, $10$, $10$ | $1-(0.80^2+0.10^2+0.10^2)=0.34$ |
| B | $40$, $30$, $20$, $10$ | $1-(0.40^2+0.30^2+0.20^2+0.10^2)=0.70$ |
Pond B has both greater species richness and a more even distribution of individuals. Its larger value of $D$ supports the conclusion that Pond B is more diverse. The calculation does not by itself prove that Pond B will survive every disturbance; it provides quantitative evidence relevant to comparing the two communities.
Biodiversity and ecosystem resilience
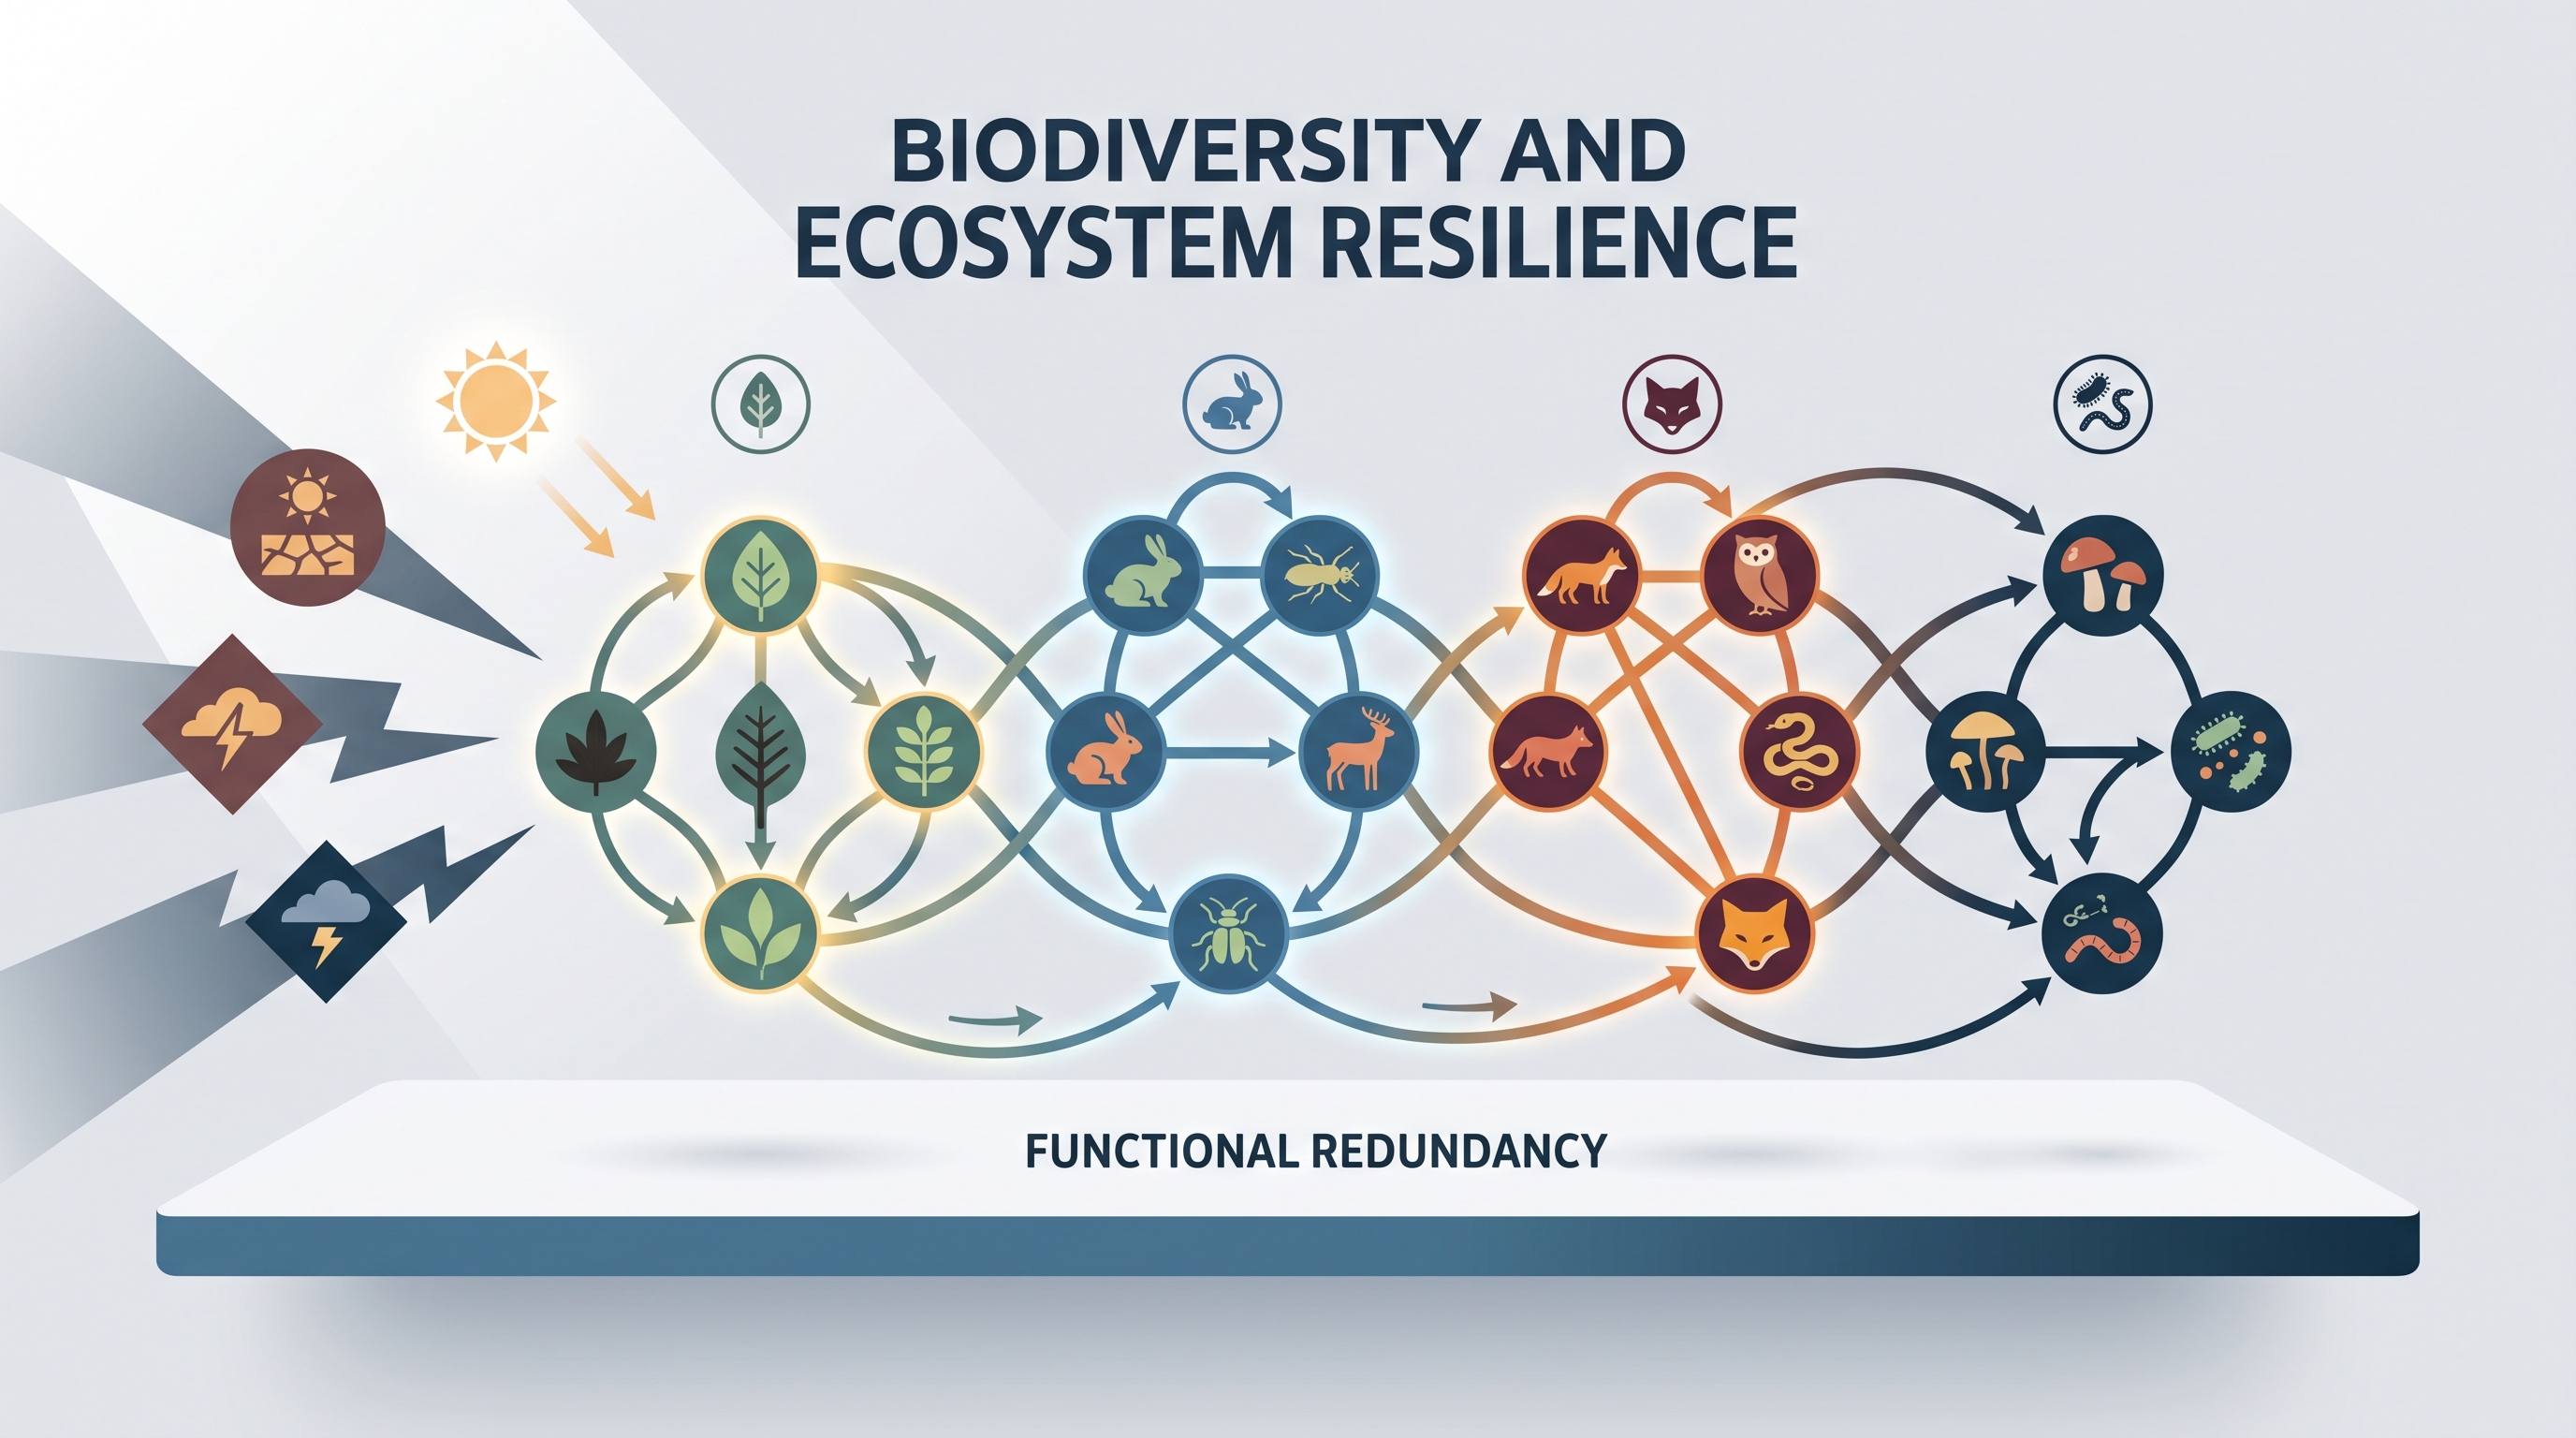
Ecosystem resilience is the capacity of an ecosystem to maintain or recover its structure and function after a disturbance. Biodiversity can increase resilience through functional redundancy: different species may perform similar ecological roles, so the loss of one species does not necessarily eliminate an essential process.
For example, several plant species may contribute to primary production, while several decomposer species may break down organic matter. If drought reduces one plant population, other plants may continue capturing energy and supplying organic material to the food web. Energy still flows through the system, although the community may change.
Biodiversity can also increase the range of responses available to an ecosystem. Species differ in tolerance to temperature, water availability, pathogens, and other environmental conditions. When conditions shift, at least some members of a diverse community may remain well suited to the new conditions.
A crucial distinction: diversity is not invulnerability
A common misconception is “More biodiversity means an ecosystem cannot be disrupted.” Biodiversity usually increases the likelihood that ecosystem functions will persist, but a sufficiently severe disturbance can still cause major losses. Resilience is a probability and systems property, not an absolute guarantee.
Another misconception is “Species richness alone measures biodiversity completely.” Richness ignores relative abundance. A community with one species making up $99%$ of its individuals and nine rare species may have the same richness as a community in which all ten species are similarly abundant, but the second community has greater evenness and typically a higher diversity index.
AP Biology reasoning in Topic 8.6
Science Practice 1: Explanation of Concepts is used to connect biodiversity to ecosystem resilience. A strong explanation identifies a mechanism, such as functional redundancy or differing environmental tolerances, rather than merely stating that “biodiversity is helpful.”
Science Practice 2: Visual Representations applies when interpreting species-abundance graphs, food webs, or diagrams showing ecosystem responses before and after disturbance. Science Practice 4: Representing and Describing Data applies when calculating or comparing diversity indices and describing patterns without claiming more than the data show.
Science Practice 5: Statistical Tests and Data Analysis applies when researchers determine whether observed differences in diversity or recovery are larger than expected from sampling variation. Science Practice 6: Argumentation requires a claim about resilience supported by numerical or graphical evidence and linked to biological reasoning. Science Practice 3: Questions and Methods appears when evaluating how researchers sampled organisms or designed a biodiversity comparison.
Retrieval check
Community X contains four species with abundances $25$, $25$, $25$, and $25$. Community Y contains four species with abundances $97$, $1$, $1$, and $1$. Which community has the greater species richness? Which has the greater biodiversity, and why?
Both communities have species richness of $4$. Community X has greater biodiversity because its relative abundances are more even, producing a larger Simpson’s Diversity Index and generally greater functional redundancy.