From the free course AP Biology on Lykke
5.3 Mendelian Genetics
Key concepts: Mendelian genetics · Alleles and genes · Dihybrid crosses · Heterozygosity · Phenotypes and contrasting traits · Artificial selection · Quantitative traits · F2 generation · Allele frequencies · Population genetics and evolution
A single Fast Plant can carry two different alleles for each of two traits while displaying only one phenotype, making heredity visible in a classroom-sized population.
5.3 Mendelian Genetics
A single Fast Plant can carry two different alleles for each of two traits while displaying only one phenotype, making heredity visible in a classroom-sized population.
Mendelian genetics explains how discrete heritable traits are transmitted through alternative forms of genes called alleles. A gene is a stretch of DNA associated with a biological characteristic; alleles are different versions of that gene. An organism with two different alleles is heterozygous, whereas an organism with two identical alleles is homozygous.
Fast Plant seed stock C1-122 is heterozygous for two Mendelian traits:
- leaf color: green versus light green;
- stem color: purple, produced by the pigment anthocyanin, versus green, lacking anthocyanin.
The plant’s observable characteristics are its phenotype. Its allele combination is its genotype. A heterozygous plant may possess one allele associated with green leaves and one associated with light-green leaves, yet show only one leaf-color phenotype if one allele is dominant. Dominance describes the phenotype of a heterozygote; it does not mean that the dominant allele is stronger, more common, or more beneficial.
The dihybrid cross
A dihybrid cross follows the inheritance of two genes at the same time. Represent the two genes with allele pairs such as $G/g$ for leaf color and $P/p$ for stem color. If a C1-122 plant is heterozygous for both genes, its genotype can be written $GgPp$.
Because the two allele pairs separate during gamete formation, the possible gametes are $GP$, $Gp$, $gP$, and $gp$. If two $GgPp$ plants are crossed, each parent can produce all four gamete types. Assuming the genes assort independently and the traits show complete dominance, the expected F$_2$ phenotype ratio is:
$$9\text{ dominant for both}:3\text{ dominant leaf, recessive stem}:3\text{ recessive leaf, dominant stem}:1\text{ recessive for both}$$
For example, if purple stems and green leaves are dominant, the $9$ category would contain plants with green leaves and purple stems, while the $1$ category would contain plants with light-green leaves and green stems. The ratio is a probability prediction for a large offspring group, not a guarantee for every family. Small samples can depart substantially from $9:3:3:1$ by chance.
Worked example: predicting one F$_2$ outcome
Suppose the cross is $GgPp \times GgPp$. The probability that an offspring has light-green leaves is $1/4$, and the probability that it has green stems without anthocyanin is $1/4$. Under independent assortment, the probability of both recessive phenotypes is:
$$\frac{1}{4}\times\frac{1}{4}=\frac{1}{16}$$
In a group of $160$ F$_2$ plants, the expected number with both recessive phenotypes is therefore:
$$160\times\frac{1}{16}=10$$
An observed count of $8$ or $12$ would not automatically disprove the model. The appropriate question is whether the difference between observed and expected counts is larger than random sampling variation, often tested with a chi-square analysis.
Mendelian genetics versus artificial selection
The C1-122 investigation combines two studies that must not be confused. The leaf-color and stem-color traits form a Mendelian dihybrid cross, involving distinct phenotype categories. Hairiness is a quantitative trait, meaning that individuals vary along a measurable scale rather than fitting neatly into a few contrasting classes.
To study artificial selection, students can select the top $10%$ of plants for hairiness as parents of the next generation. The remaining plants can continue growing; in fact, the approximately $90%$ not selected for hairiness can be used to produce an F$_2$ generation. Comparing the hairiness distributions with histograms reveals whether the selected group differs from the original population.
Artificial selection occurs when humans choose which organisms reproduce. It can change allele frequencies if the selected phenotype is heritable. This differs from the Mendelian cross: the cross tests predicted inheritance patterns, whereas selection changes which alleles become more represented in later generations.
From inheritance to changing allele frequencies
Mendelian genetics predicts how parental genotypes produce offspring genotypes and phenotypes. Population genetics asks a broader question: how do allele frequencies change across generations? Natural selection is a major mechanism of evolution, but mutation can introduce new alleles and migration can move alleles between populations.
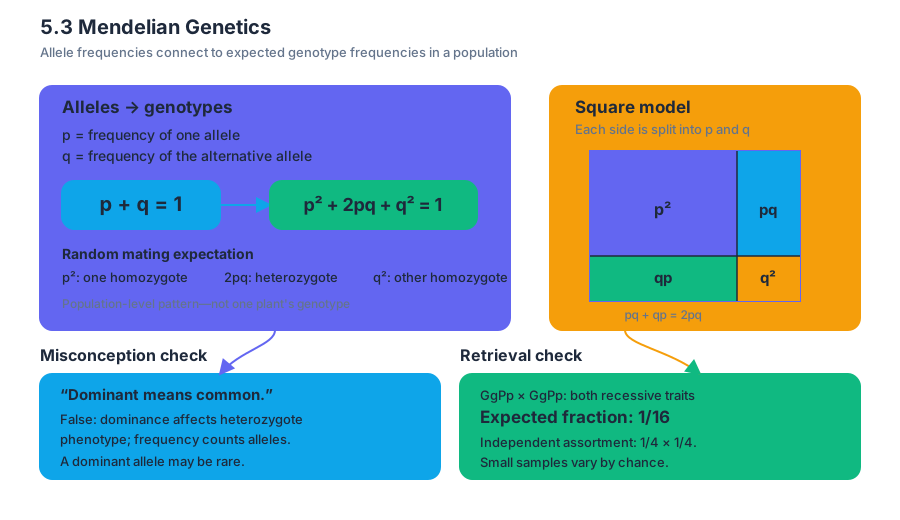
Let $p$ represent the frequency of one allele and $q$ the frequency of the alternative allele:
$$p+q=1$$
Under random mating, the expected genotype frequencies are:
$$p^2+2pq+q^2=1$$
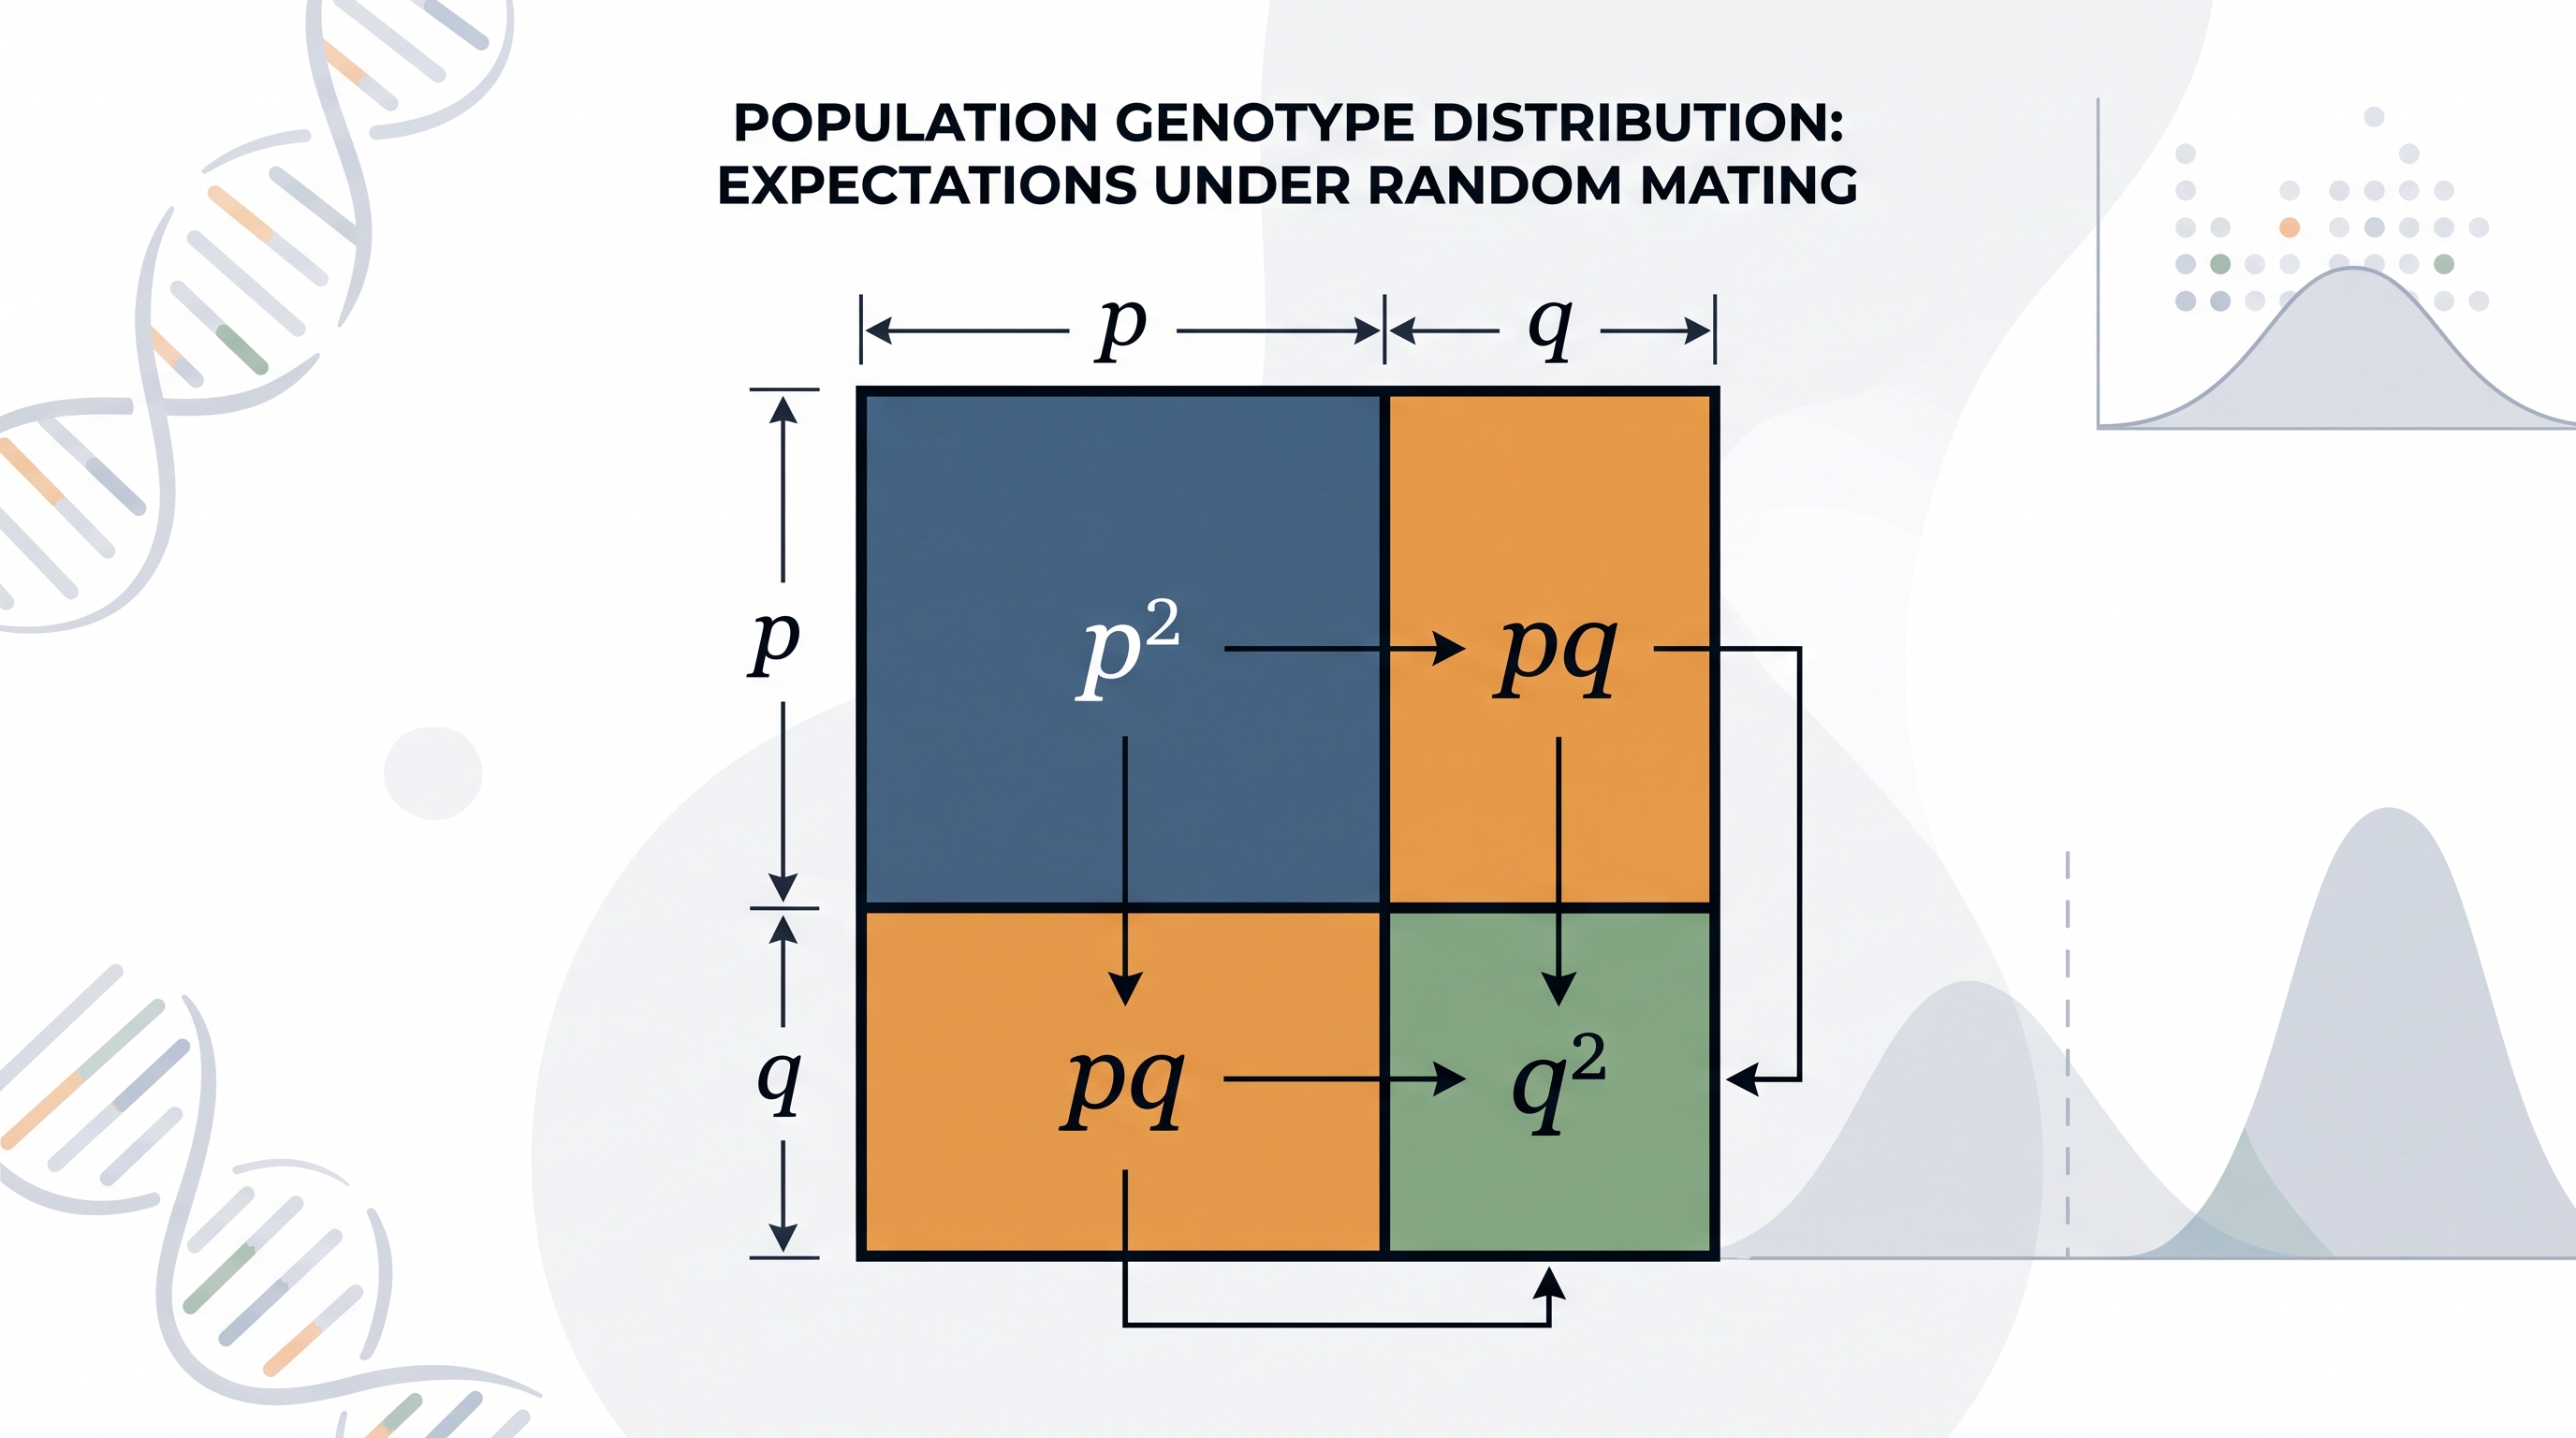
Here, $p^2$ represents one homozygous genotype, $2pq$ the heterozygous genotype, and $q^2$ the other homozygous genotype. These values describe population-level expectations, not the genotype of one particular plant.
A useful visual model is a square whose side length is divided into segments of magnitude $p$ and $q$. The four areas are $p^2$, $pq$, $qp$, and $q^2$; combining the two mixed rectangles gives $2pq$. If artificial selection favors hairier plants, the next generation may no longer match these starting frequencies because reproduction is not random with respect to the trait.
Misconception check — “Dominant means common.” A dominant allele can be rare, and a recessive allele can be common. Dominance concerns the phenotype of a heterozygote; allele frequency concerns how often an allele occurs in the population.
Retrieval check: A $GgPp$ plant is crossed with another $GgPp$ plant. What fraction of offspring is expected to show both recessive phenotypes under independent assortment, and why can the observed fraction differ in a small sample?