From the free course AP Biology on Lykke
Course Framework, Skills and Reasoning Processes
Key concepts: Course organization into eight biology units · Unit guides and suggested course sequence · AP Biology big ideas and crosscutting concepts · Science practices for analyzing biological information · Representing and describing data · Statistical tests and mathematical calculations · Scientific argumentation and justification of claims · Laboratory investigations and lab-program setup · Progress Checks and assessment reports · College-level content, skills, and reasoning processes
AP Biology is organized around one recurring question: How do biological systems store information, use energy, respond to change, evolve, and interact across levels of organization?
Course Framework, Skills and Reasoning Processes
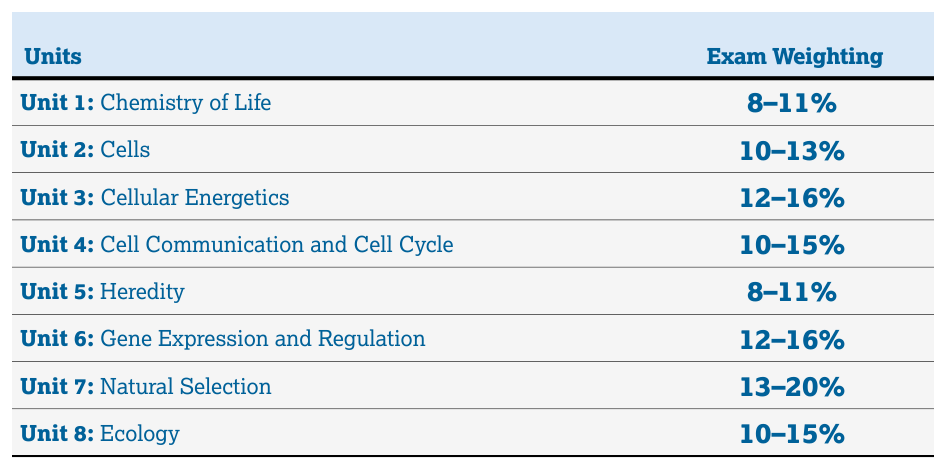
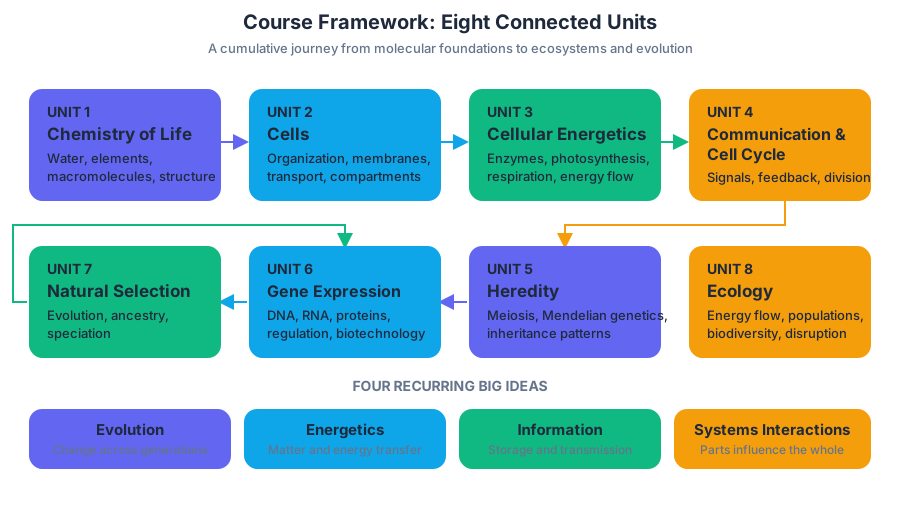
AP Biology is organized around one recurring question: How do biological systems store information, use energy, respond to change, evolve, and interact across levels of organization? The course follows eight connected units rather than eight isolated subjects.
| Unit | Central biological territory |
|---|---|
| Unit 1: Chemistry of Life | Water, elements, macromolecules, and biological structure |
| Unit 2: Cells | Cell organization, membranes, transport, and compartmentalization |
| Unit 3: Cellular Energetics | Enzymes, photosynthesis, respiration, and energy transfer |
| Unit 4: Cell Communication and Cell Cycle | Signaling, feedback, division, and cell-cycle regulation |
| Unit 5: Heredity | Meiosis, Mendelian genetics, and inheritance patterns |
| Unit 6: Gene Expression and Regulation | DNA, RNA, protein production, biotechnology, and specialization |
| Unit 7: Natural Selection | Evolutionary mechanisms, common ancestry, and speciation |
| Unit 8: Ecology | Energy flow, populations, communities, biodiversity, and ecosystem disruption |
The sequence is cumulative: chemistry supports cells; cells support energetics and communication; heredity and gene expression explain biological information; natural selection explains diversity; ecology examines interactions among organisms and their environments. The four recurring Big Ideas are Evolution, Energetics, Information Storage and Transmission, and Systems Interactions.
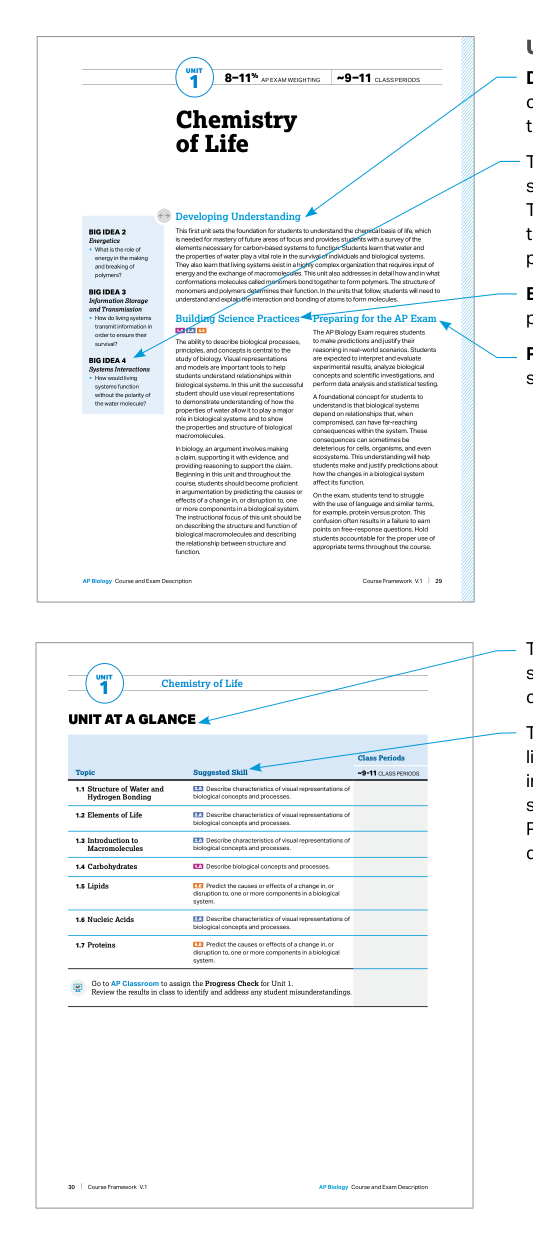
Unit guides and the suggested sequence
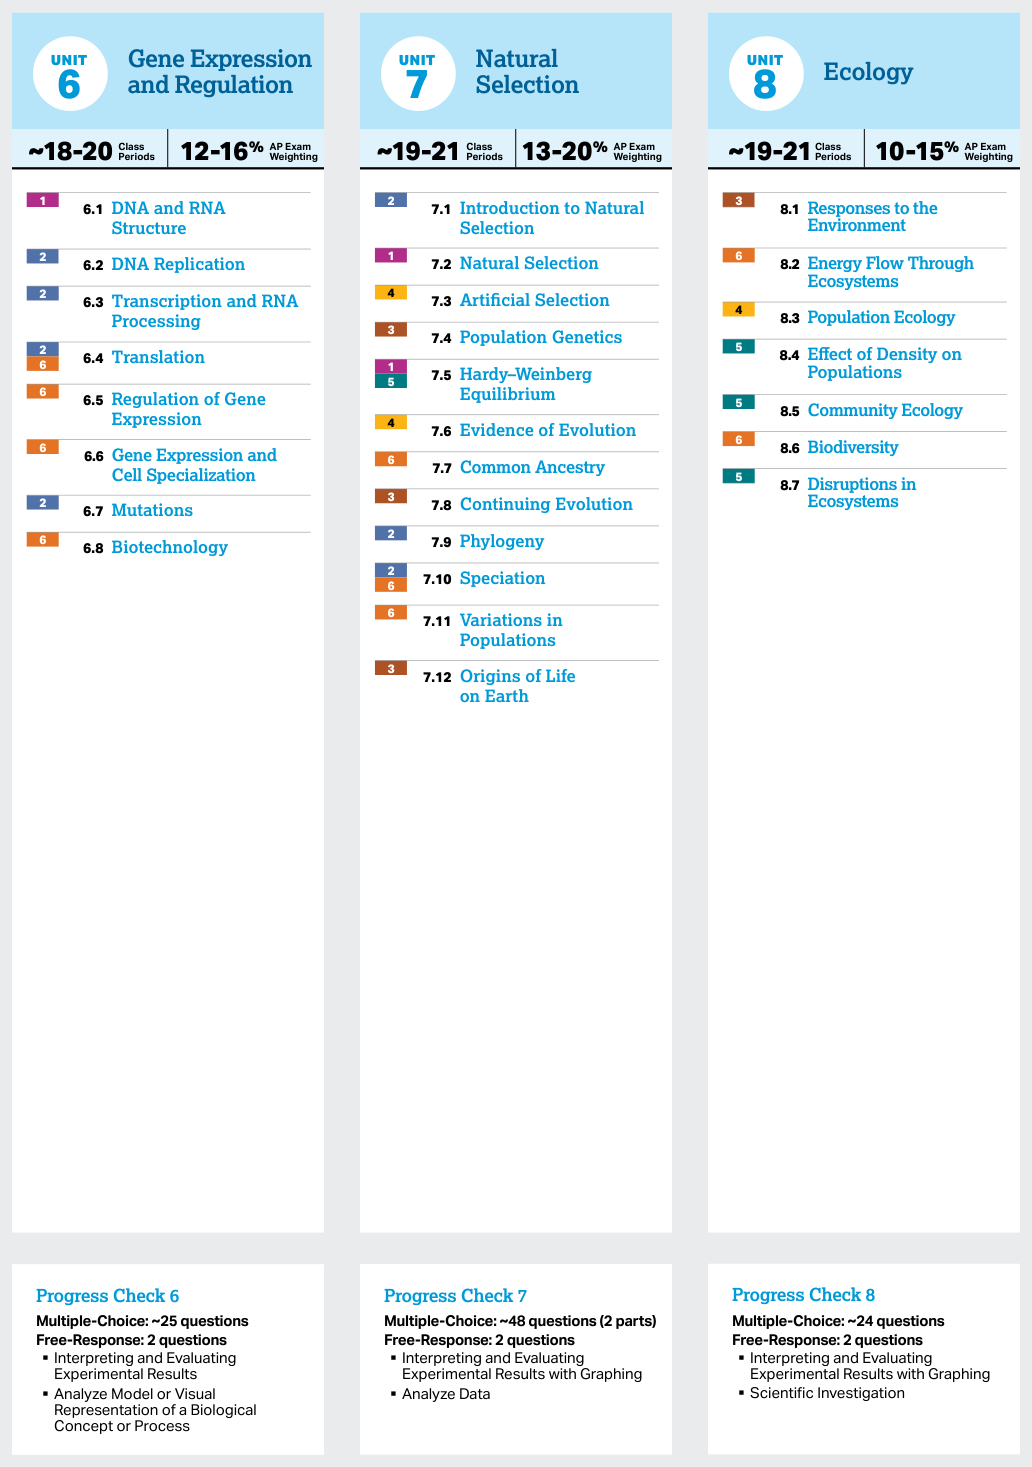
Unit guides provide a suggested sequence of commonly taught topics, together with the content and skills generally expected for college credit and/or placement. The suggested pacing assumes approximately $45$-minute classes meeting five days per week across a full academic year; it is guidance for planning, not a rule that every classroom must follow.
The course deliberately spirals its skills. A student may first construct a graph in Unit 1, interpret enzyme data in Unit 3, analyze inheritance results in Unit 5, and evaluate population data in Unit 7. The biological setting changes, but the reasoning pattern becomes more powerful and transferable.
A useful skill emphasis map looks like this:
- Units 1–3: Concept explanation, visual representations, data representation, and mathematical analysis.
- Units 4–6: Models of signaling and gene expression, experimental methods, and evidence-based argumentation.
- Units 7–8: Statistical reasoning, population and ecological graphs, causal explanations, and scientific claims.
Laboratory investigations make this sequence concrete. Inquiry-based work asks students to pose questions, identify variables, collect data, analyze patterns, and connect evidence to biological principles. A laboratory notebook, report, or data table is therefore not separate from “content”; it is a place where biological reasoning becomes visible.
The six Science Practices
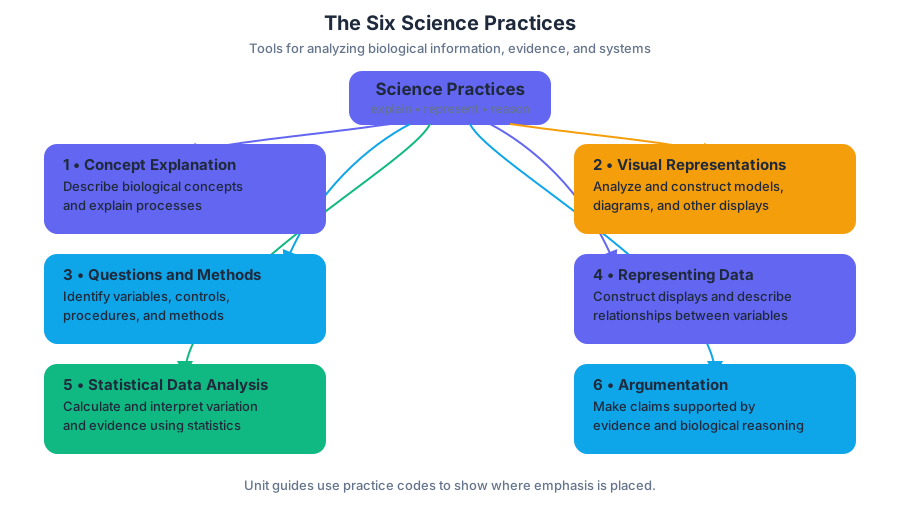
The six official Science Practices are the tools used to analyze biological information:
- Science Practice 1: Concept Explanation — describe and explain biological concepts and processes.
- Science Practice 2: Visual Representations — analyze, explain, and construct diagrams, models, and other representations.
- Science Practice 3: Questions and Methods — identify scientific questions, variables, controls, procedures, and appropriate methods.
- Science Practice 4: Representing and Describing Data — construct graphs and other displays and describe relationships between variables.
- Science Practice 5: Statistical Tests and Data Analysis — perform mathematical calculations and use statistics to interpret variation and evidence.
- Science Practice 6: Argumentation — make scientific claims and justify them with evidence and biological reasoning.
Important identifiers include 1.A, describing biological processes and concepts; 2.A, using and explaining visual representations and models; 5.C, performing chi-square hypothesis testing; and 6.E, predicting the causes or effects of a change in, or disruption to, one or more components in a biological system. Unit guides display these codes to show which practices receive particular emphasis.
Science Practice 4: Representing and Describing Data
A graph is an argument in visual form. To represent an experiment, place the independent variable—the factor deliberately changed—on the $x$-axis and the dependent variable—the measured response—on the $y$-axis. Label both axes with variables and units, choose a scale that reveals the pattern, and include a meaningful title or legend when needed.
For example, if increasing salt concentration changes seed germination, a graph can reveal whether germination decreases steadily, reaches a threshold, or remains unchanged. Describing the relationship means stating the observable pattern before explaining it: “As salt concentration increases, the percentage of germinated seeds decreases.”
Science Practice 5: Statistical Tests and Data Analysis
Mathematical analysis separates a pattern from random variation. The sample mean is
$$\bar{x}=\frac{1}{n}\sum x_i$$
where $n$ is sample size. Error bars may represent standard deviation, standard error, or a confidence interval; their meaning must be identified before drawing conclusions. Overlapping error bars do not automatically prove that two treatments are identical, and separated error bars do not automatically establish statistical significance.
For categorical inheritance data, the chi-square statistic compares observed values $o$ with expected values $e$:
$$\chi^2=\sum\frac{(o-e)^2}{e}$$
A large difference between observed and expected results produces a larger $\chi^2$, but the conclusion depends on degrees of freedom and the appropriate critical value.
Science Practice 6: Argumentation
A scientific argument has three linked parts: claim, evidence, and reasoning. The claim answers the biological question; evidence identifies relevant data; reasoning explains why those data support the claim using a biological mechanism or concept.
Strong argument: The treatment reduced enzyme activity because the data show a lower mean reaction rate, and the altered temperature likely changed the enzyme’s shape, reducing effective substrate binding.
The common misconception is that repeating the data is an explanation. “The treated group was lower” is evidence; “the treatment disrupted enzyme-substrate interactions” is reasoning. On assessments, a claim without evidence, or evidence without a biological link, remains incomplete.
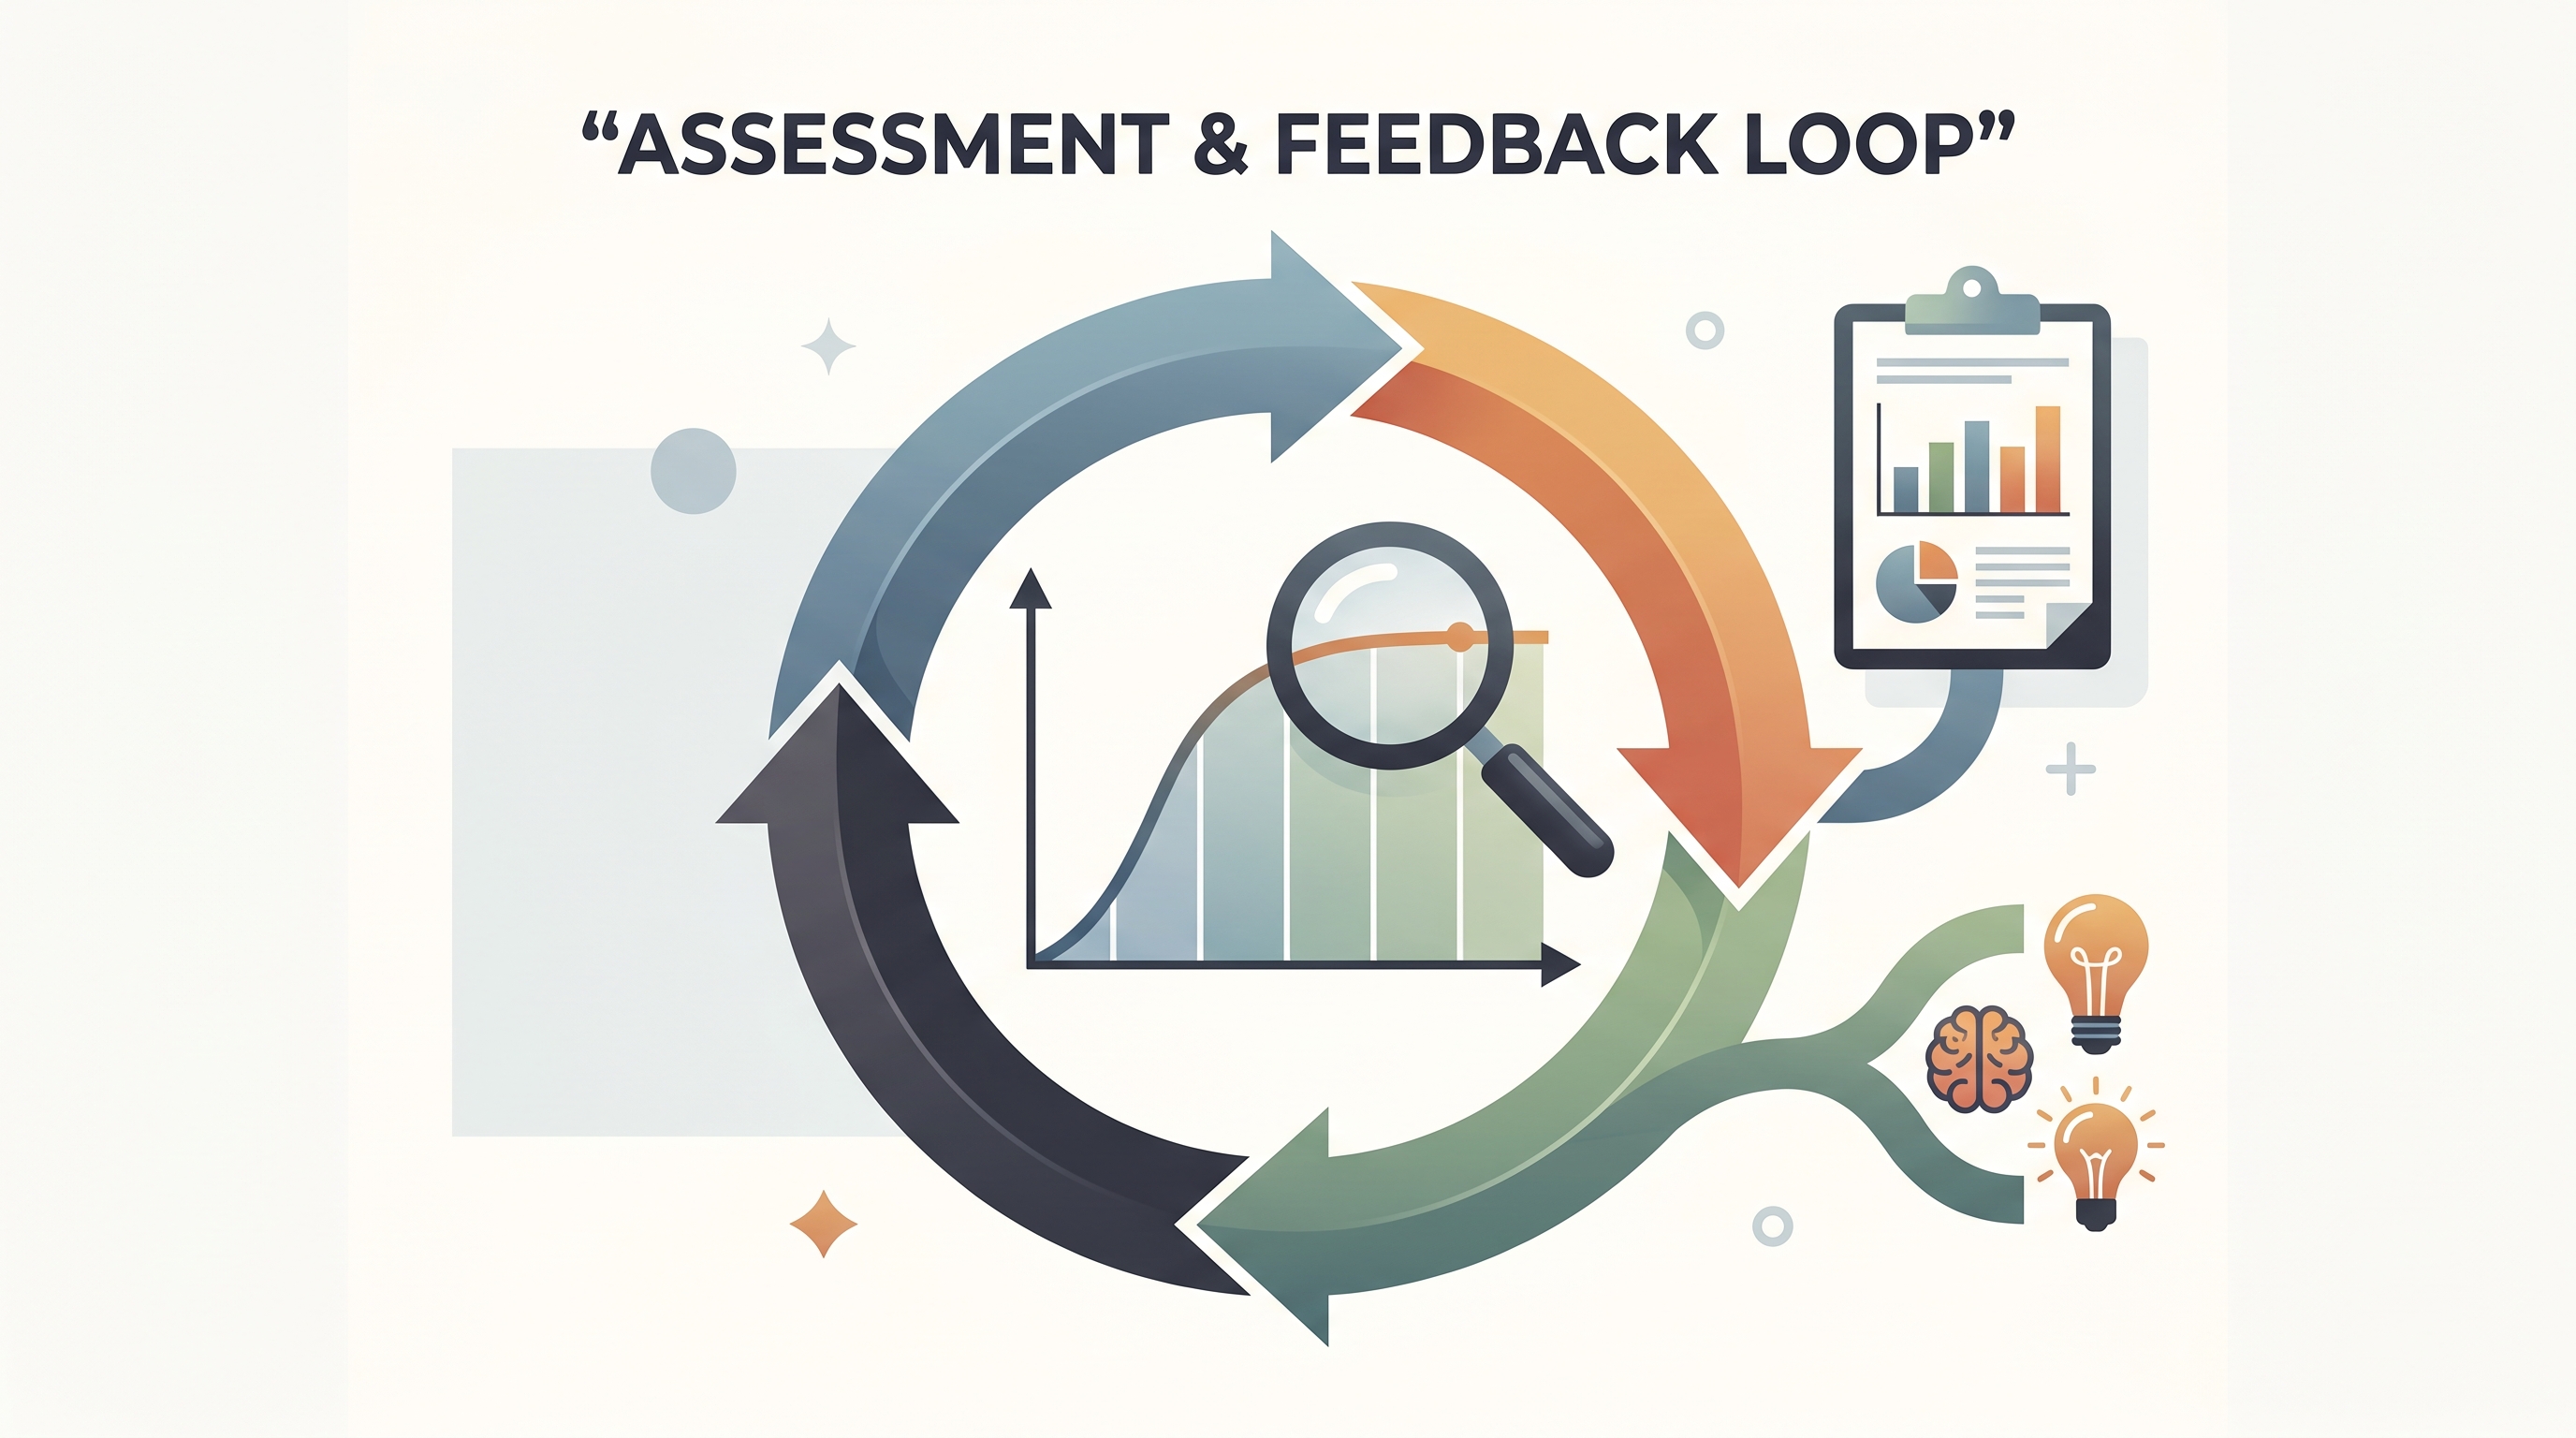
Assessment and feedback loop
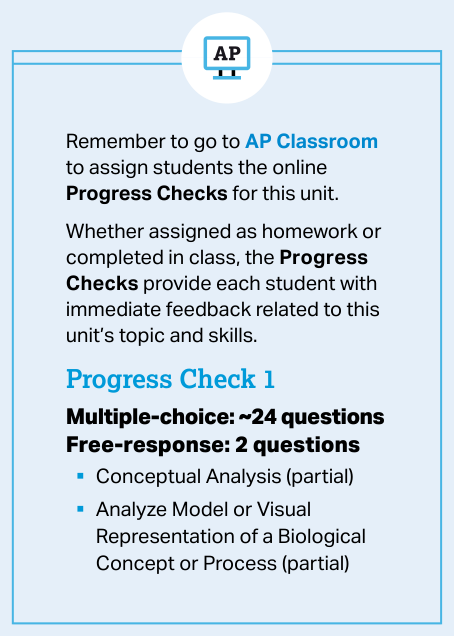
Progress Checks combine multiple-choice questions with rationales and free-response questions with scoring information. Teacher reports summarize assignment results, including Progress Checks, and identify class trends and areas of difficulty. Across both exam sections, students are expected not merely to remember biology, but to represent data, calculate, evaluate methods, and defend conclusions.
Retrieval check: A graph shows that oxygen production rises as light intensity increases, then levels off. Identify the independent and dependent variables, describe the relationship, and propose one biological explanation for the plateau. A complete response names the variables, states the trend precisely, and links the plateau to a limiting factor such as carbon dioxide availability or photosynthetic machinery.

Source Materials
- Ap Biology Course And Exam Description
- Ap Biology Course Overview
- Ap Biology Course At A Glance
- Ap Biology Equations And Formulas Sheet
- Chapter 3 Quantitative Skills In Ap Sciences
- Ap Biology Teacher Lab Manual Effective Fall 2019
- Updates 2025 26
- Figure — Ap Biology Course And Exam Description (p. 1)
- Figure — Ap Biology Course And Exam Description (p. 15)
- Figure — Ap Biology Course And Exam Description (p. 24)
- Figure — Ap Biology Course And Exam Description (p. 29)
- 00762-113-CED-Biology_Unit 1.indd 30 03/12/24 10:05 PM