From the free course AP Biology on Lykke
7.7 Common Ancestry
Key concepts: Common ancestry · Shared cellular components and organelles as evidence of common ancestry · Evolutionary relationships represented in cladograms or phylogenetic figures · BLAST comparison of gene sequences · Genome similarity and evolutionary relatedness · Out-groups in evolutionary analysis · Repeated body segments in separate evolutionary lineages · Annelida and mollusks as lineages compared in a phylogenetic context · Caudofoveata and Solenogastres · Genome changes and lineage divergence
Every living cell carries clues to its family history: subcellular structures and organelles found across all forms of life reflect common ancestry. Even organisms that look radically different share fundamental cellular machinery; for example, ribosomes synthesize proteins by reading messenger RNA (mRNA) sequences.
7.7 Common Ancestry
Every living cell carries clues to its family history: subcellular structures and organelles found across all forms of life reflect common ancestry. Even organisms that look radically different share fundamental cellular machinery; for example, ribosomes synthesize proteins by reading messenger RNA (mRNA) sequences. These shared components are difficult to explain as independent inventions, but they make sense if modern organisms inherited core cellular features from ancestral life.
Common ancestry is the evolutionary idea that species share ancestors, with differences accumulating as their lineages change over time.
Essential Knowledge: EK 2.1.A.4. Components and organelles contribute to cell function, and structures found across all forms of life reflect common ancestry. In this context, the shared presence of ribosomes is evidence of deep biological relatedness, even though the organisms containing them may differ in anatomy, habitat, and lifestyle.
Reading evolutionary relationships
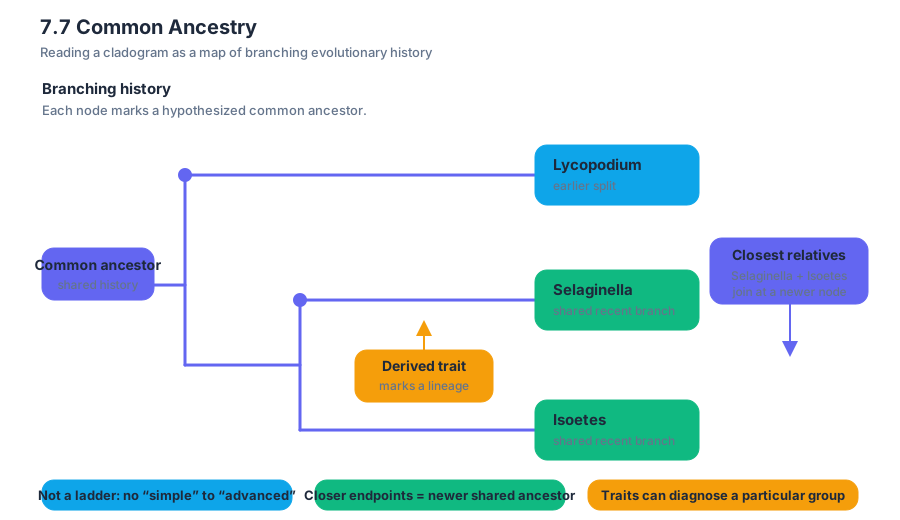
A cladogram is a branching diagram that represents hypothesized evolutionary relationships. Each branch endpoint represents a group or species, while each branching point represents a common ancestor. The closer two endpoints are to one another on the same branching pattern, the more recently they share a common ancestor.
A cladogram is not a ladder ranking organisms from “simple” to “advanced.” It is better understood as a map of branching history. For example, if Selaginella and Isoetes join at a node that is not shared with Lycopodium, the two first species share a more recent common ancestor with each other than either shares with Lycopodium.
A trait placed on a branch or node can be a shared derived character, a feature inherited by members of a particular lineage after it separated from other lineages. In a mollusk comparison, features such as a mantle or radula can help identify the mollusk group. However, the position of a trait matters: a similar feature appearing in separate branches may have evolved independently rather than being inherited from the same recent ancestor.
Out-groups and misleading similarities
An out-group is a related group used as a comparison point when interpreting evolutionary relationships. Because the out-group branches outside the focal group, a character found in both the out-group and some members of the focal group is more likely to represent an ancestral condition; a character found only within a particular focal branch may be a derived character.
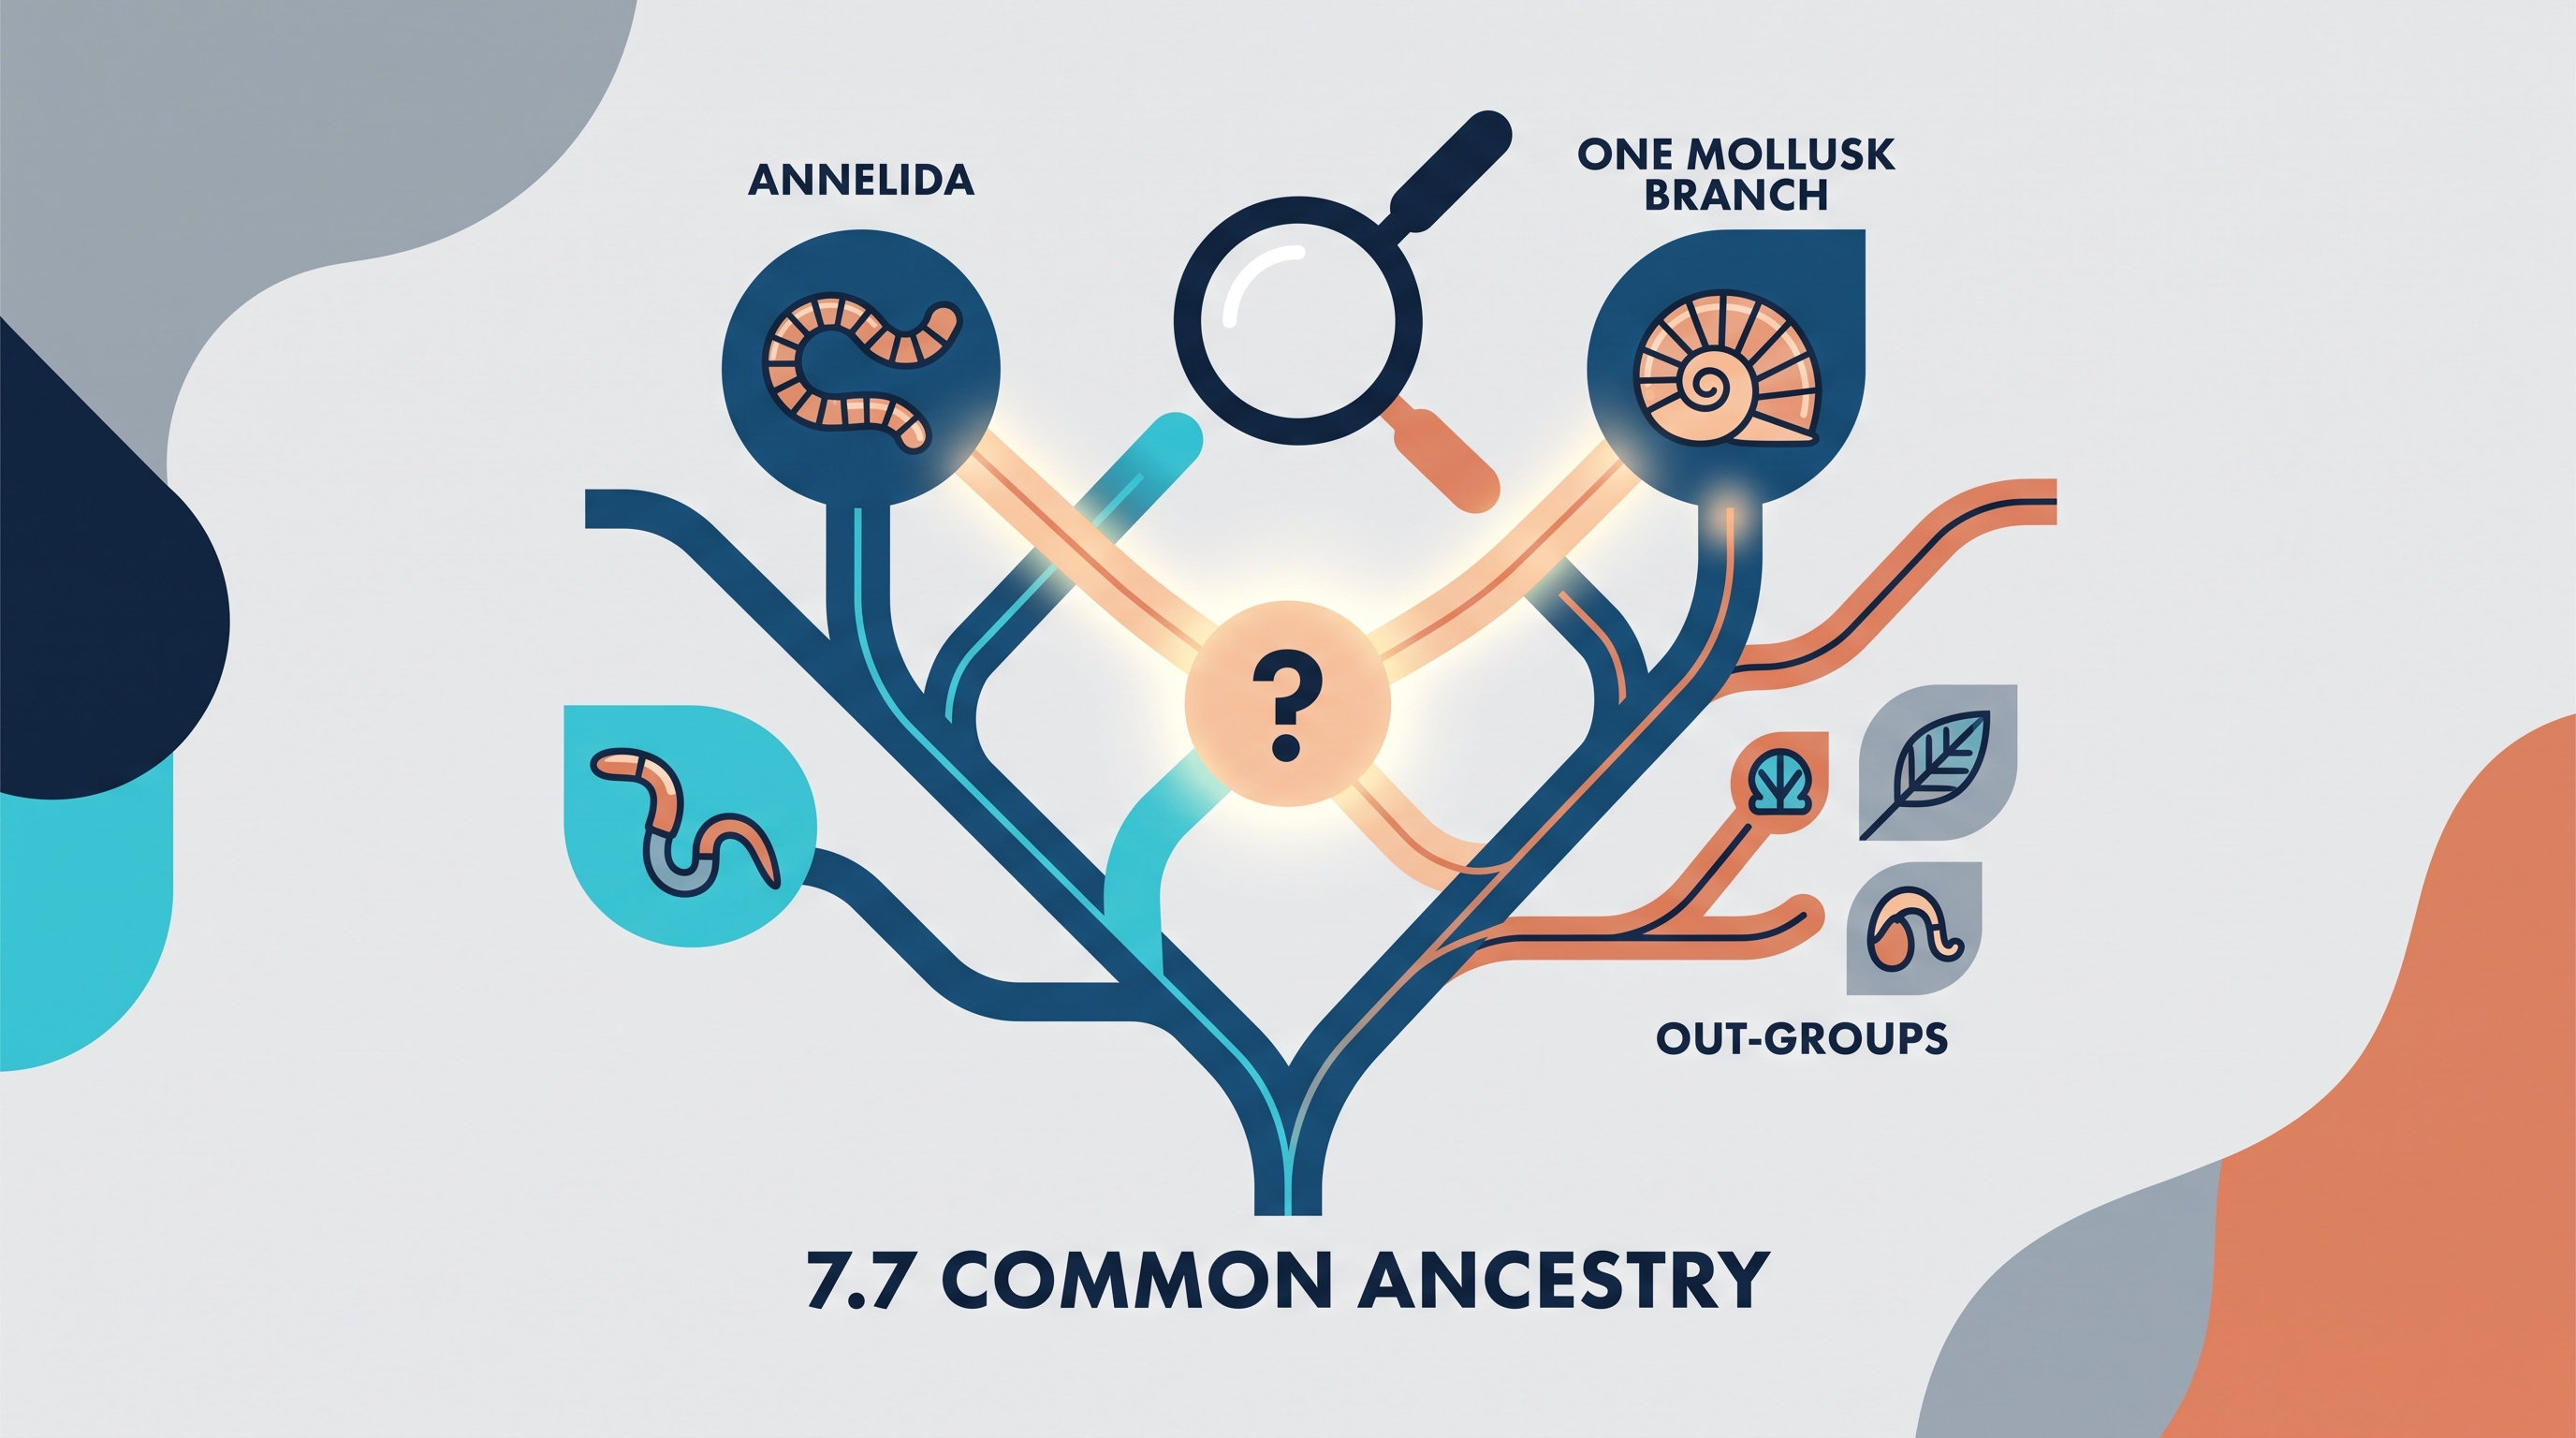
In a figure comparing mollusks with Annelida, Annelida can function as the out-group. The out-group does not mean “less evolved,” and it does not necessarily represent the direct ancestor of the focal organisms. It provides a reference for deciding which traits likely appeared before the focal group diversified.
One visually tricky example is a body with repeated segments. Separate lineages in the figure contain organisms with this feature: annelids have repeated segments, and a particular mollusk lineage also displays repeated segmentation. Because the trait occurs on separate branches, the pattern may represent convergent evolution, also called homoplasy—the independent evolution of similar features in different lineages.
Misconception check: Similar appearance does not automatically prove close relationship. A trait must be interpreted alongside the branching pattern and other characters.
Genome comparisons and BLAST
Anatomical comparisons can be strengthened with molecular evidence. BLAST, or Basic Local Alignment Search Tool, compares a gene sequence with sequences in a database and identifies regions of similarity. A high sequence similarity can support the inference that genes were inherited from a common ancestral gene, although similarity must be interpreted in context rather than treated as absolute proof of a direct ancestor-descendant relationship.
Suppose researchers compare a gene from two mollusk groups. They enter each sequence into BLAST, examine the matching regions, and compare the degree of similarity. If the sequences are especially similar, the corresponding lineages may have shared a more recent common ancestor—or may have experienced fewer changes in that gene since diverging.
Genome changes help explain why descendant lineages differ. Mutations, gene duplication, deletion, and other changes can alter sequences over time; natural selection, genetic drift, and other evolutionary processes then affect which variants persist. Thus, a phylogenetic figure represents both shared inheritance and the changes that accumulated after lineages separated.
Worked interpretation: the mollusk figure
To analyze the figure systematically:
- Locate the branch containing Annelida and use it as the out-group.
- Identify the node where the relevant mollusk lineages join.
- Trace the character “body with repeated segments” to determine whether it appears once or on separate branches.
- Find the numbered node connecting Caudofoveata and Solenogastres.
- Select the node at which those two lineages were most similar in genome sequence—their most recent shared point in the figure.
- Explain group formation by connecting genome changes after divergence to differences among the four mollusk groups and the one invertebrate group.
The key reasoning is that the node represents a shared ancestor, not a modern organism. The farther evolution proceeds away from that node, the more opportunities exist for genome changes to produce differences among descendant lineages.
AP skills and reasoning processes
This topic is especially assessed through Science Practice 1: Concept Explanation, when explaining how shared cellular structures, genome similarity, and evolutionary change support common ancestry; Science Practice 2: Visual Representations, when interpreting cladograms, nodes, branches, and out-groups; Science Practice 5: Statistical Tests and Data Analysis, when comparing sequence-similarity results; and Science Practice 6: Argumentation, when using a cladogram or BLAST result as evidence for a claim about relatedness.
For a strong argument, state a claim, identify the evidence, and connect the evidence to evolutionary reasoning. For example: The two lineages are closely related because their gene sequences are highly similar and they join at a recent node; this pattern is consistent with inheritance from a relatively recent common ancestor.
Retrieval check
A cladogram shows repeated segmentation in Annelida and in one mollusk branch. Does that automatically establish that the two groups inherited the trait from their most recent common ancestor? Explain why an out-group and the locations of the traits on the branches are needed before deciding.