From the free course AP Biology on Lykke
7.6 Evidence of Evolution
Key concepts: Evidence for evolution · Phylogenetic trees · Cladograms · Protein sequence similarities · Evolution as an ongoing process · Changes in the genetic makeup of populations · Allele and genotype frequencies · Hardy-Weinberg mathematical modeling · Interpreting biological data from tables and graphs · Designing investigations based on evidence
Evolution leaves evidence at several scales: DNA and protein sequences reveal molecular similarity, fossils record change through time, and living populations can change genetically while we observe them.
7.6 Evidence of Evolution
Evolution leaves evidence at several scales: DNA and protein sequences reveal molecular similarity, fossils record change through time, and living populations can change genetically while we observe them. The central claim is not that organisms merely resemble one another, but that measurable biological patterns support hypotheses about how populations and lineages have changed.
Evolution is characterized by changes in the genetic makeup of a population over time.
This definition focuses on populations rather than individual organisms. An individual cannot evolve during its lifetime by changing its inherited allele frequencies; a population evolves when the proportions of alleles or genotypes shift across generations. This is the biological meaning behind the Big Idea 1 statement that evolution drives both the diversity and the unity of life.
Evidence at the molecular level
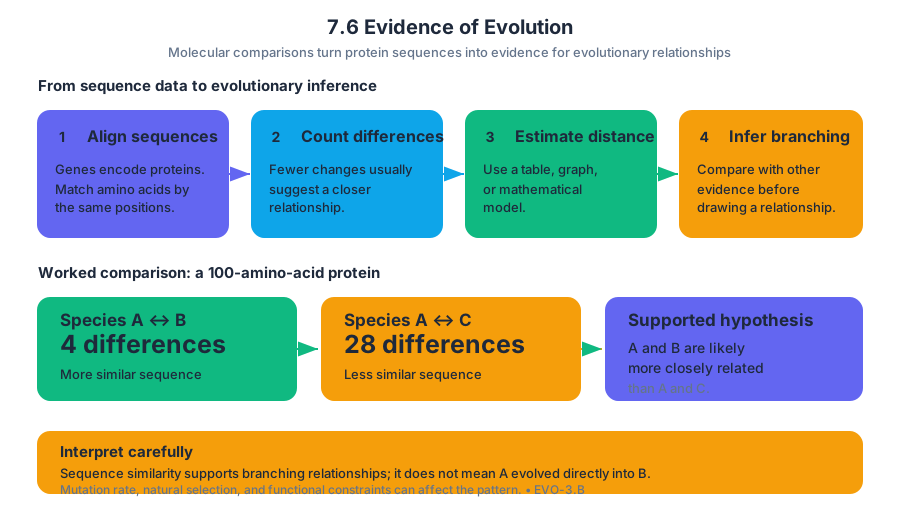
Protein sequences can be compared because proteins are encoded by genes. If two organisms possess proteins with many matching amino acids in the same positions, their genes may have been inherited from a relatively recent common lineage. Fewer sequence differences generally suggest a more distant relationship, although mutation rate, natural selection, and functional constraints must also be considered.
For example, suppose a protein contains $100$ amino acids. Species A and B differ at $4$ positions, while Species A and C differ at $28$ positions. The sequence comparison supports the hypothesis that A and B are more closely related than A and C. It does not prove that A evolved directly into B: the comparison is evidence for branching evolutionary relationships, not a simple ladder from “primitive” to “advanced.”
A strong molecular comparison uses aligned sequences, counts differences, and asks whether the pattern agrees with other evidence. This is associated with EVO-3.B: Describe the types of evidence that can be used to infer an evolutionary relationship. A table of sequence differences, a graph of genetic distance, or a mathematical model can all become evidence when interpreted biologically rather than merely reported.
Reading phylogenetic trees and cladograms
A phylogenetic tree or cladogram is a diagram representing a hypothetical evolutionary relationship among organisms. The branching pattern proposes which groups share more recent common ancestry; it does not show that one modern species is the ancestor of another.
In a tree, a node represents a hypothesized common ancestor or splitting event. A clade contains an ancestor and all of its descendants. The order of species along the page is usually irrelevant: rotating branches around a node does not change the relationships. What matters is which pairs share the most recent node.
Trees and cladograms are hypotheses that are constantly revised as new evidence becomes available.
This is the focus of 7.9.B and 7.9.B.3, which require explaining how phylogenetic trees and cladograms can be used to infer evolutionary relatedness. A defensible interpretation identifies shared nodes, compares branching points, and connects the proposed relationship to evidence such as protein sequences, DNA data, fossils, or anatomical traits.
Evolution happening now
Evolution is an ongoing process in all living organisms. Evidence includes genomic changes over time, continuing changes in the fossil record, resistance to antibiotics, pesticides, herbicides, or chemotherapy drugs, and pathogens that evolve in ways associated with emerging diseases. In each case, the key observation is a change in the genetic composition of a population.
When evolutionary conditions are present, allele and genotype frequencies can change. The conditions summarized by EVO-1.K identify when these frequencies change, while EVO-1.L concerns the population impacts when Hardy-Weinberg conditions are not met. The Hardy-Weinberg model therefore functions as a baseline: observed departures from its expectations can help investigators examine whether evolutionary forces are acting.
Worked investigation: stomata and atmospheric carbon dioxide
Stomata—microscopic openings that regulate gas exchange in leaves—provide a testable example. If atmospheric carbon dioxide changes, plants may experience different selection pressures on stomatal number, density, or behavior. A researcher could compare fossil leaves from periods with different estimated carbon dioxide concentrations and measure stomatal density using the same leaf-area standard.
A complete claim would connect evidence to mechanism: “Leaves from the higher-carbon-dioxide interval have lower stomatal density.” The reasoning would then explain that reduced stomatal density may limit unnecessary water loss while still permitting sufficient carbon dioxide uptake. The claim becomes stronger if the pattern is replicated across species, sites, and independently dated samples; correlation alone does not establish the evolutionary mechanism.
This illustrates Skill 4.B: Describe data from a table or graph, because the investigator must identify trends without confusing description with explanation. It also uses Skill 5.A: Perform mathematical calculations when comparing means or sequence differences, and Skill 3.D: Propose a new investigation based on an evaluation of the experimental design or evidence when existing evidence suggests a follow-up experiment.
Misconception check
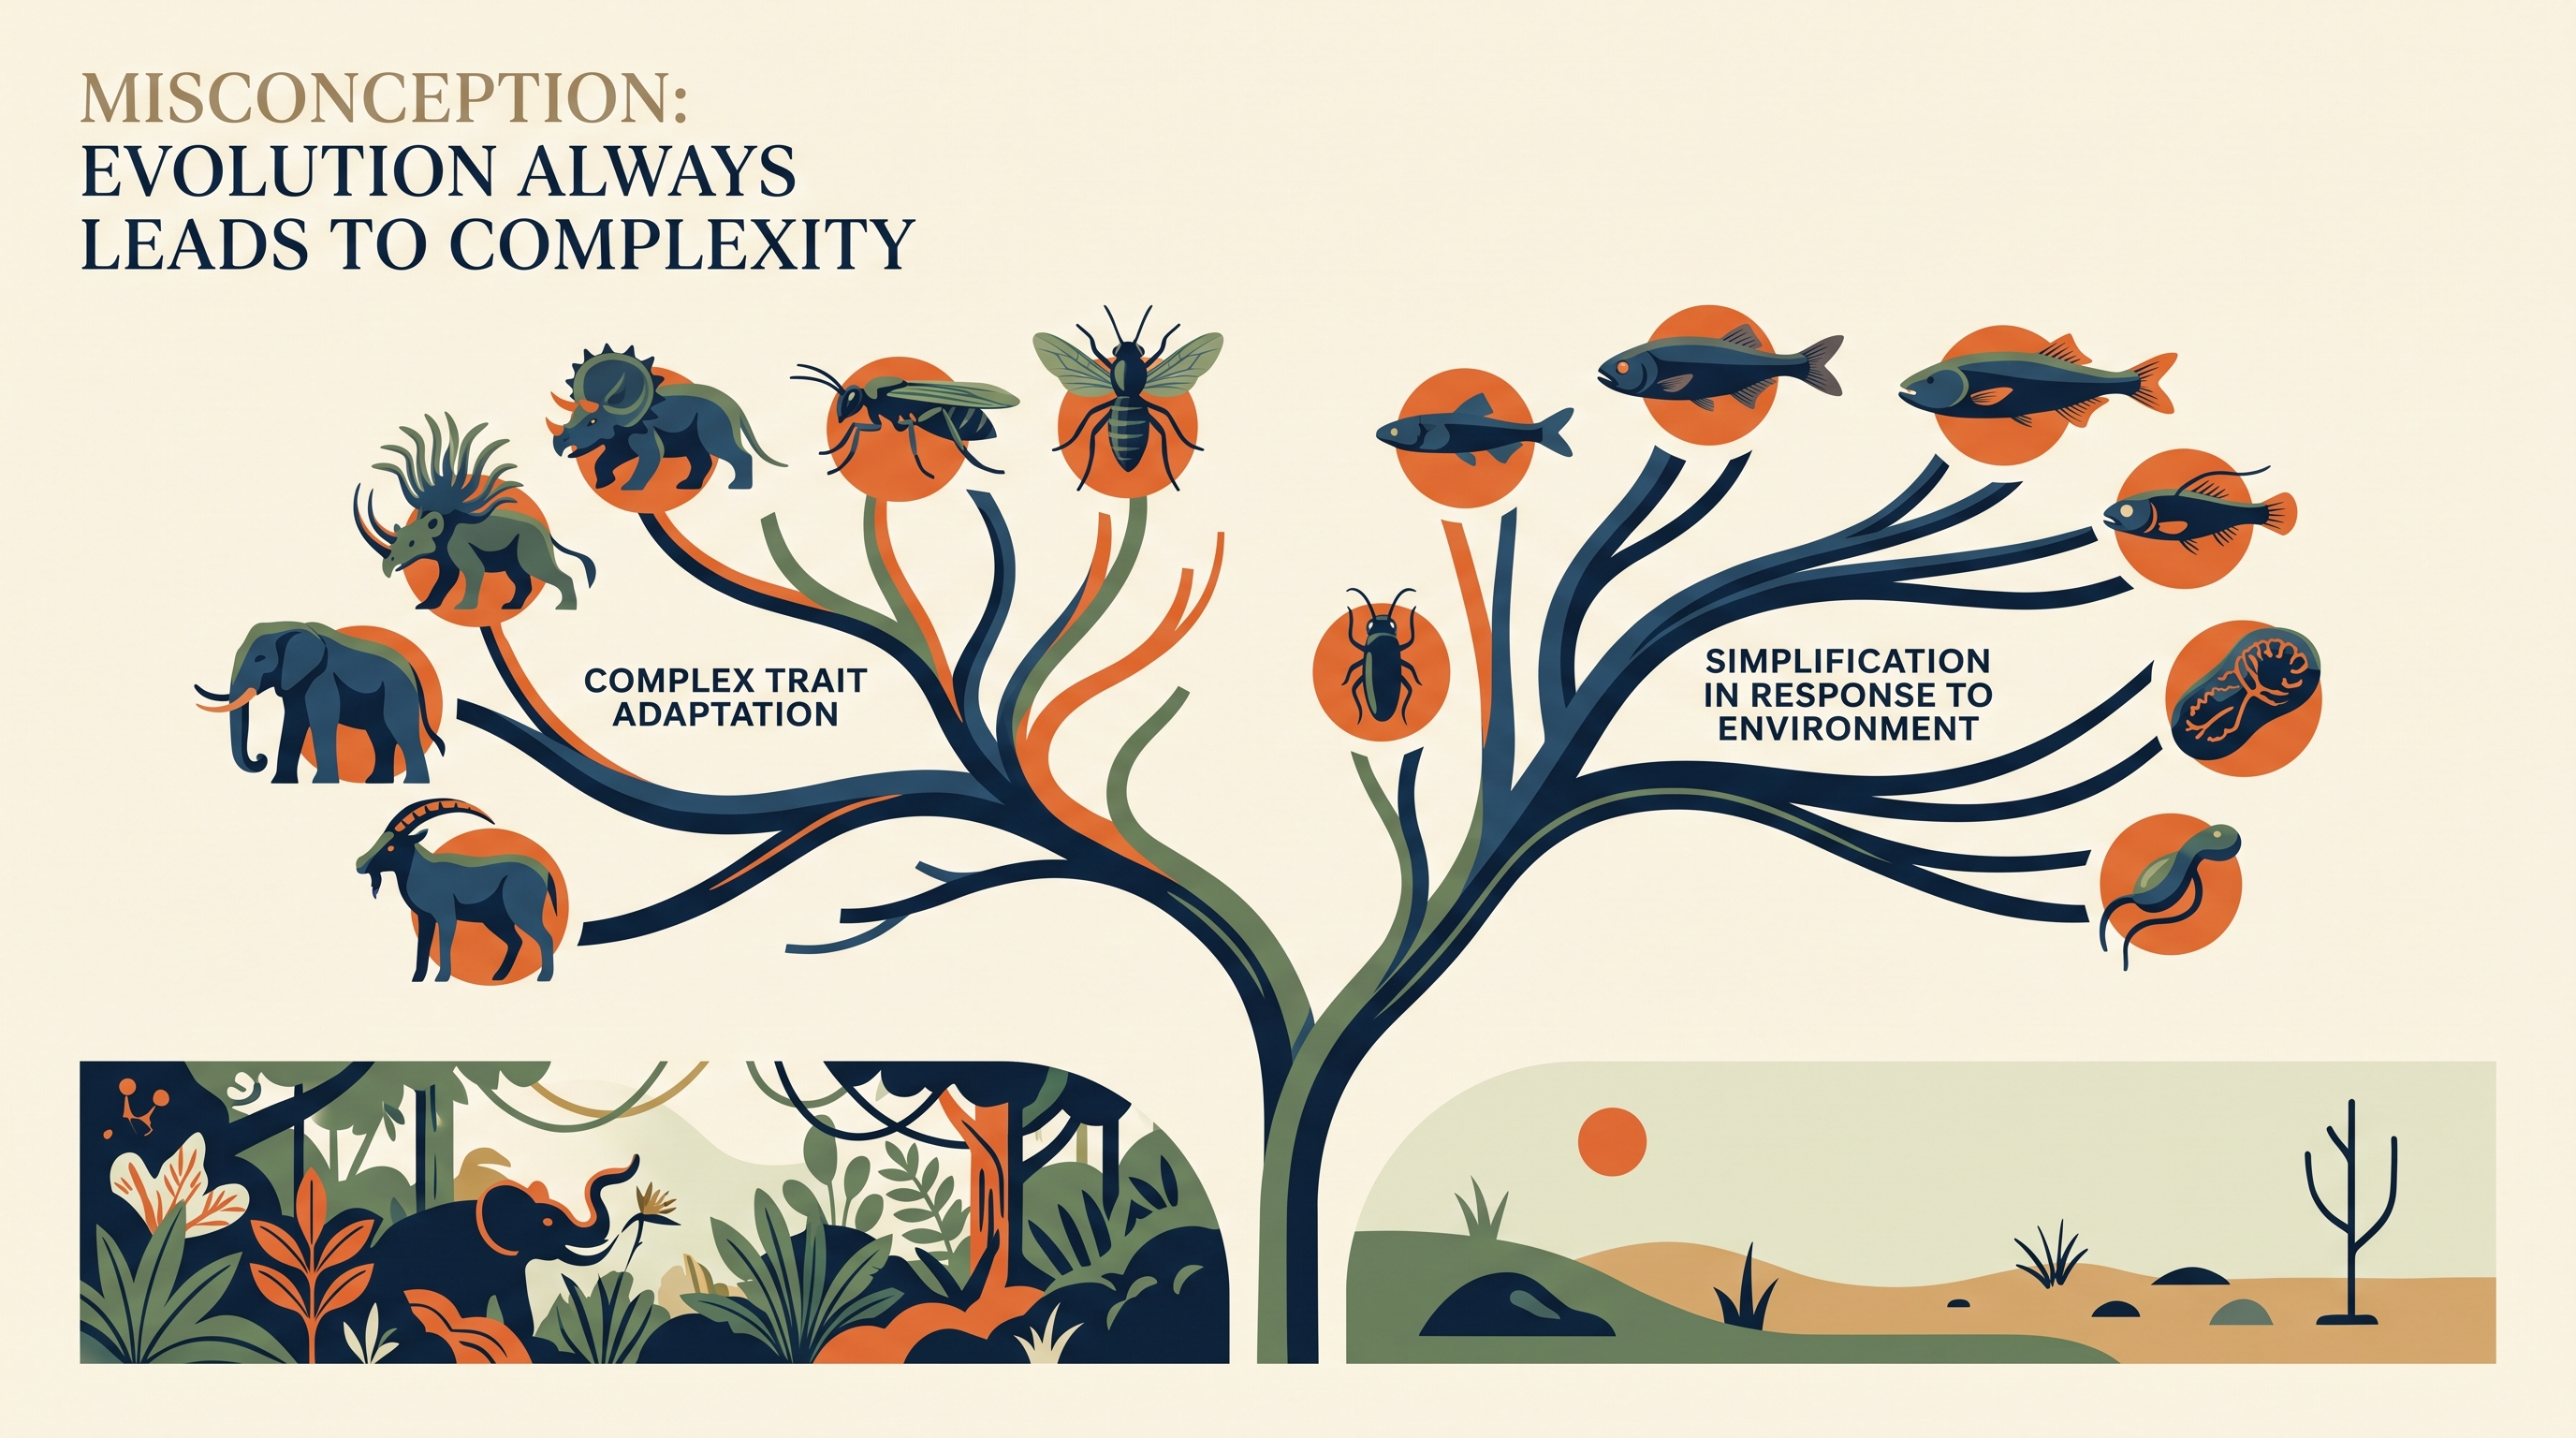
Misconception: “Evolution always makes organisms more complex or better.” Evolution changes genetic frequencies in response to forces such as selection, mutation, migration, and genetic drift. A trait can be advantageous in one environment and disadvantageous in another, and evolutionary change can occur without producing greater complexity.
Retrieval check: A cladogram shows species X and Y joining at the most recent shared node, while species Z joins earlier. Which relationship is supported, and what additional evidence could test the hypothesis? The supported conclusion is that X and Y are hypothesized to be more closely related than either is to Z; aligned protein sequences, DNA comparisons, fossils, or anatomical data could provide an independent test.