From the free course AP Biology on Lykke
5.5 Environmental Effects on Phenotype
Key concepts: Environmental factors influence phenotype and biological processes · Soil pH can affect flower color · Herbivory can elicit a plant response · Phototactic and chemotactic responses may interact · Environmental factors affect plant growth and productivity · Environmental variables influence transpiration rates · Experimental controls are used to isolate environmental effects · Fruit flies respond behaviorally to environmental repellents · pH affects enzymatic activity · Biotic and abiotic factors influence the rate of enzymatic reactions
An organism’s phenotype—its observable traits and biological responses—depends not only on its genes but also on the environment in which those genes are expressed. The same plant genotype may produce different flower colors, growth rates, or defense structures under different environmental conditions.
5.5 Environmental Effects on Phenotype
An organism’s phenotype—its observable traits and biological responses—depends not only on its genes but also on the environment in which those genes are expressed. The same plant genotype may produce different flower colors, growth rates, or defense structures under different environmental conditions.
CED alignment: Learning Objective 5.5.A; Essential Knowledge 5.5.A.1; Suggested Skill 1.C Explanation of Concepts.
Environment can change phenotype
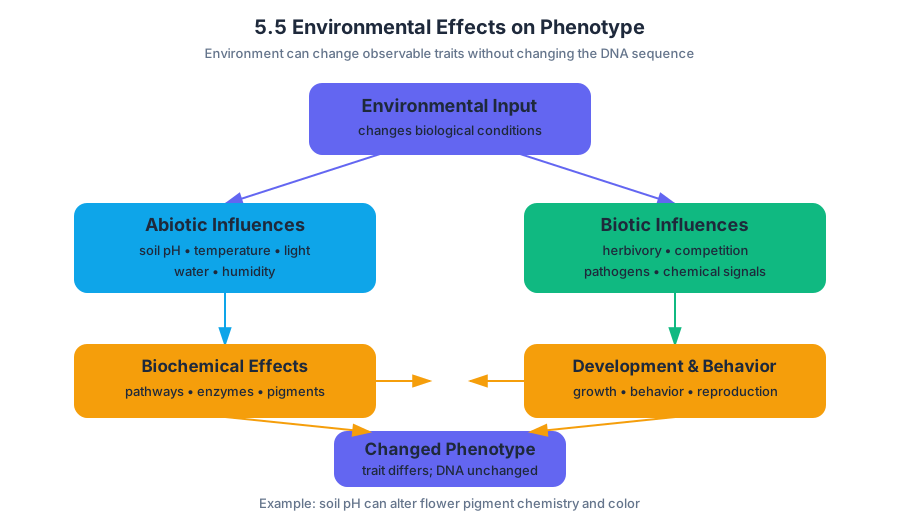
Environmental factors include abiotic influences, such as soil pH, temperature, light, water availability, and humidity, and biotic influences, such as herbivory, competition, pathogens, and chemical signals from other organisms. These factors can alter biochemical pathways, developmental patterns, behavior, and reproductive success without changing the organism’s DNA sequence.
A familiar example is flower color. In some plants, soil pH changes the chemical form of pigments in developing flowers. A plant growing in acidic soil may produce flowers with a different color from a genetically similar plant growing in more basic soil. The environmental variable—soil pH—has changed the phenotype by influencing pigment chemistry.
The same logic applies to enzymes. If changing pH changes the rate of an enzyme-catalyzed reaction, pH is affecting biological activity through the enzyme’s chemical environment. A useful investigation could place equal amounts of enzyme and substrate into buffers with different pH values, measure product formation per unit time, and compare the reaction rates. Because pH is nonliving, it is an abiotic influence; herbivory, by contrast, is a biotic influence.
Herbivory can trigger a measurable response
Herbivory is feeding by an animal on a plant. It can produce an observable plant response rather than merely removing tissue. For example, feeding may stimulate increased trichome production, activate chemical defenses, change the timing of defense responses, or alter the plant’s ability to tolerate later damage. These responses are examples of phenotype plasticity: environmentally induced changes in phenotype.
A researcher could compare undamaged plants with plants exposed to a controlled amount of leaf damage. After a defined time, the researcher might count trichomes per unit leaf area, measure defense-compound concentration, or compare subsequent growth. The response becomes scientifically useful only when it is converted into a measurable dependent variable.
Misconception check: “If the environment affects a trait, the organism evolved during the experiment.”
Not necessarily. A short-term response to herbivory or pH is a change in phenotype. Evolution requires a change in heritable allele frequencies across generations.
Behavioral responses can interact
A phototactic response is movement in response to light; a chemotactic response is movement in response to a chemical. These cues may point in different directions, so one response does not automatically override the other. The outcome depends on factors such as cue intensity, receptor sensitivity, the organism’s physiological state, and whether one stimulus is attractive or aversive.
For example, fruit flies placed in a choice chamber might move toward a lighted region but away from an environmental repellent, such as an aversive odor. To test the response, place flies in a chamber divided into two connected zones. First measure their distribution under identical conditions; then introduce the repellent into one zone while keeping light conditions constant. A stronger response is supported if flies occupy the non-repellent zone more often than in the control condition.
The control chamber establishes baseline movement and detects side preference. Replication with many flies and repeated trials helps distinguish avoidance of the repellent from random movement, crowding, or attraction to the opposite side. If light and odor cues conflict, the data—not an assumption that phototaxis always dominates—must show which cue has the greater behavioral effect.
Environmental factors affect growth and productivity
Plant growth can be represented with a mathematical model. When resources are abundant, early growth may approximate exponential growth:
$$\frac{dN}{dt}=rN$$
Here, $N$ is plant biomass or population size, $t$ is time, and $r$ is the per-unit growth rate. As nutrients, water, space, or light become limiting, a logistic model is more realistic:
$$\frac{dN}{dt}=rN\left(1-\frac{N}{K}\right)$$
The carrying capacity $K$ represents the maximum biomass or population size that the environment can sustain. Environmental changes can alter $r$, $K$, or both. For example, increased carbon dioxide might raise photosynthetic productivity under some conditions, while drought may lower growth and reduce $K$.
Investigating transpiration
Transpiration is the loss of water vapor from plant surfaces, especially through stomata. A strong hypothesis identifies an environmental factor and predicts its effect: “Increasing air movement will increase transpiration rate because moving air removes the humid boundary layer near the leaf.” Other testable variables include light intensity, humidity, temperature, and wind.
In a potometer investigation, change one environmental variable while keeping plant species, leaf area, time interval, and apparatus constant. Record water movement per unit time as the transpiration rate. Pressure data may be recorded in kilopascals, written $\text{kPa}$; the kilopascal is a unit of pressure.
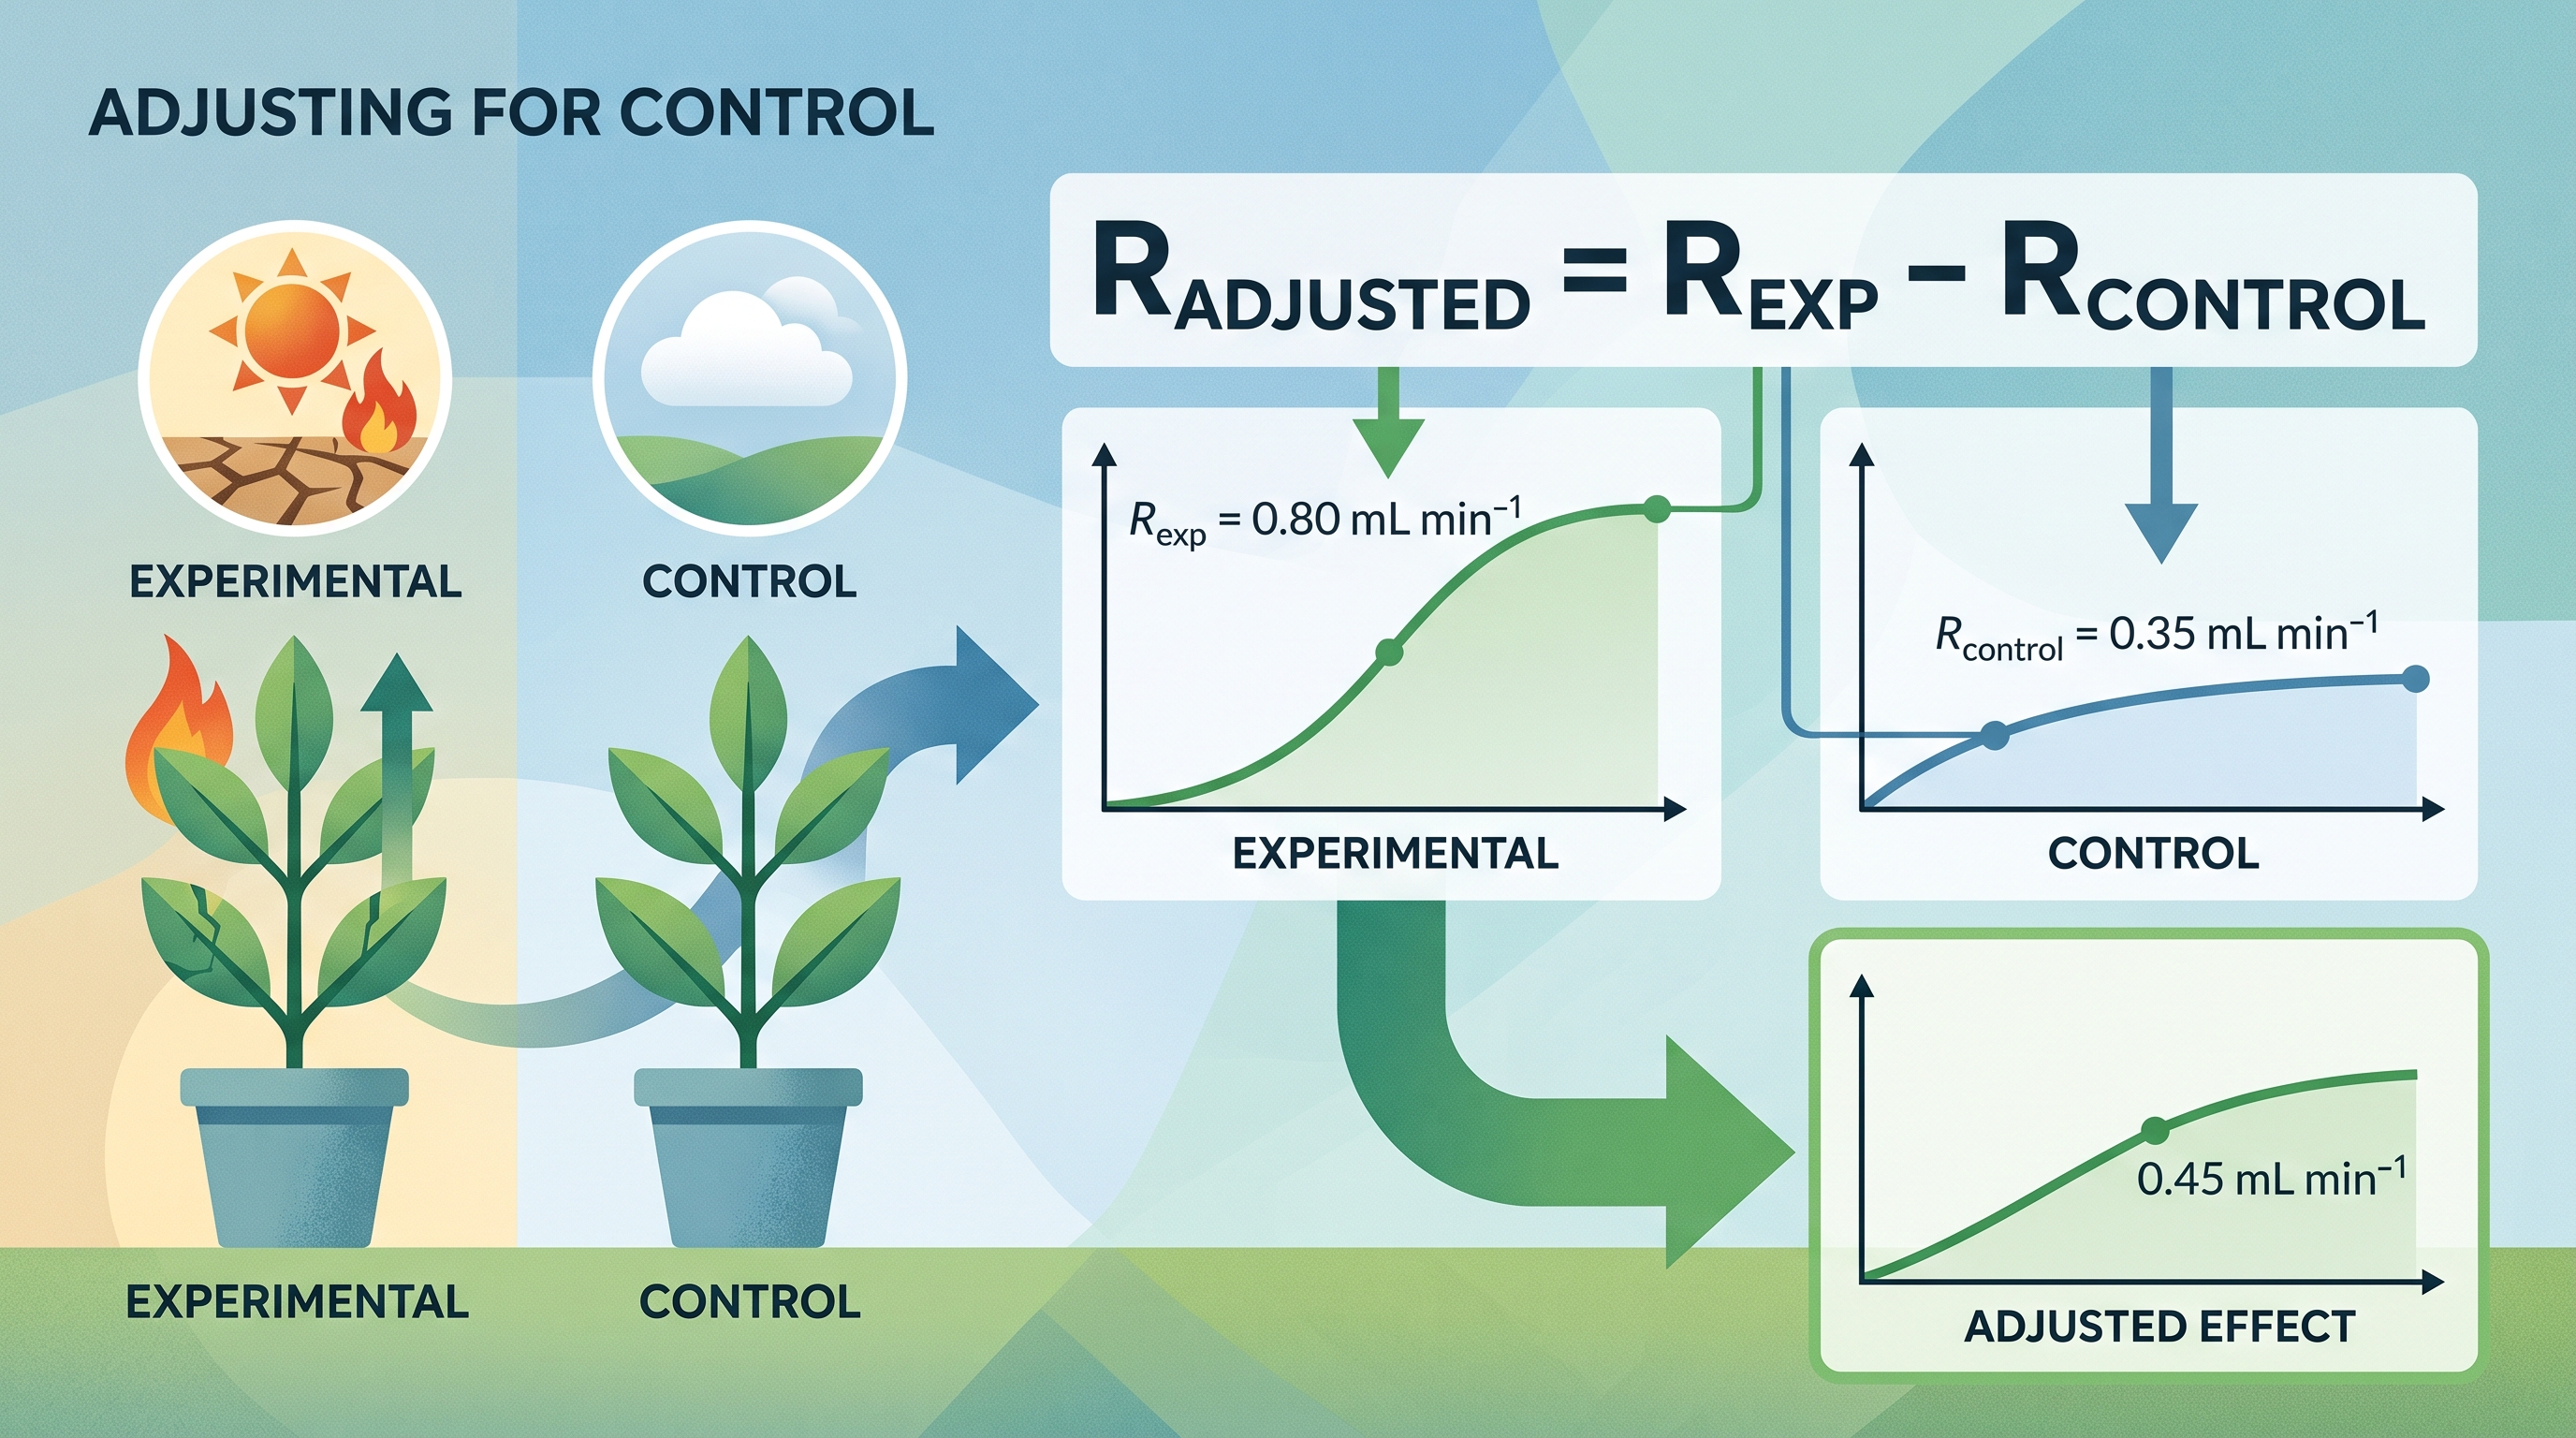
An appropriate control experiences the same setup without the experimental environmental change. If the experimental rate is $R_{\text{exp}}$ and the control rate is $R_{\text{control}}$, calculate:
$$R_{\text{adjusted}}=R_{\text{exp}}-R_{\text{control}}$$
For example, if a treated plant has a rate of $0.80\ \text{mL min}^{-1}$ and the control rate is $0.35\ \text{mL min}^{-1}$, then:
$$R_{\text{adjusted}}=0.80-0.35=0.45\ \text{mL min}^{-1}$$
A graph of adjusted rates allows groups to compare environmental effects more fairly.
Retrieval check: A plant exposed to low humidity loses water at $1.10\ \text{mL min}^{-1}$; its control loses water at $0.70\ \text{mL min}^{-1}$. What is the adjusted rate, and why is the control necessary?
AP skills in this topic: 1.C Explanation of Concepts explains the mechanism linking environment to phenotype; 2.A Visual Representations displays growth curves, choice-chamber distributions, and transpiration graphs; 3.A Questions and Methods develops hypotheses, controls, and experimental designs; 4.A Representing and Describing Data constructs labeled graphs and identifies patterns; 5.A Statistical Tests and Data Analysis compares variation among treatments and controls; and 6.A Argumentation uses evidence to support or revise a claim about environmental effects.