From the free course AP Biology on Lykke
AP Practice 3
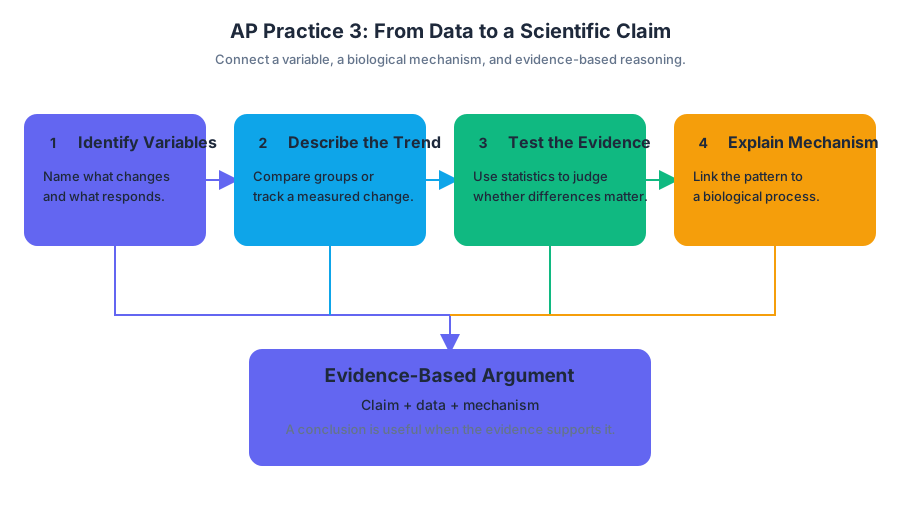
A biological claim becomes scientifically useful only when evidence supports it. In a data-based free-response task, the goal is not merely to identify a trend; it is to connect a variable, a biological mechanism, and a defensible conclusion.
AP Practice 3
A biological claim becomes scientifically useful only when evidence supports it. In a data-based free-response task, the goal is not merely to identify a trend; it is to connect a variable, a biological mechanism, and a defensible conclusion.
This original practice task focuses on interpreting experimental data, explaining a biological relationship, and constructing an evidence-based argument. It especially activates Science Practice 1: Concept Explanation, Science Practice 4: Representing and Describing Data, Science Practice 5: Statistical Tests and Data Analysis, and Science Practice 6: Argumentation.
Original data-based practice task
Researchers investigated how temperature affects the activity of catalase, an enzyme that breaks down hydrogen peroxide. Equal amounts of catalase extract were placed into separate reaction mixtures maintained at different temperatures. The rate of oxygen production was used as an estimate of catalase activity.
| Temperature | Mean oxygen production rate |
|---|---|
| $10^\circ\text{C}$ | $2.1\ \text{mL min}^{-1}$ |
| $20^\circ\text{C}$ | $4.8\ \text{mL min}^{-1}$ |
| $30^\circ\text{C}$ | $7.2\ \text{mL min}^{-1}$ |
| $40^\circ\text{C}$ | $5.9\ \text{mL min}^{-1}$ |
| $50^\circ\text{C}$ | $1.4\ \text{mL min}^{-1}$ |
(a) Identify the independent variable and dependent variable in the investigation.
(b) Describe the relationship between temperature and catalase activity from $10^\circ\text{C}$ to $50^\circ\text{C}$.
(c) Explain the decrease in catalase activity between $40^\circ\text{C}$ and $50^\circ\text{C}$.
(d) Propose one controlled variable that should be kept constant and explain why controlling it improves the investigation.
(e) The researchers claim that catalase functions most effectively near $30^\circ\text{C}$. Evaluate whether the data support the claim.
Worked reasoning
Part (a): Identify variables
The independent variable is temperature because the researchers deliberately changed it. The dependent variable is the rate of oxygen production because it was measured as the response.
A common error is naming oxygen production as the independent variable because it appears in the results. The deciding question is: Which factor did the researchers manipulate? The manipulated factor is the independent variable; the measured outcome is the dependent variable.
Part (b): Describe the pattern
Catalase activity increases as temperature rises from $10^\circ\text{C}$ to $30^\circ\text{C}$, reaching a maximum measured rate of $7.2\ \text{mL min}^{-1}$. Activity then decreases at $40^\circ\text{C}$ and falls sharply at $50^\circ\text{C}$.
A strong description reports the overall pattern and uses specific data. “Temperature affects the enzyme” is too vague because it does not identify the direction, the turning point, or the relevant measurements.
Part (c): Explain the mechanism
At temperatures above the enzyme’s optimal range, increased molecular motion can disrupt the interactions that maintain catalase’s three-dimensional shape. Changes to the enzyme’s shape can alter the active site, reducing the enzyme’s ability to bind hydrogen peroxide and catalyze its breakdown.
Key distinction: High temperature can reduce enzyme activity by changing protein structure; it does not necessarily destroy the substrate.
This explanation earns more biological credit than “the enzyme gets too hot.” It links the environmental change to protein structure, active-site function, and reaction rate.
Part (d): Control an alternative explanation
The concentration of hydrogen peroxide should remain constant in every reaction mixture. If substrate concentration changed between treatments, differences in oxygen production could result from unequal substrate availability rather than temperature.
Other defensible controlled variables include the amount of catalase extract, reaction volume, reaction time, and pH. A variable is not automatically a good control merely because it is present; the response must explain how changing it could affect the measured rate.
Part (e): Evaluate the claim
The data support the claim that catalase functions most effectively near $30^\circ\text{C}$ because the highest measured oxygen-production rate occurred at $30^\circ\text{C}$: $7.2\ \text{mL min}^{-1}$. However, the data do not establish that exactly $30^\circ\text{C}$ is the true optimum because temperatures between the tested values were not examined.
This is an argument, not a repetition of the table: the claim is stated, numerical evidence is cited, and a limitation is identified. The cautious conclusion is that $30^\circ\text{C}$ produced the highest activity among the temperatures tested.
Timing and scoring logic
Allow approximately $12$–$15$ minutes for a task of this size. First identify what each command asks for: identify requires a label, describe requires a pattern supported by data, explain requires a biological mechanism, propose requires a reasonable experimental choice, and evaluate requires a claim supported by evidence and qualified by limitations.
The strongest responses make the reasoning visible. A useful evidence chain is:
$$ \text{experimental change} \rightarrow \text{biological mechanism} \rightarrow \text{measured response} \rightarrow \text{conclusion} $$
For this task:
$$ \text{higher temperature} \rightarrow \text{altered catalase structure} \rightarrow \text{reduced active-site function} \rightarrow \text{lower oxygen-production rate} $$
Error-review routine
After completing the task, classify each missed or weak point as one of four errors: data error—the numerical trend was misread; command error—the response did not perform the requested action; mechanism error—the explanation lacked a biological cause; or argument error—the conclusion lacked evidence or ignored a limitation.
Retrieval check: If the catalase extract were boiled before the experiment, predict the effect on oxygen production and explain your prediction using protein structure and enzyme function.

Source Materials
- Ap Biology Course And Exam Description
- Ap Biology Course Overview
- Ap Biology Course At A Glance
- Ap Biology Equations And Formulas Sheet
- Chapter 3 Quantitative Skills In Ap Sciences
- Ap Biology Teacher Lab Manual Effective Fall 2019
- Updates 2025 26
- AP Biology Course-AP Central-College Board
- AP Biology-AP Students
- Biology of AP Courses-OpenStax
- AP Biology-Acellus
- AP/College Biology