From the free course AP Biology on Lykke
3.4 Photosynthesis
Key concepts: Photosynthesis rate measurement using the floating leaf-disk technique · Experimental design for investigating factors that affect photosynthesis · Light-intensity response curves · Comparing sun-grown and shade-grown leaves · Photosynthetically active radiation (PAR) as a light measurement · ET50 as a photosynthesis-response metric · Using inverse ET50 (1/ET50) to represent photosynthesis rate · Calculating photosynthesis rates and ratios · Calculating water potential · Graphing data and interpreting error bars
A leaf can reveal its photosynthetic rate without producing a visible bubble: remove air from a leaf disk, place it in an illuminated bicarbonate solution, and watch oxygen gradually make the disk rise.
3.4 Photosynthesis
A leaf can reveal its photosynthetic rate without producing a visible bubble: remove air from a leaf disk, place it in an illuminated bicarbonate solution, and watch oxygen gradually make the disk rise. The floating leaf-disk technique converts an invisible molecular process into a measurable time course.
Investigative question: What factors affect the rate of photosynthesis in living plants?
Measuring photosynthetic activity with floating disks
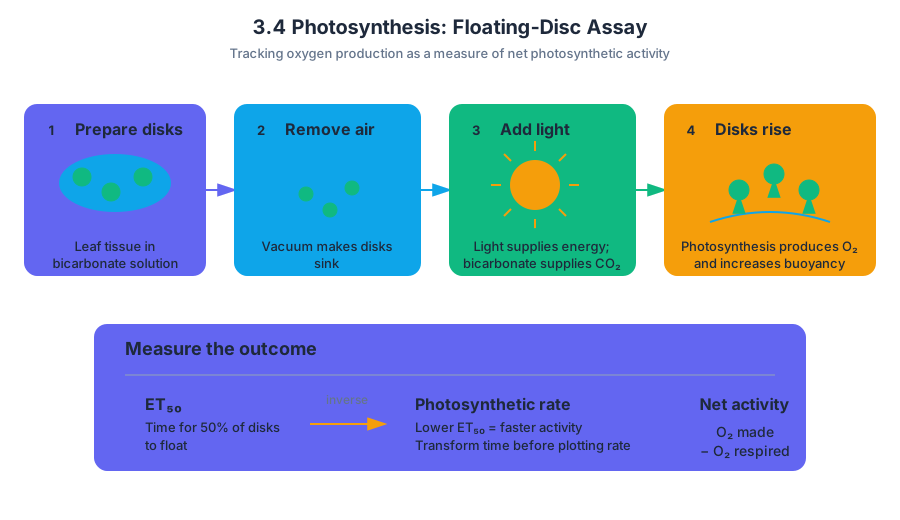
The net rate of photosynthesis can be estimated from either oxygen production or carbon dioxide consumption. In the disk procedure, a vacuum removes air from the spaces inside leaf tissue, causing the disks to sink. As photosynthesis produces oxygen, oxygen accumulates in those spaces; the disks become buoyant and rise.
A bicarbonate solution supplies dissolved carbon dioxide while the light provides the energy source. Because respiration continues during the experiment, the observed change represents net photosynthetic activity: oxygen produced by photosynthesis minus oxygen consumed by cellular respiration.
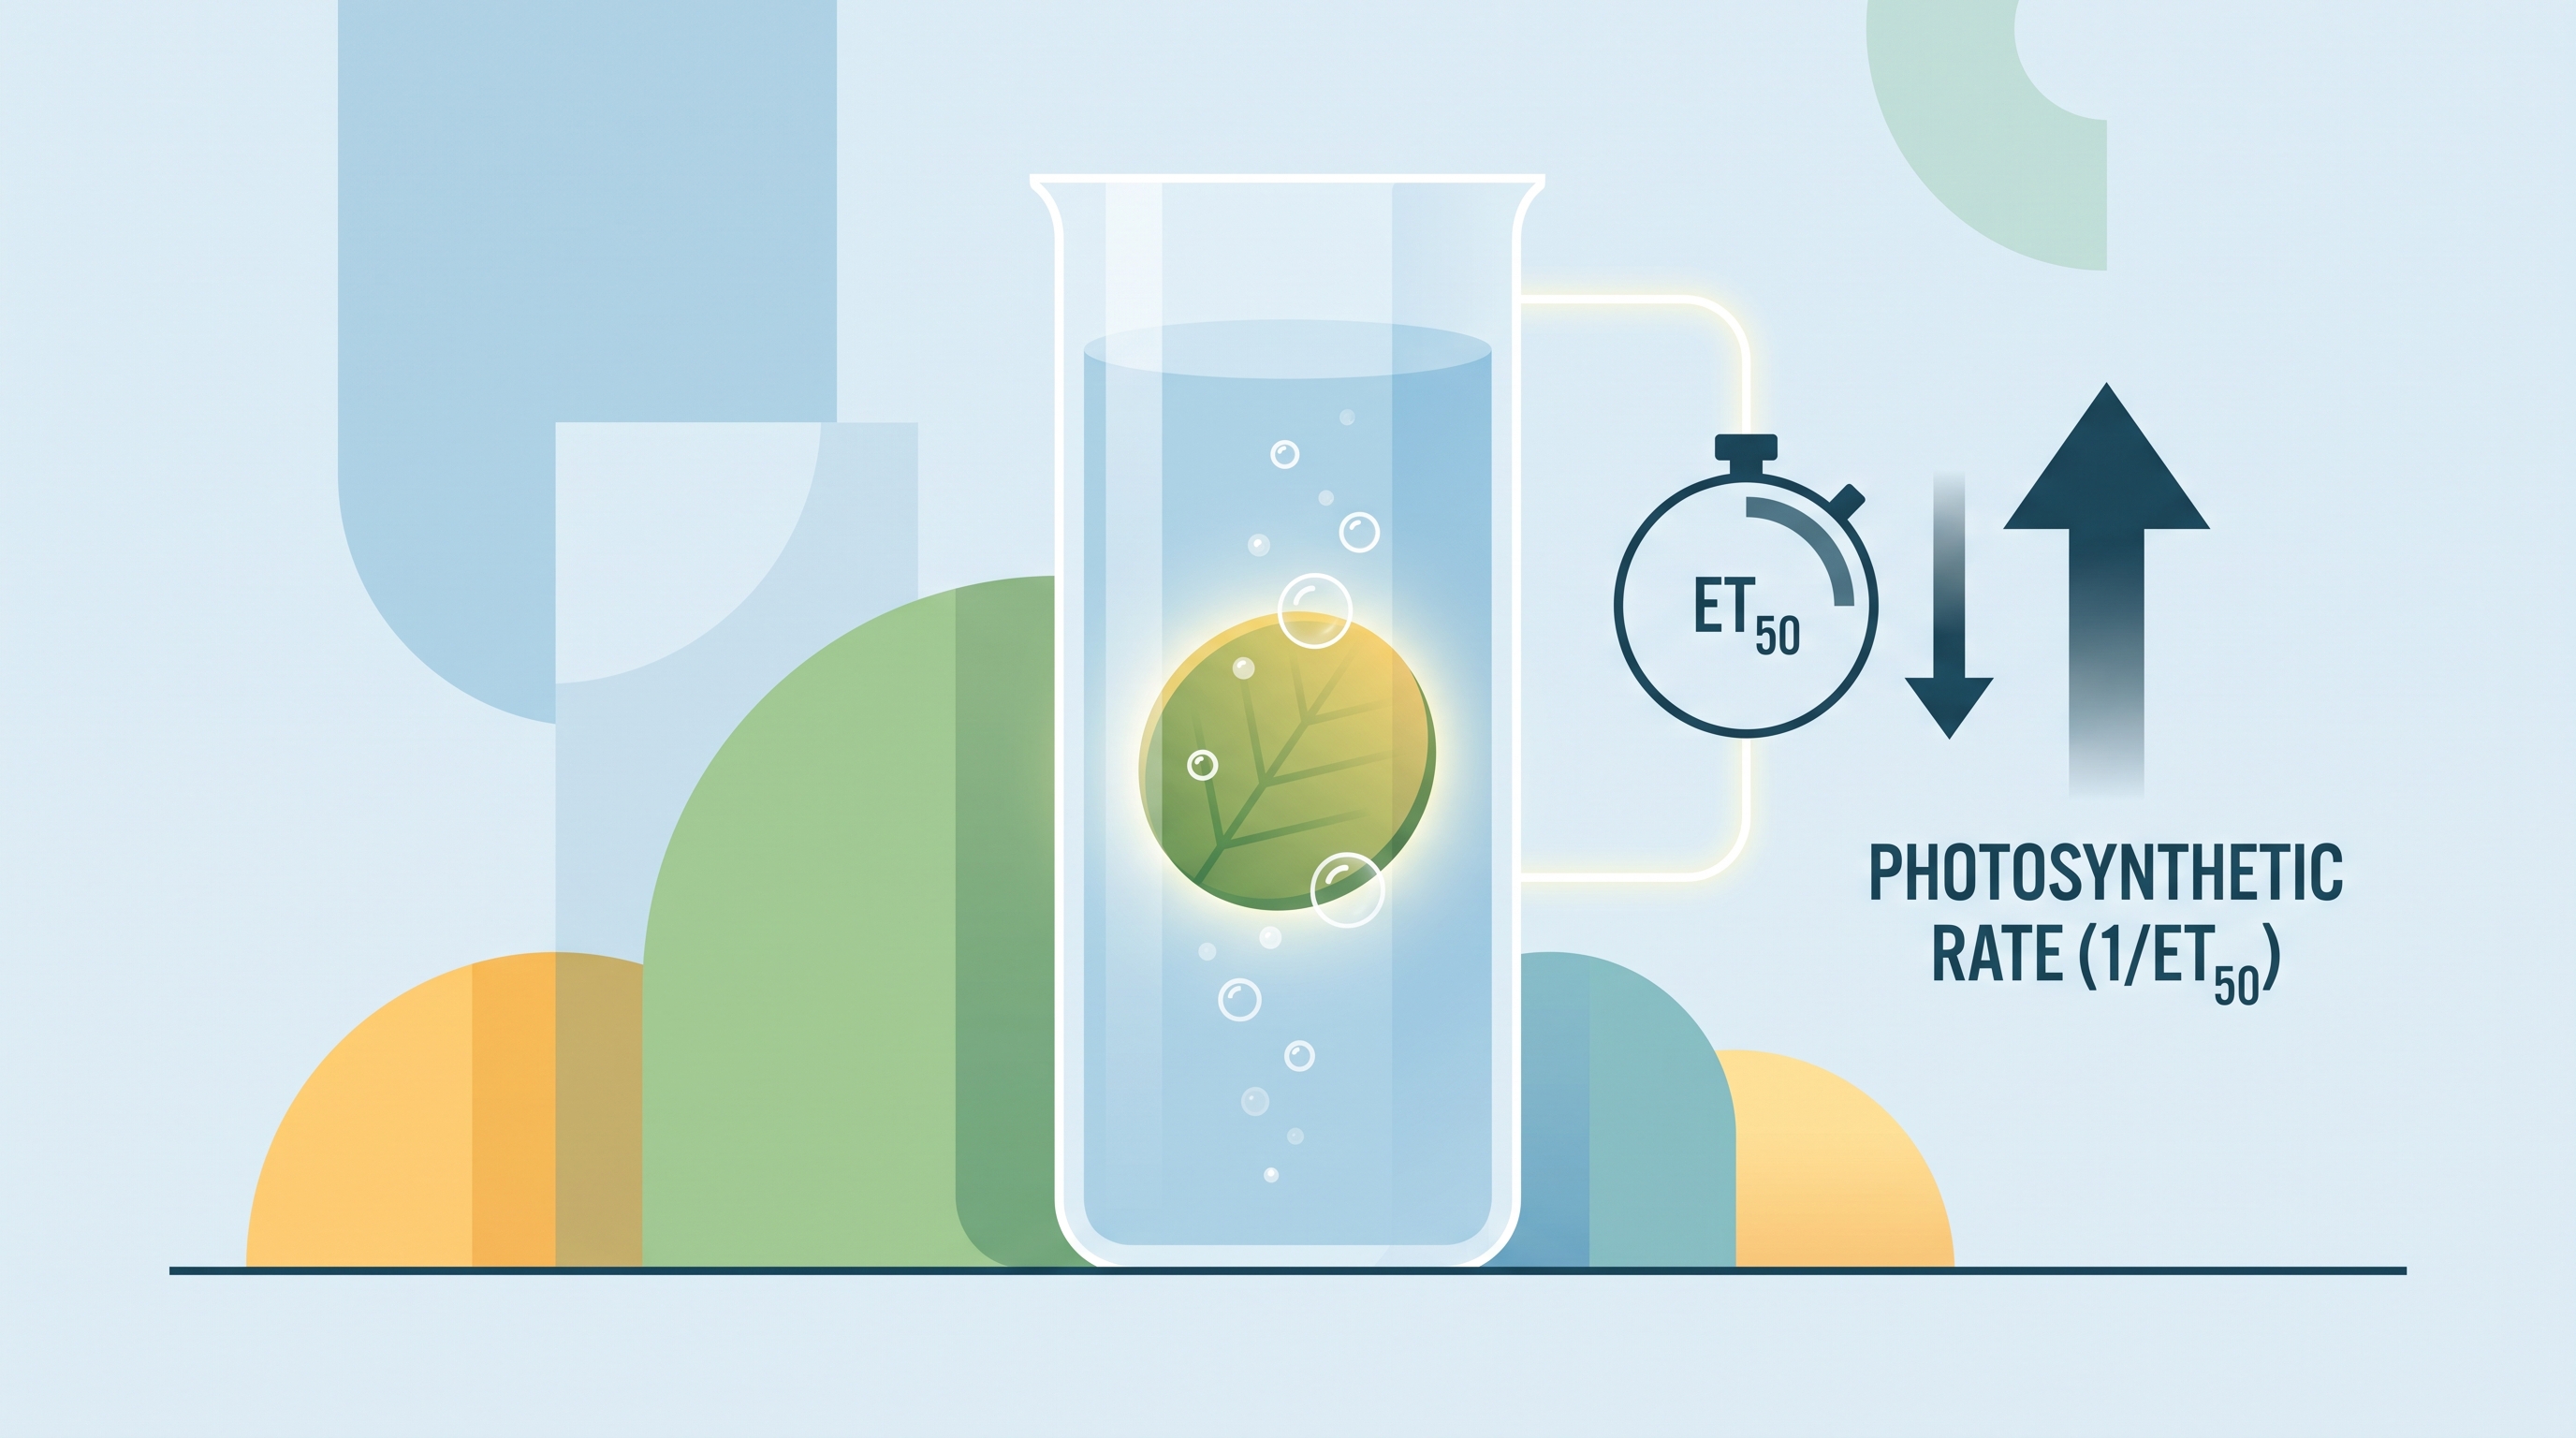
One common metric is $ET_{50}$, the time required for $50%$ of the disks to float. A lower $ET_{50}$ means that the disks reached the halfway point sooner, so the photosynthetic rate was higher. Because time and rate have an inverse relationship, plotting raw $ET_{50}$ values can produce a visually misleading negative slope.
Rate transformation: Use $\frac{1}{ET_{50}}$ when you want the vertical axis to increase as photosynthetic rate increases.
Designing the investigation
After mastering the technique, investigators select a factor that may affect photosynthesis. Light intensity is a natural independent variable: keep leaf type, disk size, bicarbonate concentration, temperature, solution volume, and exposure time constant while changing the light reaching the disks. The dependent variable may be $ET_{50}$, $\frac{1}{ET_{50}}$, the fraction of disks floating at each time, or a calculated rate.
A strong design includes repeated disks for each treatment, randomization when practical, and a control condition. “Light intensity” must also be operationally defined: it may be measured as photosynthetically active radiation (PAR) in micromoles per square meter per second, written $\mu\text{mol m}^{-2}\text{s}^{-1}$, or as light intensity in foot-candles. A PAR meter measures photons in the wavelengths used by photosynthesis, making it more biologically meaningful than simply recording the distance from a lamp.
Temperature can become an unintended confounding variable because a lamp may heat samples as its distance changes. If temperature is the factor being tested, light intensity must be controlled; if light intensity is being tested, temperature should be monitored and held as constant as possible.
Light-response curves
A light-response curve displays how photosynthetic activity changes as PAR increases. At low light levels, increasing PAR generally increases photosynthetic rate because more photons are available. At higher levels, the curve may approach a plateau when another factor—such as carbon dioxide availability, enzyme capacity, or temperature—limits the process.
For a graph, place PAR or another light-intensity measurement on the horizontal axis and photosynthetic rate on the vertical axis. Label every axis with the variable and unit, plot means rather than unexplained individual values when appropriate, and include error bars such as $\pm 2$ standard errors when the design supports them.
Suppose disks exposed to $100$, $200$, and $400\ \mu\text{mol m}^{-2}\text{s}^{-1}$ produce mean values of $\frac{1}{ET_{50}$} equal to $0.010$, $0.018$, and $0.021\ \text{s}^{-1}$. The increase from $100$ to $200$ is substantial, but the small increase from $200$ to $400$ suggests that the response is nearing a plateau. The correct conclusion is not that light “stops working,” but that another constraint has become important.
Sun-grown versus shade-grown leaves
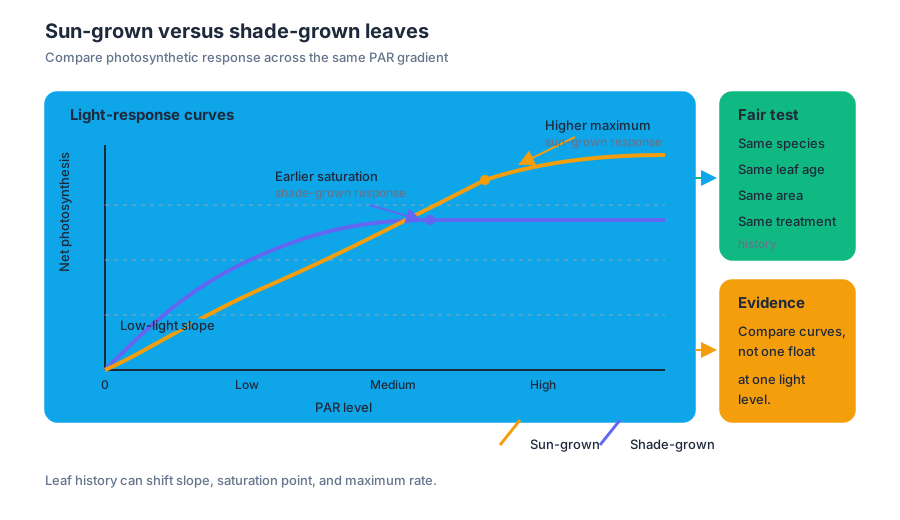
A second variable can be leaf history. Compare light-response curves for sun-grown and shade-grown leaves while testing the same PAR levels. The curves may differ in their low-light performance, the light level at which they begin to saturate, or their maximum measured rate because the leaves developed under different light environments.
The comparison is meaningful only if leaf disks are similar in species, developmental condition, area, and treatment history. A sun-versus-shade claim requires evidence from the curves, not merely the observation that one group floated first at a single light level.
Quantitative reasoning and misconceptions
The investigation requires calculating rates and ratios from collected data. For example, a treatment ratio can be written as $\frac{\text{rate}{\text{sun}}}{\text{rate}{\text{shade}}}$. If water movement is also examined, calculate water potential using $\Psi=\Psi_s+\Psi_p$, where $\Psi$ is water potential, $\Psi_s$ is solute potential, and $\Psi_p$ is pressure potential. For a solution, solute potential may be calculated with $\Psi_s=-iCRT$.
Misconception check: A disk that rises fastest does not necessarily have the greatest gross photosynthesis. The measurement reflects net oxygen accumulation, which is affected by both photosynthesis and respiration.
Another misconception is that a steeper line at every light level must continue indefinitely. Biological response curves often flatten because limiting factors change. Error bars also matter: differences between means should be interpreted cautiously when variation is large or treatment intervals overlap substantially.
AP skills and reasoning processes
This investigation directly develops the six AP Biology science practices:
- Science Practice 1: Concept Explanation — connect oxygen accumulation and disk buoyancy to photosynthetic activity.
- Science Practice 2: Visual Representations — construct and interpret light-response curves.
- Science Practice 3: Questions and Methods — identify variables, controls, replication, and operational definitions.
- Science Practice 4: Representing and Describing Data — calculate rates and ratios and label graphs correctly.
- Science Practice 5: Statistical Tests and Data Analysis — use means, standard error, and error bars to evaluate variation.
- Science Practice 6: Argumentation — support a conclusion about limiting factors with data from the experiment.
Retrieval check: If treatment A has $ET_{50}=240\ \text{s}$ and treatment B has $ET_{50}=120\ \text{s}$, which treatment has the greater estimated photosynthetic rate, and what happens to the comparison when you graph $\frac{1}{ET_{50}}$ instead of $ET_{50}$? Explain using the inverse relationship between time and rate.