From the free course AP Biology on Lykke
3.3 Cellular Energy
Key concepts: Cellular respiration · Glycolysis · Energy availability from respiration · Measuring respiration rate · Oxygen consumption · Carbon dioxide production · Investigation of cellular respiration · Effects of temperature on respiration · Effects of developmental stage on respiration · Energy storage as oil versus starch
Cellular respiration is the process by which cells release energy stored in glucose and other biological macromolecules so that the energy can power cellular functions.
3.3 Cellular Energy
Cellular respiration is the process by which cells release energy stored in glucose and other biological macromolecules so that the energy can power cellular functions. A cell does not “make energy” from nothing; it converts chemical energy into usable forms, especially ATP.
Investigative question: How can we determine how quickly a living organism is releasing energy?
From stored glucose to usable ATP
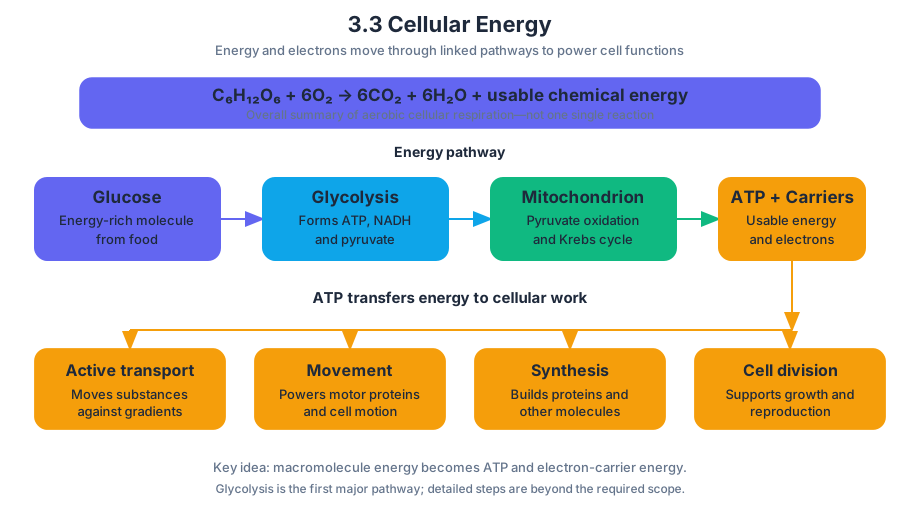
A useful analogy is a rechargeable payment system. Glucose contains energy, but many cellular processes cannot spend that energy directly. During respiration, the cell transfers some of glucose’s energy into ATP, a molecule whose phosphate group can be transferred to power processes such as active transport, movement, synthesis, and cell division.
The overall chemical relationship for aerobic cellular respiration can be represented as:
$$ C_6H_{12}O_6 + 6O_2 \rightarrow 6CO_2 + 6H_2O + \text{usable chemical energy in ATP and other energy carriers} $$
This equation is a summary, not a single reaction. Cellular respiration consists of linked biochemical pathways. Glycolysis is the first major pathway: it releases energy from glucose to form ATP from ADP and inorganic phosphate, produces NADH from NAD$^+$, and produces pyruvate.
CED alignment: Learning Objective ENE-1.L — Explain how cells obtain energy from biological macromolecules in order to power cellular functions.
Essential Knowledge 3.5.B.1 — Glycolysis is a biochemical pathway that releases the energy in glucose molecules to form ATP, NADH, and pyruvate.
Pyruvate is transported from the cytosol into the mitochondrion, where further oxidation releases electrons during the Krebs cycle. The detailed memorization of every step in glycolysis and the Krebs cycle, and every structure involved, is beyond the required scope. The important reasoning pattern is the movement of energy and electrons from a biological macromolecule into ATP and electron carriers.
Respiration rate: measure what enters or leaves
Because respiration uses oxygen and produces carbon dioxide, its rate can be estimated without measuring every intracellular reaction. Respiration rate means the amount of respiration occurring per unit time. Investigators commonly measure either oxygen consumption or carbon dioxide production.
| Measurement | What it indicates | Typical interpretation |
|---|---|---|
| Oxygen consumption | The rate at which $O_2$ leaves the surrounding air or solution | Faster decrease in $O_2$ per unit time indicates a higher respiration rate |
| Carbon dioxide production | The rate at which $CO_2$ enters the surrounding air or solution | Faster increase in $CO_2$ per unit time indicates a higher respiration rate |
The critical comparison is not simply the final amount of gas. It is the change in gas amount divided by elapsed time:
$$\text{respiration rate}=\frac{\Delta O_2\text{ consumed}}{\Delta t}$$
or
$$\text{respiration rate}=\frac{\Delta CO_2\text{ produced}}{\Delta t}$$
For example, suppose germinating seeds consume $18\ \text{mL}$ of $O_2$ in $30\ \text{min}$, while a second group consumes $30\ \text{mL}$ in the same time. Their rates are:
$$\frac{18\ \text{mL}}{30\ \text{min}}=0.60\ \text{mL},\text{min}^{-1}$$
and
$$\frac{30\ \text{mL}}{30\ \text{min}}=1.00\ \text{mL},\text{min}^{-1}$$
The second group has the greater respiration rate. On a graph, Science Practice 4.A: Construct a graph, plot, or chart requires time on the independent-variable axis and gas amount on the dependent-variable axis. The slope represents the rate; a steeper oxygen-decrease or carbon-dioxide-increase trend indicates faster respiration.
Investigation 6: comparing living seeds
Investigation 6: Cellular Respiration asks, “What factors affect the rate of cellular respiration in multicellular organisms?” Temperature is one environmental factor that can be investigated. A valid design could compare groups of seeds at several temperatures while keeping seed number, developmental stage, measurement time, and apparatus constant.
Developmental stage also matters. Newly germinating seeds may have different energy demands from seeds that have been germinating for several days. Seeds can also store energy in different forms: Wisconsin Fast Plants are an example of oil-storing seeds, whereas grass seeds are an example of starch-storing seeds. These differences can lead to testable predictions about respiration rate, but the data—not the prediction alone—must support the conclusion.
A strong claim might state: “Seeds at temperature $T_2$ respired faster than seeds at temperature $T_1$.” To support it under Science Practice 6.B: Support a claim with evidence from biological principles, concepts, processes, and/or data, the response must identify the measured difference and connect it to the biological principle that respiration releases energy for cellular work. A claim without numerical or graphical evidence is incomplete.
Common misconception — “More oxygen means more respiration.”
Respiration rate is not the total oxygen present. It is the rate of oxygen consumption. A container can begin with more $O_2$ yet show a slower respiration rate if its oxygen decreases only slightly over the same interval.
Common misconception — “Plants only respire in the dark.”
Living plant cells respire whenever they require energy. Light affects photosynthesis, but respiration is the energy-releasing process being measured here.
Retrieval check
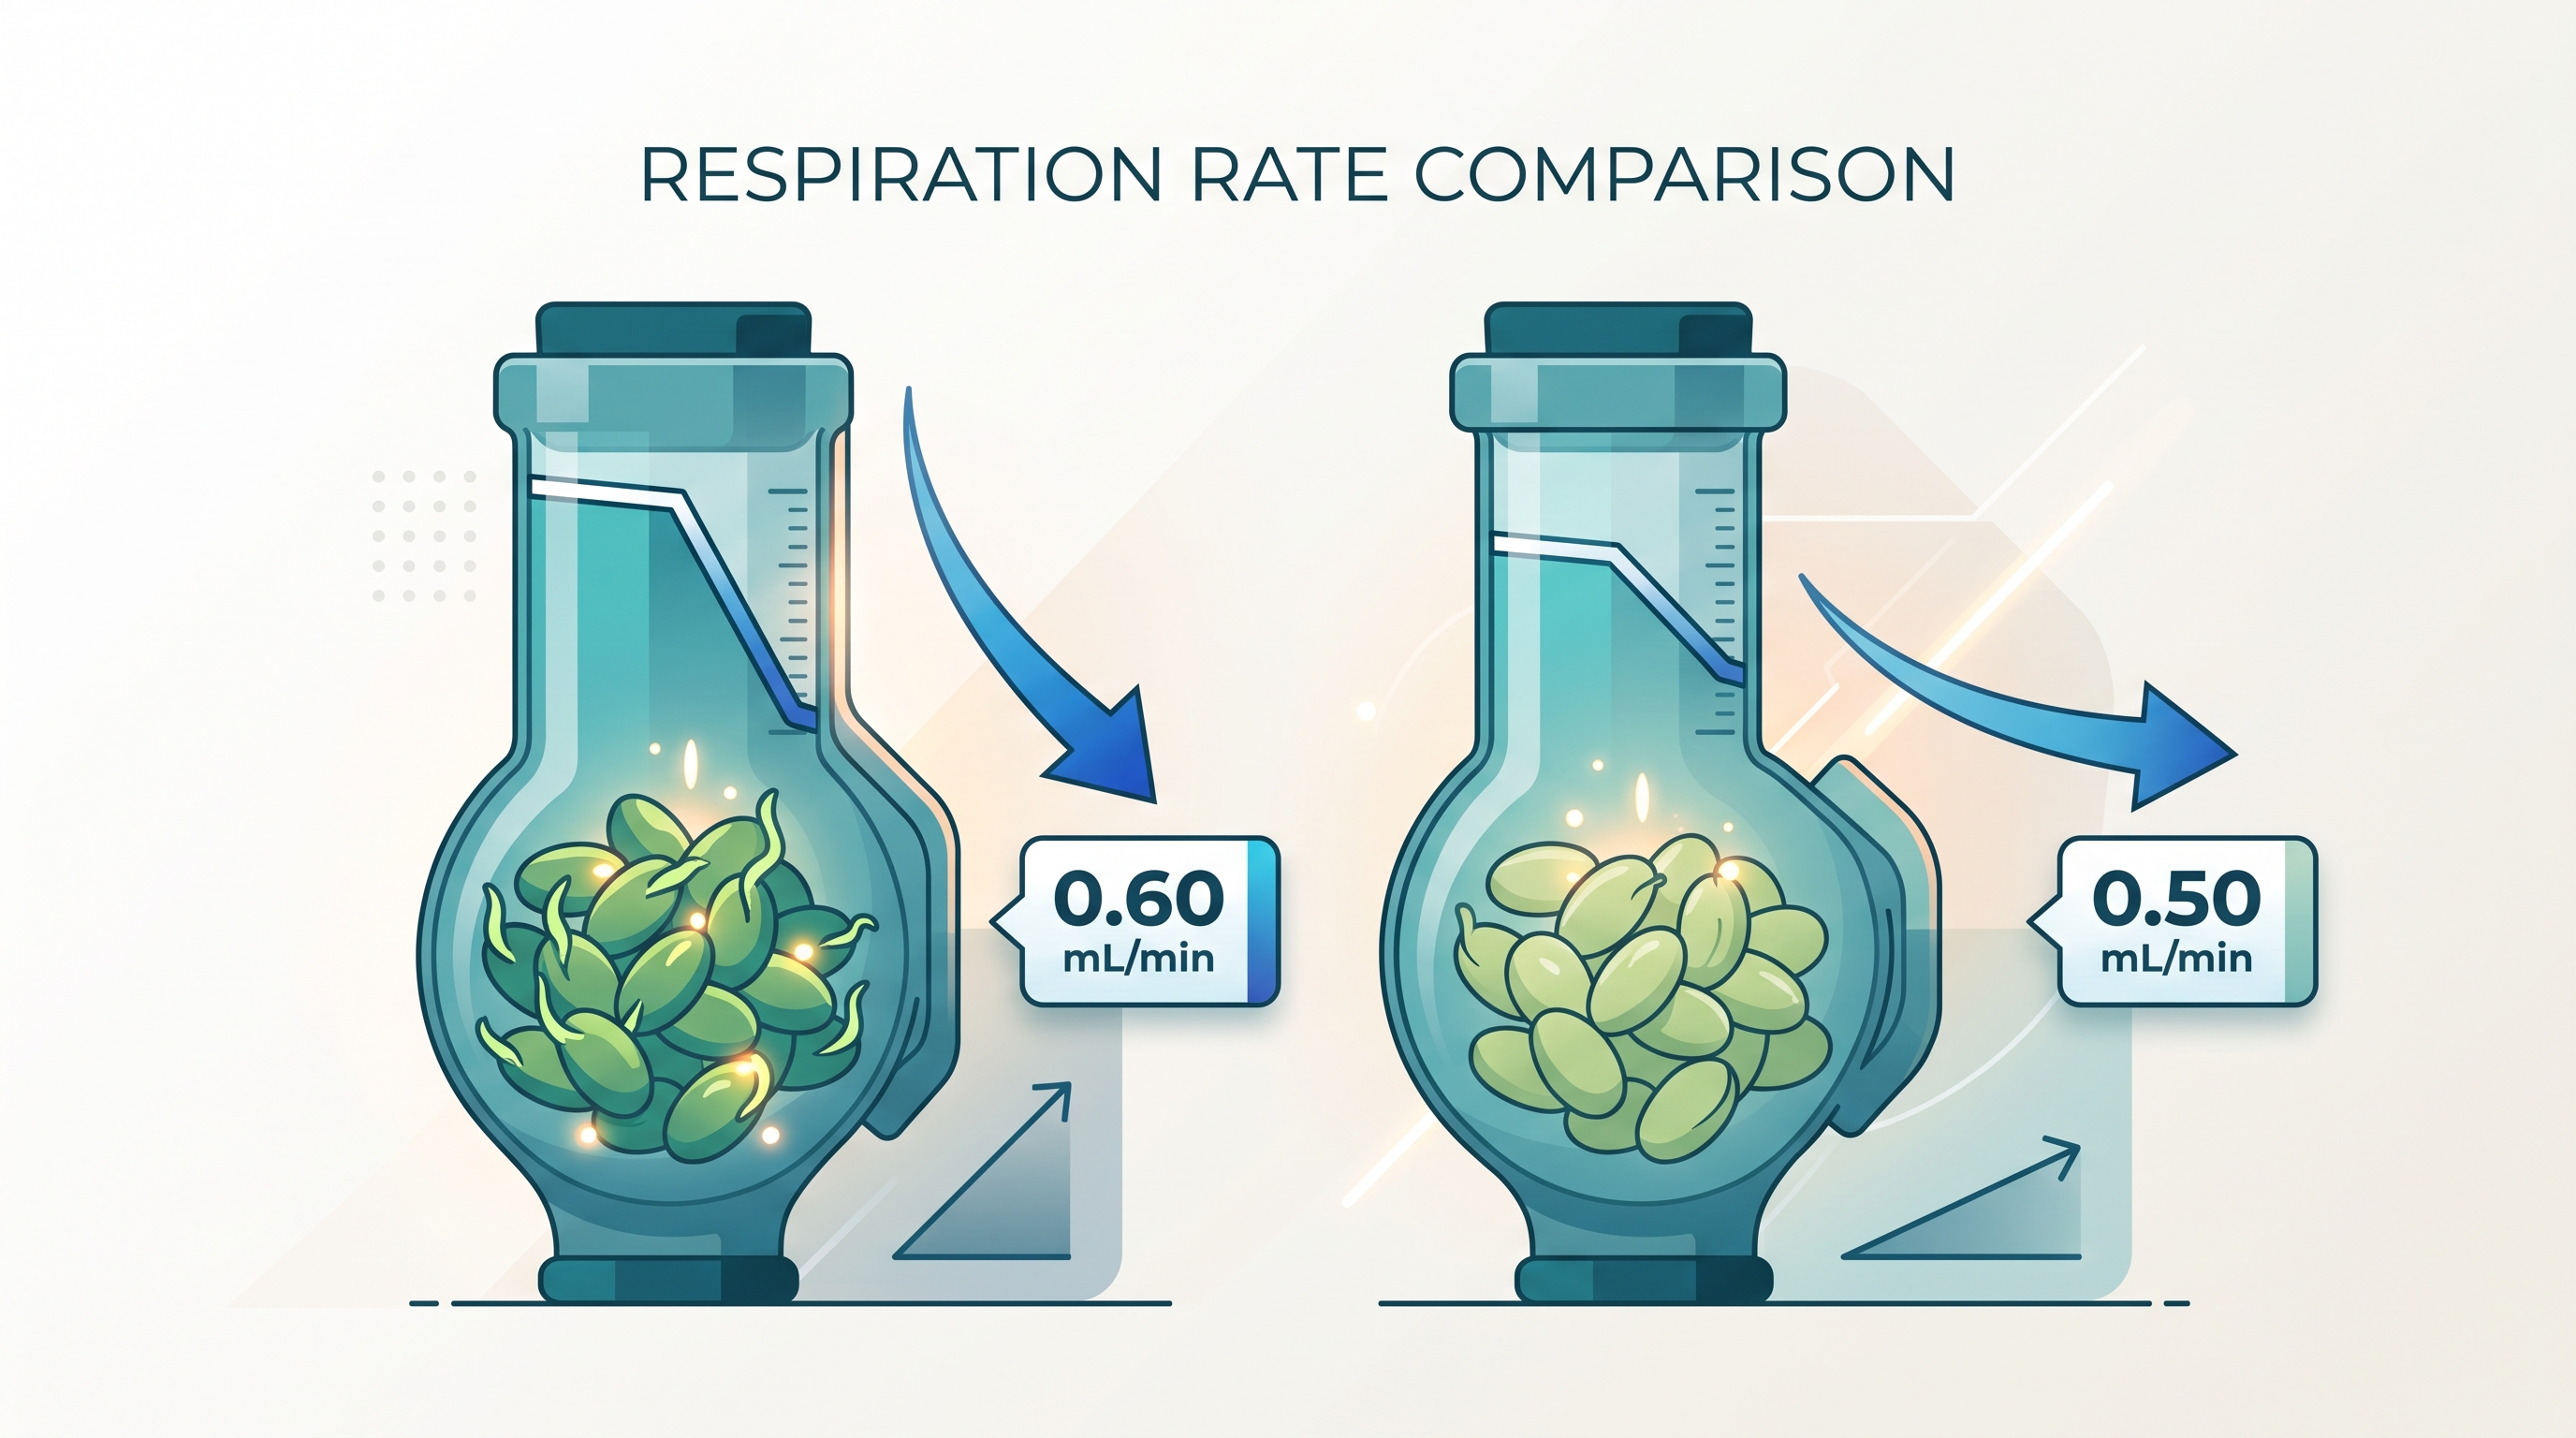
A respirometer records oxygen consumption of $12\ \text{mL}$ in $20\ \text{min}$ for one seed group and $15\ \text{mL}$ in $30\ \text{min}$ for another. Which group respired faster, and what evidence supports your answer?
The first group: its rate is $12/20=0.60\ \text{mL},\text{min}^{-1}$, whereas the second is $15/30=0.50\ \text{mL},\text{min}^{-1}$. The correct comparison uses the slope, not the total oxygen consumed.