From the free course AP Biology on Lykke
7.4 Population Genetics
Key concepts: Population genetics · Allele frequencies in populations · Inheritance patterns · Population-genetics modeling and simulations · Hypothesis development and testing · Statistical tests, including chi-square and t-tests · Standard deviation as a measure of variation · Fruit-fly behavior investigations · Negative geotaxis in fruit flies · Phototactic responses to different light wavelengths
A population evolves when the proportions of its heritable variants change across generations. Population genetics studies those changes by tracking alleles—the alternative forms of a gene—rather than focusing only on individual organisms.
7.4 Population Genetics
A population evolves when the proportions of its heritable variants change across generations. Population genetics studies those changes by tracking alleles—the alternative forms of a gene—rather than focusing only on individual organisms.
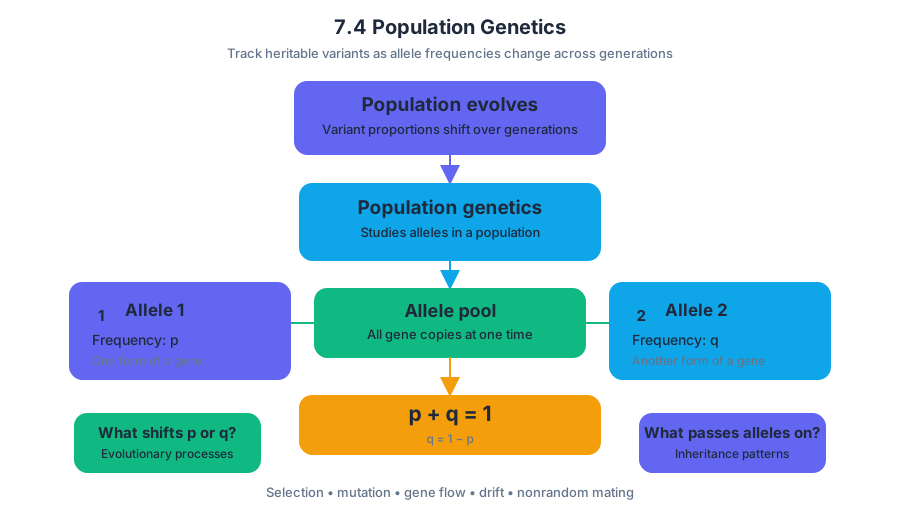
For a gene with two alleles, allele $1$ and allele $2$, let $p$ represent the frequency of allele $1$ and $q$ represent the frequency of allele $2$. Because every copy of the gene must be one allele or the other:
$$p+q=1$$
Key relationship: $q$ is the frequency of allele $2$ in the population, so $q=1-p$.
This relationship describes the allele pool at one point in time. It does not by itself explain why the frequencies change. Changes may result from natural selection, mutation, gene flow, genetic drift, or nonrandom mating; inheritance patterns determine how alleles are passed into the next generation, while evolutionary processes determine whether their population frequencies shift.
From individuals to populations
An individual has a genotype, such as $AA$, $Aa$, or $aa$. A population has allele frequencies: the fraction of all gene copies that are allele $A$ or allele $a$. This distinction matters because an individual does not “evolve” genetically during its lifetime; a population can evolve when its allele frequencies differ between generations.
Suppose $40$ fruit flies carry genotype $AA$, $40$ carry $Aa$, and $20$ carry $aa$. The population contains $100$ flies and therefore $200$ copies of the gene. The number of $A$ copies is:
$$2(40)+1(40)=120$$
Thus, the frequency of allele $A$ is:
$$p=\frac{120}{200}=0.60$$
The remaining allele frequency is:
$$q=1-0.60=0.40$$
If the next generation has $p=0.72$, the population has changed genetically even if the flies still look broadly similar. The evidence for evolutionary change is the shift in allele frequency, not simply a change in the number of organisms.
Modeling allele-frequency change
A population-genetics model is a simplified system that represents inheritance across generations. A physical model might use colored beads or coins; a spreadsheet might calculate allele transmission repeatedly; an interactive computer simulation might allow a researcher to vary parameters such as population size, selection strength, or migration.
The model becomes scientifically useful when variables are changed systematically rather than randomly. For example, begin with $p=0.50$ and $q=0.50$, hold population size constant, and run several generations. Then change only one parameter—such as reducing population size—and record how quickly allele frequencies diverge among repeated trials.
A strong investigation follows this pattern:
- Observe a pattern or biological behavior.
- Develop a question that could be answered with measurable data.
- State a hypothesis predicting how a changed variable will affect the outcome.
- Alter one model parameter or experimental variable at a time.
- Record the result across generations or trials.
- Compare observed results with a prediction or theoretical population.
For instance, a spreadsheet could test whether a small population shows larger generation-to-generation fluctuations than a large population. A reasonable hypothesis is: if population size decreases, random sampling will produce greater variation in allele frequencies among replicate populations. The hypothesis is testable because the model can vary population size and measure the resulting spread of allele frequencies.
From observation to biological experiment
Fruit flies provide a useful example of turning observation into investigation. Students might observe that flies climb upward when a container is tapped and ask, “Does age affect the speed of the negative geotactic response?” They could define response speed operationally as the time required for a fly to reach a marked height, then compare age groups using replicated trials.
Another question is, “Which wavelengths of light stimulate a phototactic response?” The investigator could expose flies to different colors of light, measure the number choosing each side of a chamber, and keep chamber size, exposure time, fly number, and temperature constant. These behavioral investigations do not automatically measure allele-frequency change, but they demonstrate the same population-genetics workflow: observation, hypothesis, controlled variable changes, quantitative measurement, and statistical evaluation.
Statistical evidence
Biologists use statistical tests to estimate how probable a result would be if a theoretical expectation were correct. A chi-square test is useful when comparing observed counts with expected counts across categories:
$$\chi^2=\sum\frac{(o-e)^2}{e}$$
Here, $o$ is an observed count and $e$ is an expected count. A large $\chi^2$ indicates a larger discrepancy, but the conclusion also depends on degrees of freedom and the appropriate critical value. A chi-square result does not prove that a hypothesis is true; it indicates whether the observed deviation is unlikely under the chosen expectation.
A t-test is used in appropriate situations to compare means, such as the average geotactic-response times of two fly-age groups. Before collecting data, investigators should select the statistical method that matches the question and data type.
To describe variation, calculate the sample mean:
$$\bar{x}=\frac{1}{n}\sum x_i$$
and the sample standard deviation:
$$s=\sqrt{\frac{\sum(x_i-\bar{x})^2}{n-1}}$$
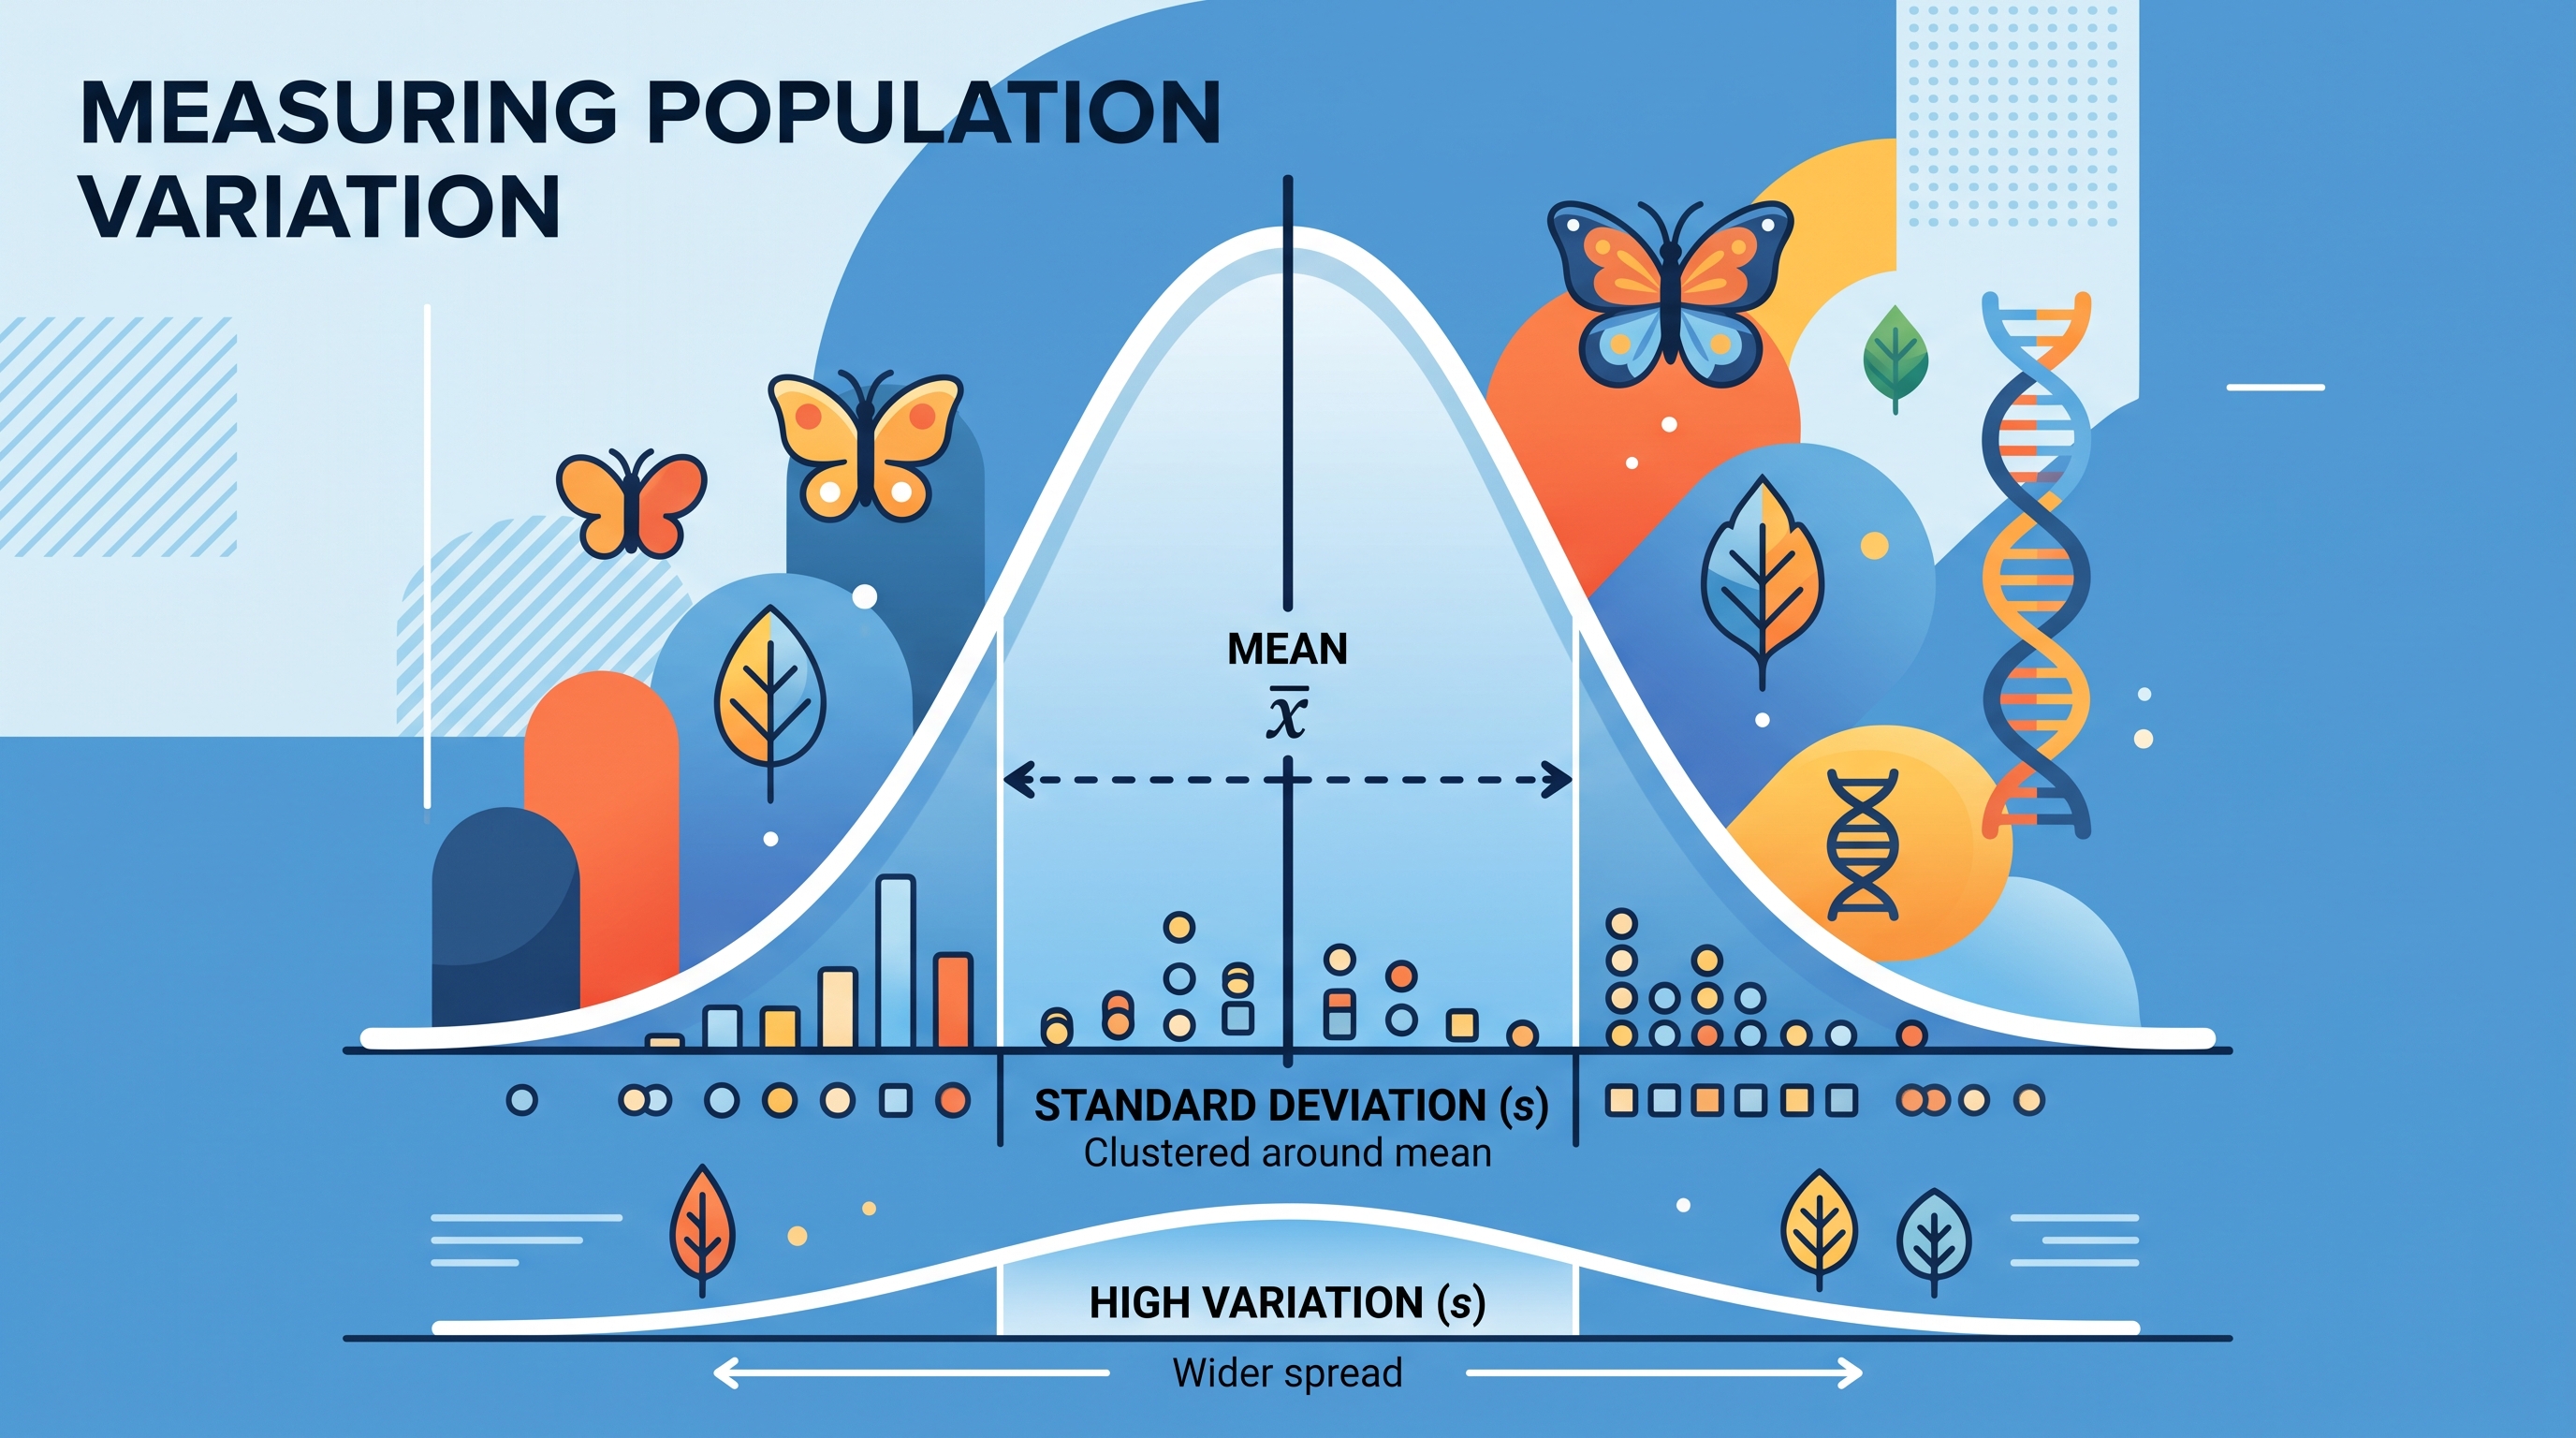
The standard deviation estimates how widely individual measurements vary around the mean. A small standard deviation means measurements cluster closely; it does not mean that the experiment is automatically accurate.
Misconception check: A higher allele frequency is not necessarily “better,” and statistical significance does not prove biological importance. Both conclusions require context, an appropriate comparison, and a clearly stated hypothesis.
CED traceability: This topic develops EVO-1.L: Explain the impacts on the population if any of the conditions of Hardy-Weinberg are not met and 5A: Perform Mathematical Calculations. The mathematical model provides the baseline; deviations from its conditions are interpreted as evidence that evolutionary forces may be operating.
Retrieval check: A population has $p=0.35$ for allele $1$. What is $q$ for allele $2$? If observed genotype counts differ from theoretical expectations, which test compares categorical counts with expectations, and what does a large $\chi^2$ value suggest?