From the free course AP Biology on Lykke
AP Practice 4
A data-analysis free-response task asks you to turn biological measurements into a defensible claim. The strongest response does not merely report that one group is “higher”; it identifies the variables, represents the data accurately, quantifies uncertainty when appropriate, and connects the observed pattern to a…
AP Practice 4
A data-analysis free-response task asks you to turn biological measurements into a defensible claim. The strongest response does not merely report that one group is “higher”; it identifies the variables, represents the data accurately, quantifies uncertainty when appropriate, and connects the observed pattern to a biological mechanism.
This original, unofficial practice targets Science Practice 4: Representing and Describing Data, Science Practice 5: Statistical Tests and Data Analysis, and Science Practice 6: Argumentation. It uses an enzyme investigation because biological data become meaningful only when experimental design, patterns, variation, and mechanism are considered together.
The task
A student investigates how temperature affects the activity of an enzyme that breaks down a colored substrate. Equal amounts of enzyme and substrate are mixed, and enzyme activity is estimated from the decrease in substrate concentration over one minute. Each temperature is tested in four independent trials.
| Temperature ($^\circ\mathrm{C}$) | Trial 1 ($\mu\mathrm{mol\ min^{-1}}$) | Trial 2 ($\mu\mathrm{mol\ min^{-1}}$) | Trial 3 ($\mu\mathrm{mol\ min^{-1}}$) | Trial 4 ($\mu\mathrm{mol\ min^{-1}}$) |
|---|---|---|---|---|
| $10$ | $12$ | $14$ | $13$ | $11$ |
| $25$ | $28$ | $30$ | $29$ | $31$ |
| $40$ | $46$ | $49$ | $45$ | $48$ |
| $55$ | $21$ | $18$ | $20$ | $19$ |
Prompt 1. Identify the independent variable and dependent variable. State one variable that should be held constant.
Prompt 2. Calculate the mean enzyme activity at $40^\circ\mathrm{C}$.
Prompt 3. Describe the relationship between temperature and enzyme activity shown by the data.
Prompt 4. The student plans to display the results using a graph. Identify an appropriate graph type and describe the axes.
Prompt 5. Explain why the student should include measures of variation on the graph.
Prompt 6. Construct an argument explaining why the data support an optimal temperature near $40^\circ\mathrm{C}$ rather than $55^\circ\mathrm{C}$.
Worked reasoning
Prompts 1–2: Variables and calculation
The independent variable is temperature because the student deliberately changes it. The dependent variable is enzyme activity, measured in $\mu\mathrm{mol\ min^{-1}}$, because it responds to temperature. A suitable controlled variable is the amount of enzyme, amount of substrate, reaction time, or solution volume.
For $40^\circ\mathrm{C}$, add the four trial values and divide by the number of trials:
$$ \bar{x}=\frac{46+49+45+48}{4} =\frac{188}{4} =47\ \mu\mathrm{mol\ min^{-1}} $$
The awarded reasoning must show the setup, not only the final number. A response that gives $47$ without units is weaker because the measurement represents a rate, not simply an amount of product.
Prompts 3–4: Pattern and representation
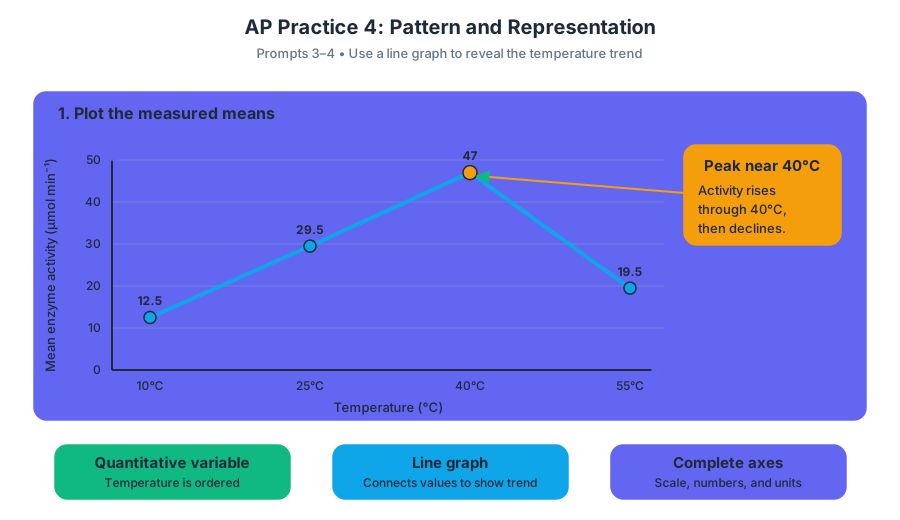
Activity increases from a mean of $12.5\ \mu\mathrm{mol\ min^{-1}}$ at $10^\circ\mathrm{C}$ to $29.5\ \mu\mathrm{mol\ min^{-1}}$ at $25^\circ\mathrm{C}$ and $47\ \mu\mathrm{mol\ min^{-1}}$ at $40^\circ\mathrm{C}$. It then decreases to $19.5\ \mu\mathrm{mol\ min^{-1}}$ at $55^\circ\mathrm{C}$. Thus, activity rises with temperature up to approximately $40^\circ\mathrm{C}$ and declines at the highest temperature tested.
A line graph is appropriate because temperature is a quantitative independent variable and the investigation examines a trend across ordered temperatures. The horizontal axis should show temperature in $^\circ\mathrm{C}$; the vertical axis should show mean enzyme activity in $\mu\mathrm{mol\ min^{-1}}$. Each axis needs a scale, numerical values, and units.
Prompts 5–6: Variation and argumentation
Measures of variation show how consistently the trials produced the mean. Two temperatures can have similar means but very different spreads, so the mean alone does not reveal the reliability of the estimate. Error bars based on standard deviation or standard error would help readers judge the variation among trials; the type of error bar must be identified rather than drawn ambiguously.
The data support an optimum near $40^\circ\mathrm{C}$ because the mean activity is greatest there, at $47\ \mu\mathrm{mol\ min^{-1}}$, whereas activity falls to $19.5\ \mu\mathrm{mol\ min^{-1}}$ at $55^\circ\mathrm{C}$. A biological explanation is that moderate warming increases molecular motion and enzyme–substrate collisions, while excessive heat can disrupt the enzyme’s three-dimensional structure and alter the active site. The data support this explanation, but they do not prove irreversible denaturation because enzyme structure was not measured directly.
High-scoring argument: claim + quantitative evidence + biologically relevant reasoning.
Timing and error review
Allow approximately $12$–$15$ minutes for a data-analysis task of this size: $2$ minutes to identify variables, $3$ minutes for calculations, $3$ minutes for graph interpretation, and $4$–$7$ minutes for the evidence-based argument. Reserve the final minute to check units, labels, and whether every claim is tied to data.
Use this error-review routine after completing the task:
- Did the response name variables by their experimental roles?
- Did every calculation include a formula, substitution, answer, and unit?
- Did the graph place the independent variable on the horizontal axis?
- Did the description report a trend without claiming more than the data show?
- Did the argument include numerical evidence and a mechanism?
- Did the response distinguish variation from proof of statistical significance?
Misconception check
Misconception: “The highest measured value proves the enzyme’s exact optimum temperature.” The data identify $40^\circ\mathrm{C}$ as the highest point among the temperatures tested. A temperature between $40^\circ\mathrm{C}$ and $55^\circ\mathrm{C}$ could produce greater activity, so the precise optimum would require additional temperature levels and replicated trials.
Retrieval check: If the mean activity at $40^\circ\mathrm{C}$ were high but the trials varied greatly, would the mean alone establish a reliable difference from $25^\circ\mathrm{C}$? No. Variation must be considered, and an appropriate statistical analysis may be needed before concluding that the treatments differ significantly.

Source Materials
- Ap Biology Course And Exam Description
- Ap Biology Course Overview
- Ap Biology Course At A Glance
- Ap Biology Equations And Formulas Sheet
- Chapter 3 Quantitative Skills In Ap Sciences
- Ap Biology Teacher Lab Manual Effective Fall 2019
- Updates 2025 26
- AP Biology Course-AP Central-College Board
- AP Biology-AP Students
- Biology of AP Courses-OpenStax
- AP Biology-Acellus
- AP/College Biology