From the free course AP Environmental Science on Lykke
8.13 Dose Response Curve · 8.14 Pollution and Human Health
Key concepts: Dose-response curves · Evaluating dose-response curves · Dose of a toxin or drug · Organism effects from pollutants · Population mortality rate · Lethal dose 50% (LD₅₀) · Pollutants’ direct impacts on organism health · Pollutants’ indirect impacts on organism health · Pollution and human health · Aquatic and terrestrial pollution
A dose-response curve shows how an organism, or a population’s mortality rate, changes as exposure to a particular toxin or drug increases. The curve turns “more pollution” into a measurable question: How much exposure produces which biological effect?
8.13 Dose Response Curve · 8.14 Pollution and Human Health
A dose-response curve shows how an organism, or a population’s mortality rate, changes as exposure to a particular toxin or drug increases. The curve turns “more pollution” into a measurable question: How much exposure produces which biological effect?
Essential Knowledge EIN-3.B.1: A dose response curve describes the effect on an organism or mortality rate in a population based on the dose of a particular toxin or drug.
Reading the curve
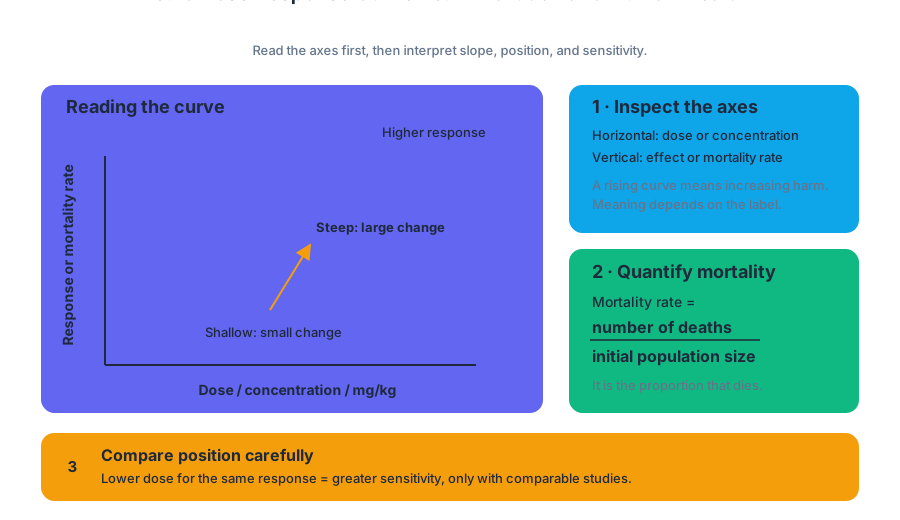
A dose is the quantity of a substance received by an organism. Depending on the investigation, the horizontal axis may show concentration, mass of pollutant, or dose per unit body mass, such as $mg/kg$. The vertical axis may show an observable response—reduced growth, impaired reproduction, organ damage, or another health effect—or the mortality rate, the proportion of a population that dies:
$$ \text{Mortality rate}=\frac{\text{number of deaths}}{\text{initial population size}} $$
Always inspect the axes before interpreting the shape. A curve that rises with dose indicates increasing harm as exposure increases; a curve that falls may represent declining survival or another response variable whose meaning must be read from its label. A steep section means that a small increase in dose produces a large change in response, while a shallow section indicates a smaller change over that dose range.
The location of a curve also matters. If one species or pollutant produces a given response at a lower dose than another, it is more sensitive under those experimental conditions. However, the comparison is valid only when the studies use comparable organisms, exposure times, response measures, and units.
Evaluating dose-response data
The Learning Objective EIN-3.B, “Evaluate dose response curves,” requires more than identifying whether the line goes up or down. Under the suggested skill Data Analysis 5.E: Explain what the data implies or illustrates about environmental issues, a strong interpretation identifies the variables, describes the trend using evidence from the graph, and explains the environmental meaning of that trend.
For example, imagine a laboratory study exposing equal-sized groups of aquatic insects to a pesticide. Mortality is $5%$ at $1\ mg/L$, $20%$ at $3\ mg/L$, $50%$ at $7\ mg/L$, and $85%$ at $10\ mg/L$.
Worked interpretation: The independent variable is pesticide dose in $mg/L$; the dependent variable is mortality rate. Mortality increases as dose increases, with the sharpest increase between $3\ mg/L$ and $7\ mg/L$. At $7\ mg/L$, $50%$ mortality is directly observed in the data, so that measured dose corresponds to the previously established $LD_{50}$ for this specific species and testing condition. If $50%$ mortality were not directly measured, its value would need to be estimated by interpolation between nearby data points or read from the plotted curve.
The conclusion must remain appropriately narrow: the pesticide is associated with increased mortality in these insects under the tested conditions. The graph alone does not prove that the same dose will produce the same result in humans, birds, fish, or organisms exposed for a different length of time.
Pollution: direct and indirect effects
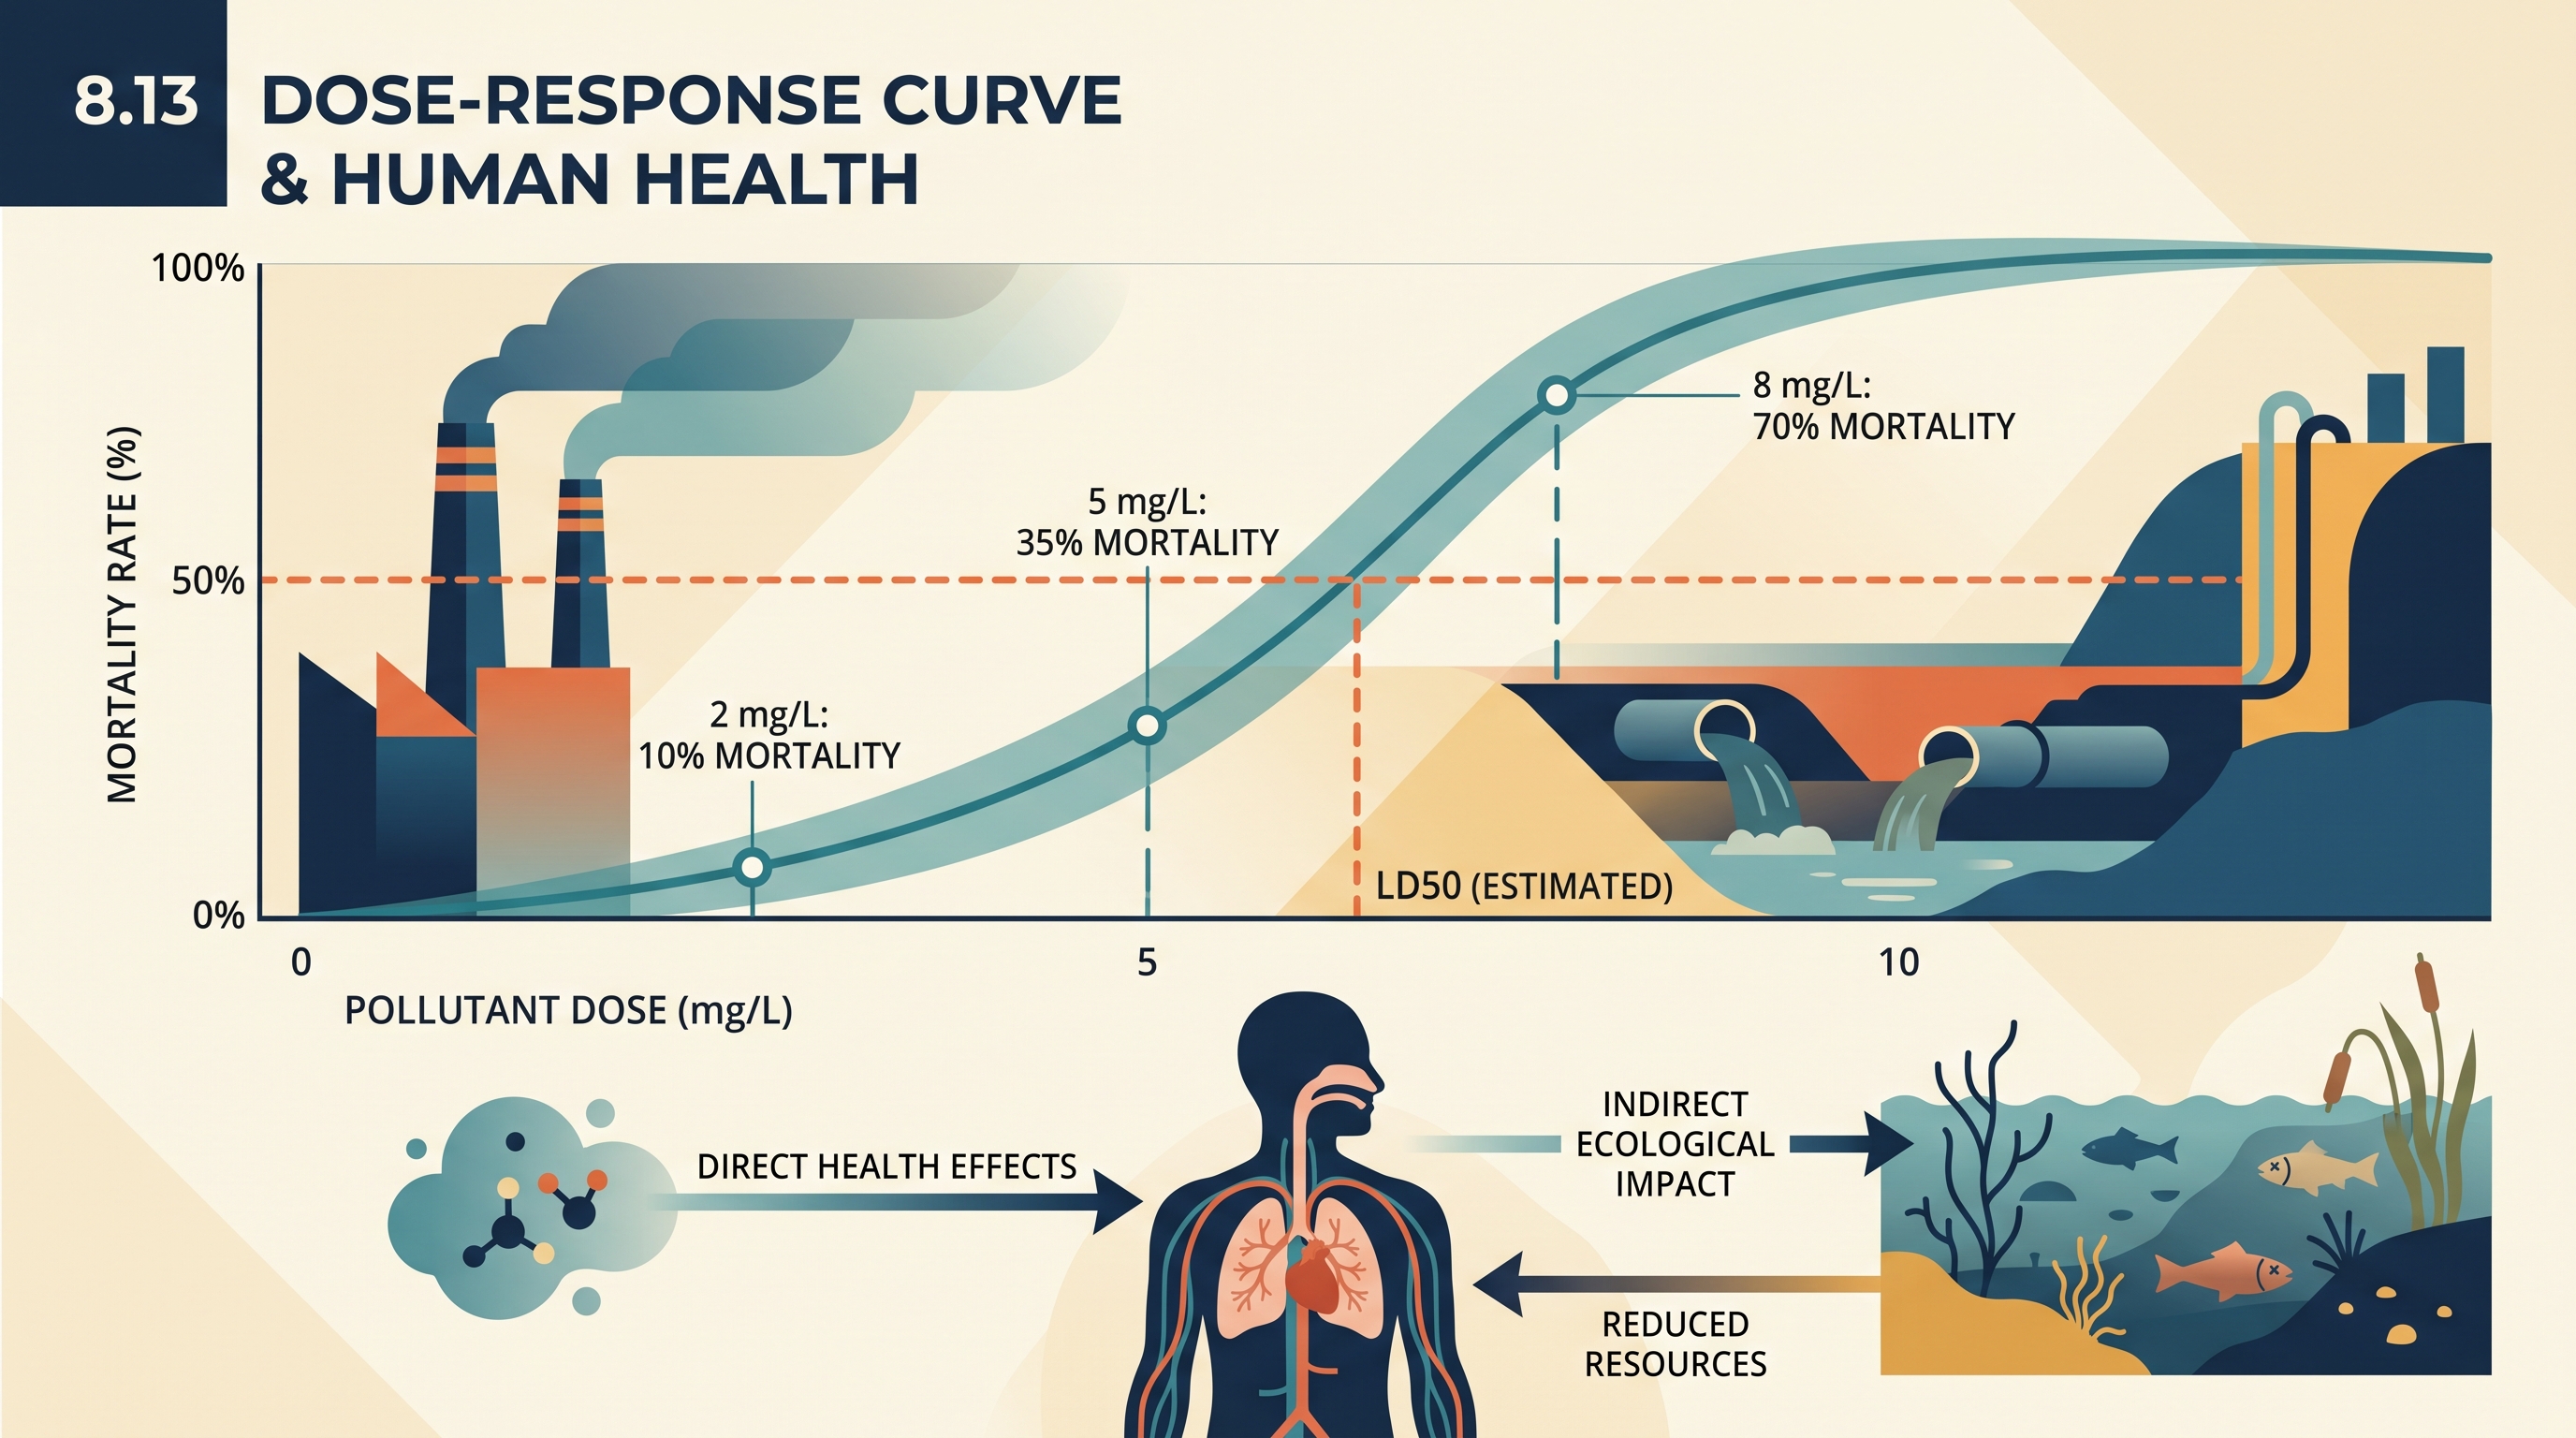
Pollutants can affect organisms directly, meaning the pollutant acts on the organism itself. Examples include a toxin damaging nervous tissue, particulate matter irritating the lungs, or a chemical interfering with reproduction. Direct effects may appear as illness, reduced growth, impaired behavior, lower fertility, or death.
Pollutants can also act indirectly by changing the ecosystem on which organisms depend. A pollutant may reduce oxygen in water, eliminate food sources, alter habitat, or disrupt a food web. The health of a species is therefore closely tied to the health of its ecosystem: an organism can be harmed even when it does not absorb a large dose of the original pollutant.
For instance, nutrient pollution entering a lake may stimulate algal growth. When algae die, decomposers consume the organic matter and use dissolved oxygen. Fish may then suffocate because of hypoxic water. The fish mortality is an indirect ecological effect of the nutrient pollutant, even though the nutrients did not necessarily poison the fish directly.
Misconception check
Misconception: “A dose-response curve gives one universal safe dose.” It does not. Responses vary among species and individuals, and depend on exposure route, duration, body size, chemical properties, and environmental conditions. A curve describes a tested relationship; it does not automatically establish harmlessness below the measured range or guarantee safety for every population.
Retrieval and interpretation check
A graph shows mortality rates of $10%$ at $2\ mg/L$, $35%$ at $5\ mg/L$, and $70%$ at $8\ mg/L. What trend should be reported, and how should the $LD_{50}$ be described? A complete answer states that mortality increases with dose and that $50%$ mortality lies between $5\ mg/L$ and $8\ mg/L$, so the $LD_{50}$ must be estimated from the curve or by interpolation rather than claimed as an exact measured value. Then identify one possible indirect pathway by which the pollutant could harm organisms: altered habitat, reduced food availability, or reduced dissolved oxygen.
Source Materials
- AP Environmental Science Course and Exam Description
- Review the Clarifications (.pdf)
- AP Environmental Science Course Overview
- AP Environmental Science Course at a Glance
- AP Environmental Science Course at a Glance Poster
- AP Environmental Science
- AP Environmental Science
- AP Environmental Science Sample Syllabus 1