From the free course AP Environmental Science on Lykke
2.1 Ecosystem Services · 2.2 Island Biogeography
Key concepts: Ecosystem services · Provisioning services · Regulating services · Cultural services · Supporting services · Human disruptions to ecosystem services · Island biogeography theory · Calculating average number of species across islands · Invasive species range expansion · Spatial-temporal interpretation of species distributions
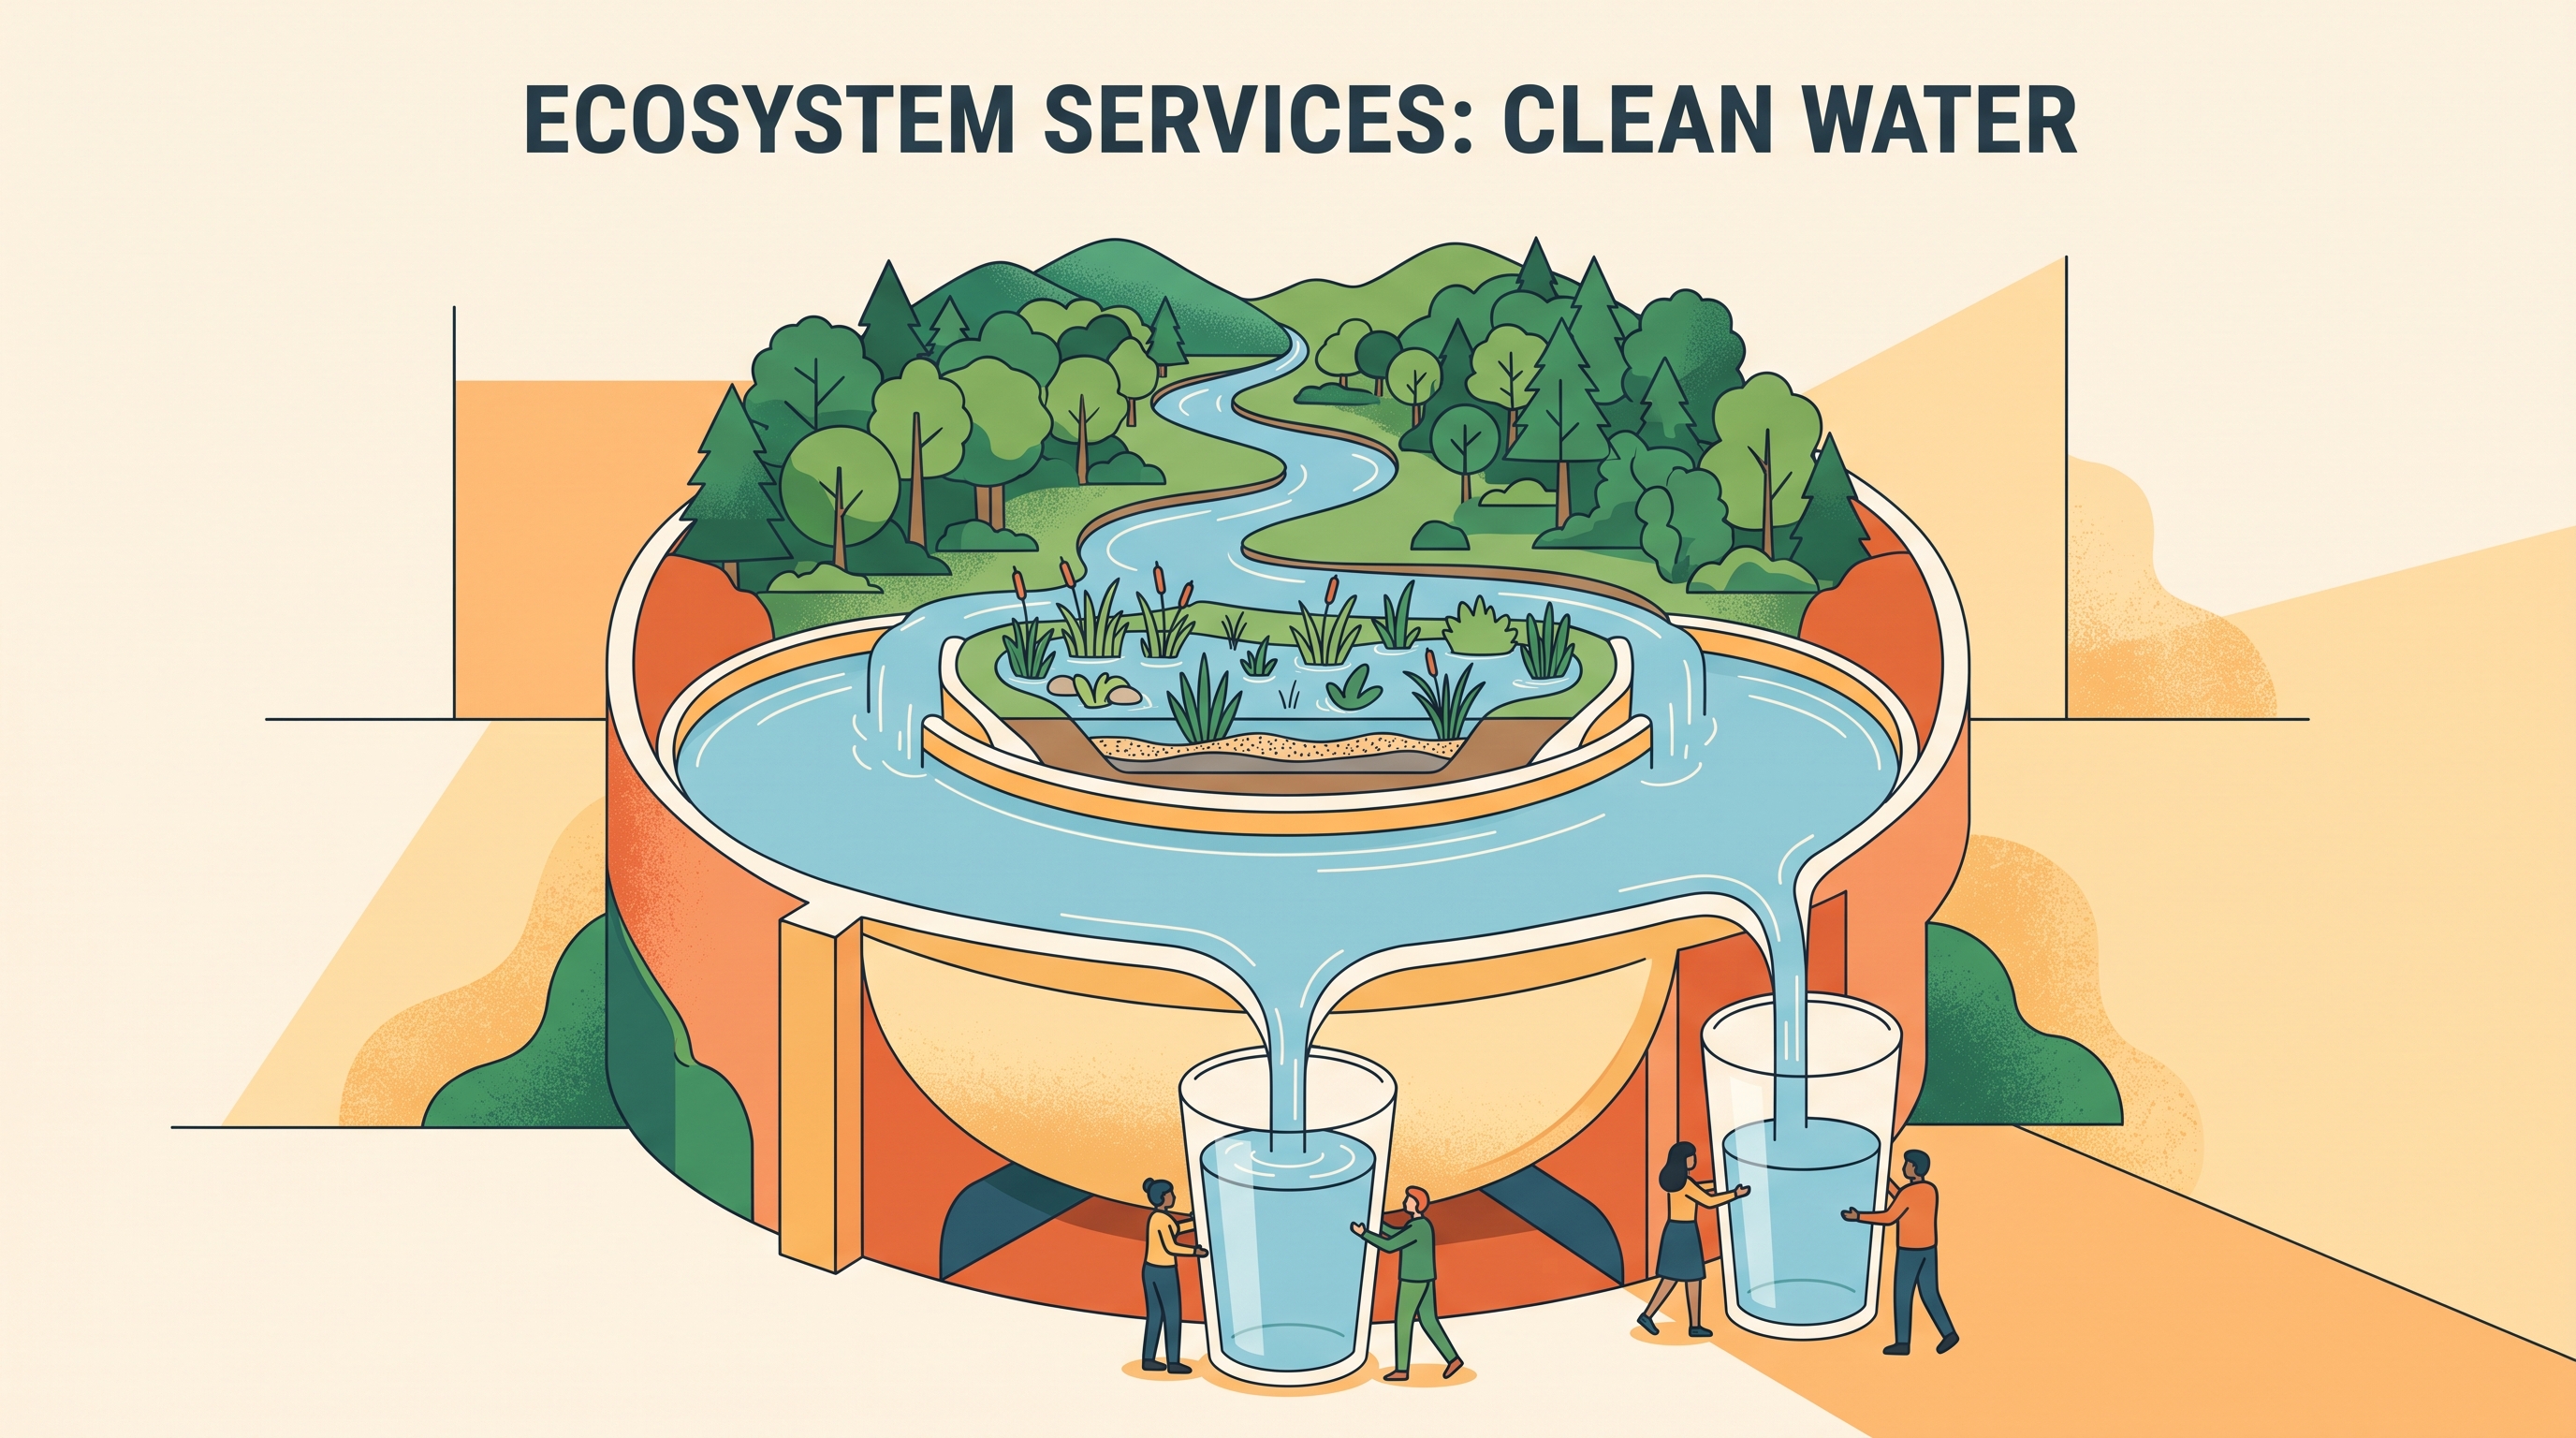
A forest can be valuable even when no timber is harvested: it may filter drinking water, store carbon, support pollinators, provide recreation, and sustain food webs.
2.1 Ecosystem Services · 2.2 Island Biogeography
A forest can be valuable even when no timber is harvested: it may filter drinking water, store carbon, support pollinators, provide recreation, and sustain food webs. These benefits are ecosystem services—the contributions ecosystems make to human well-being and economic activity.
Ecosystem services: four categories
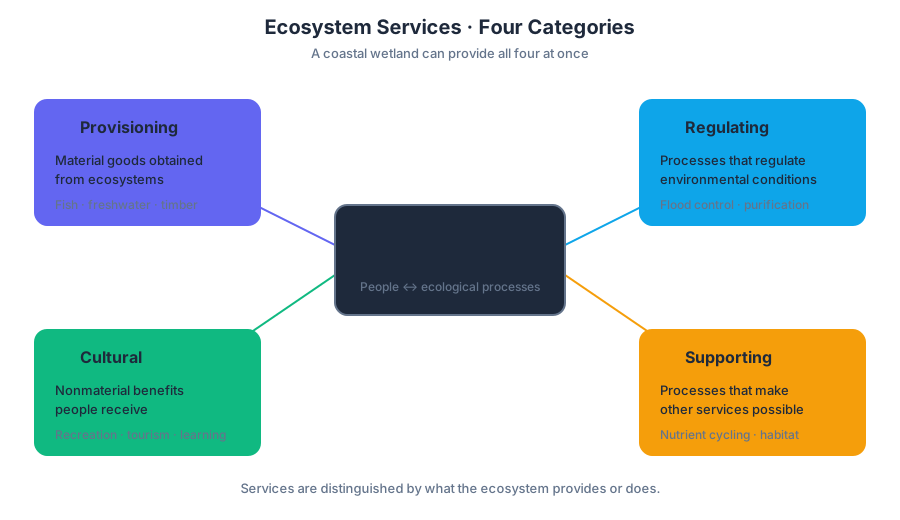
The CED organizes ecosystem services under ERT-2.B and ERT-2.B.1. The four categories are distinguished by what the ecosystem provides or does:
| Category | Meaning | Concrete examples |
|---|---|---|
| Provisioning services | Material goods obtained from ecosystems | Food, freshwater, timber, fuel, and medicinal resources |
| Regulating services | Natural processes that regulate environmental conditions | Flood control, water purification, climate regulation, pollination, and erosion control |
| Cultural services | Nonmaterial benefits people receive from ecosystems | Recreation, tourism, aesthetic value, spiritual meaning, and education |
| Supporting services | Fundamental ecological processes that make the other services possible | Primary productivity, nutrient cycling, soil formation, and habitat that supports organisms |
A single ecosystem can supply all four categories at once. A coastal wetland, for example, may provide fish and shellfish as provisioning services, reduce storm damage as a regulating service, attract visitors as a cultural service, and support nutrient cycling and nursery habitat as supporting services.
Human disruption of services
Under ERT-2.C, students must describe the results of human disruptions to ecosystem services. ERT-2.C.1 states that anthropogenic activities—activities caused by humans—can disrupt ecosystem services, producing both economic and ecological consequences.
Worked example: wetland conversion. Suppose a city drains a wetland to construct buildings. The immediate economic benefit may include new housing, roads, and commercial space. However, the lost wetland no longer stores as much floodwater, filters pollutants as effectively, or provides nursery habitat for fish. Flood-repair costs may increase, local fisheries may decline, and recreational value may be lost. One land-use decision therefore affects regulating, provisioning, cultural, and supporting services simultaneously.
Misconception check — “Only goods count as ecosystem services.” Timber and fish are provisioning services, but flood reduction and water purification are also services even though they are not harvested. A second misconception is that disruption must destroy an ecosystem completely; reducing a service’s capacity can be ecologically and economically significant even when the ecosystem remains visibly present.
For this topic, Science Practice 1.B, Concept Explanation, means connecting the human action to the ecological mechanism and then to the consequence. A strong explanation does not merely say “pollution harms wetlands”; it identifies the disrupted process—such as reduced water filtration—and explains the resulting ecological or economic effect.
Island biogeography: why size and isolation matter
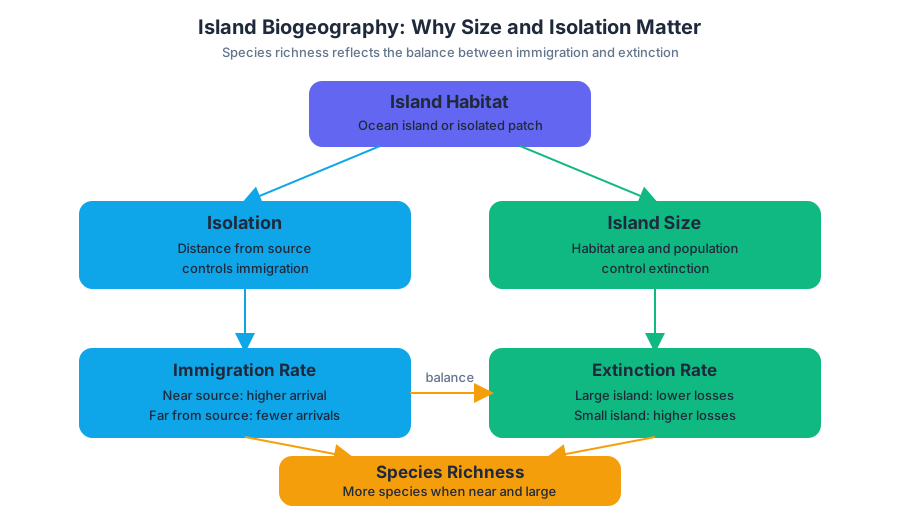
Island biogeography theory explains patterns of species richness on islands or island-like habitats. Immigration tends to be higher on islands closer to a source population, while extinction tends to be lower on larger islands because they contain more habitat and usually support larger populations.
The “island” can be a literal oceanic island or an isolated habitat patch surrounded by unsuitable conditions. A small, distant reserve generally receives fewer colonizing species and loses species more easily than a large, nearby reserve.
Worked calculation: adding an island
Imagine three islands containing $12$, $18$, and $24$ bird species. The calculated average number of species is
$$ \bar{S}=\frac{12+18+24}{3}=18\text{ species}. $$
A new island is surveyed and contains $30$ species. The revised average is
$$ \bar{S}_{\text{new}}=\frac{12+18+24+30}{4} =\frac{84}{4} =21\text{ species}. $$
The average increases from $18$ to $21$ species because the added island has more species than the original average. If the new island had contained only $10$ species, the new average would instead be
$$ \frac{12+18+24+10}{4}=16\text{ species}. $$
Misconception check — “Adding an island always increases the average.” The average depends on the new island’s species count relative to the existing average. Also, adding a species-rich island to a dataset changes the calculated average; it does not automatically prove that every island became more diverse.
Asian carp: reading expansion on a distribution map
Distribution maps turn island-biogeography reasoning into a spatial-temporal investigation. In the 1970s, Asian carp distribution was concentrated at a single point in the southern Mississippi River basin near the junction of the Mississippi and Ohio rivers. By 2021, the distribution extended throughout the Mississippi River mainstem from the Gulf of Mexico to Minnesota.
The 2021 range also expanded up the Missouri and Ohio rivers, with movement northwest and northeast along connected river systems. Compared with the smaller 1970s range, the later distribution covered a much larger network of waterways.
When interpreting the map, identify the geographic features first: the Mississippi River mainstem, the Missouri River, the Ohio River, the Gulf of Mexico, and Minnesota. Then compare the two dates by asking: Where was the species present initially, and in which directions did the range expand? This applies Science Practice 2.A, Visual Representations, and Science Practice 2.C, Visual Representations, because the map must be used to identify features and explain a spatial change over time.
Introducing an invasive species can disrupt ecosystem services. Asian carp may compete with native fish for food and habitat, alter food-web relationships, and reduce native biodiversity. Those ecological changes can also affect provisioning services such as commercial or subsistence fishing and cultural services such as recreation and sport fishing.
Retrieval check
A new island contains $14$ species, while the existing islands average $11$ species. Will adding it raise or lower the calculated average? On an Asian carp map, what evidence would demonstrate range expansion rather than simply a change in reporting?
Answer: Adding an island with $14$ species raises the average because $14>11$. Evidence of range expansion would be presence in new connected waterways—such as the Missouri and Ohio rivers and the Mississippi River reach toward Minnesota—compared with the concentrated 1970s distribution near the Mississippi–Ohio junction.
Source Materials
- AP Environmental Science Course and Exam Description
- Review the Clarifications (.pdf)
- AP Environmental Science Course Overview
- AP Environmental Science Course at a Glance
- AP Environmental Science Course at a Glance Poster
- AP Environmental Science
- AP Environmental Science
- AP Environmental Science Sample Syllabus 1
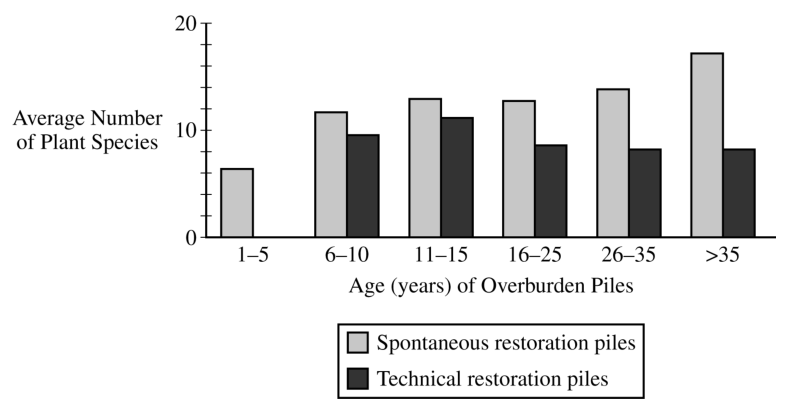
- (a) Based on the data in the graph, identify the average number of species found in technically restored piles 16–25 years after restoration started.
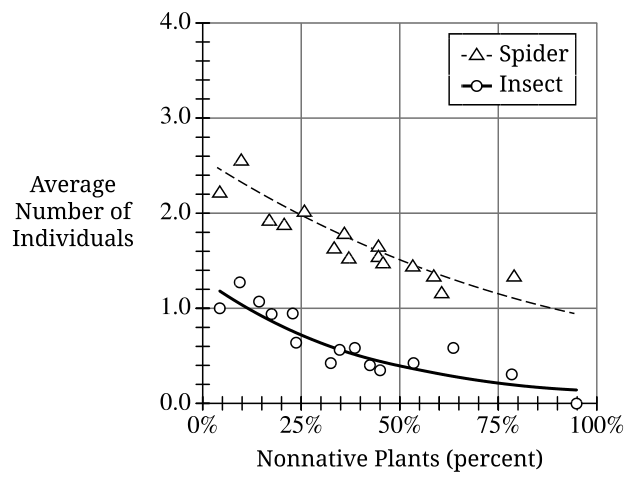
- Figure 1. Percentage of Nonnative Plants and Average Number of Individual
- AP/College Environmental Science-Khan Academy
- AP Environmental Science Exam-College Board