From the free course AP Environmental Science on Lykke
AP Practice 4
A strong AP Environmental Science data response does more than identify a trend: it uses evidence from a graph or table, performs the required calculation, and connects the result to an environmental mechanism.
AP Practice 4
A strong AP Environmental Science data response does more than identify a trend: it uses evidence from a graph or table, performs the required calculation, and connects the result to an environmental mechanism. This practice targets the quantitative data interpretation and calculations task type in the free-response section.
Exam context: The current AP Environmental Science exam includes a free-response section with three questions in $70$ minutes. A practical target for one data-focused question is approximately $23$ minutes, including reading, calculating, and checking units. The task below is original and unofficial.
The investigation: runoff from two watersheds
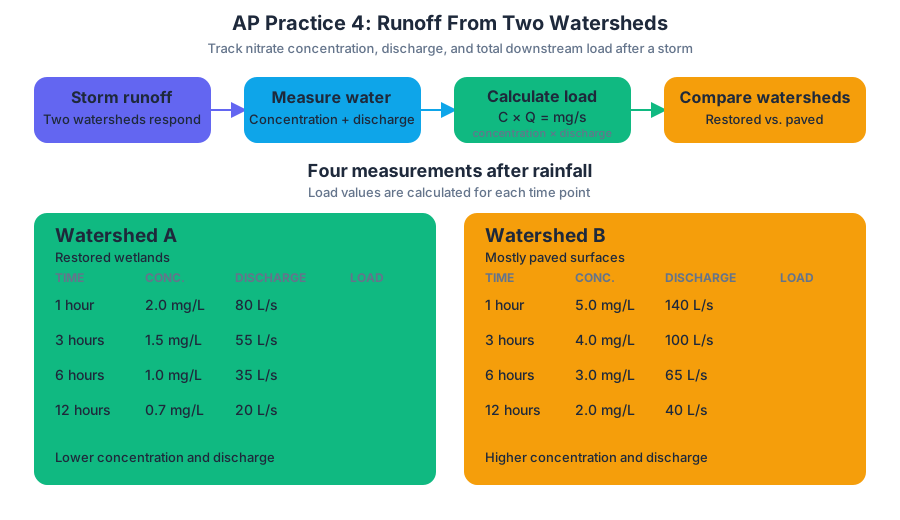
A city compares nitrate pollution from two watersheds after a storm. Watershed A contains restored wetlands; Watershed B contains mostly paved surfaces and storm drains. Researchers measure nitrate concentration in stream water and stream discharge at four times after rainfall.
| Time after storm | Watershed A nitrate concentration ($mg/L$) | Watershed A discharge ($L/s$) | Watershed B nitrate concentration ($mg/L$) | Watershed B discharge ($L/s$) |
|---|---|---|---|---|
| $1$ hour | $2.0$ | $80$ | $5.0$ | $140$ |
| $3$ hours | $1.5$ | $55$ | $4.0$ | $100$ |
| $6$ hours | $1.0$ | $35$ | $3.0$ | $65$ |
| $12$ hours | $0.7$ | $20$ | $2.0$ | $40$ |
Key relationship: Nitrate concentration describes how much nitrate is present per unit volume of water. Nitrate load describes the total rate at which nitrate moves downstream:
$$\text{nitrate load} = \text{nitrate concentration} \times \text{discharge}$$
Because $1\ mg/L$ multiplied by $1\ L/s$ equals $1\ mg/s$, the resulting load is measured in $mg/s$.
Practice prompt
(a) Calculate the nitrate load for Watershed A at $1$ hour after the storm. Show your setup and include units.
(b) Identify the relationship between time after the storm and nitrate concentration in Watershed B.
(c) Using the data, explain why Watershed B may deliver a greater total amount of nitrate to the stream even if its concentration later declines.
(d) Calculate the percentage by which Watershed B’s nitrate concentration exceeds Watershed A’s concentration at $3$ hours.
(e) Propose one environmental solution that could reduce nitrate delivery from Watershed B. Explain the mechanism by which the solution would work.
Worked reasoning
(a) Calculate a nitrate load
Use the concentration and discharge recorded for Watershed A at $1$ hour:
$$\text{load} = (2.0\ mg/L)(80\ L/s)$$
$$\text{load} = 160\ mg/s$$
The units are important: liters cancel, leaving $mg/s$. A response that gives only $160$ without units is incomplete because it does not identify whether the value represents concentration, mass, or rate.
(b) Interpret the trend
Watershed B’s nitrate concentration decreases as time after the storm increases: it falls from $5.0\ mg/L$ at $1$ hour to $2.0\ mg/L$ at $12$ hours. This is a negative relationship, or inverse trend, over the measured period.
(c) Distinguish concentration from total delivery
Watershed B has both higher nitrate concentrations and higher discharges than Watershed A at every recorded time. At $1$ hour, for example:
$$\text{Watershed B load}=(5.0\ mg/L)(140\ L/s)=700\ mg/s$$
Although the concentration later decreases, flowing water continues to transport nitrate. A high discharge can maintain a large nitrate load even when concentration is lower. This distinction is central: concentration is intensity per volume; load is the mass transported per time.
(d) Calculate percentage difference
At $3$ hours, Watershed B measures $4.0\ mg/L$ and Watershed A measures $1.5\ mg/L$. The percentage by which B exceeds A is:
$$\frac{4.0-1.5}{1.5}\times 100 = 166.7%$$
Watershed B’s nitrate concentration is therefore approximately $167%$ greater than Watershed A’s at $3$ hours. The denominator is Watershed A because A is the comparison baseline.
(e) Propose and justify a solution
One effective solution would be to install constructed wetlands or vegetated riparian buffers between paved areas and the stream. Vegetation slows runoff, increases infiltration, and allows soil microorganisms to remove nitrate through denitrification. The intervention addresses both major pathways shown by the data: excess runoff and elevated nitrate transport.
A vague answer such as “reduce pollution” does not explain the environmental mechanism. A high-scoring proposed solution identifies a specific action and connects it to a process that lowers nitrate concentration, discharge, or both.
What the examiner is looking for
| Response move | Evidence of successful reasoning |
|---|---|
| Calculation | Correct substitution, arithmetic, and units |
| Trend interpretation | Direction of change supported by at least two data values |
| Data-based explanation | Uses both concentration and discharge rather than discussing only one |
| Percentage calculation | Correct baseline and percentage format |
| Environmental solution | Specific intervention plus a scientifically valid mechanism |
Misconception check
Misconception: “A lower concentration always means less pollution.” Not necessarily. If discharge increases substantially, the stream can carry a greater nitrate load. For example, $2.0\ mg/L$ at $140\ L/s$ produces $280\ mg/s$, while $5.0\ mg/L$ at $40\ L/s$ produces only $200\ mg/s$.
Error-review routine
After completing a data-response question, check four things: Did you answer every lettered part? Did every calculation show a setup and units? Did each trend claim cite numerical evidence? Did every proposed solution include a mechanism? Mark the first point at which your reasoning failed—reading the table, choosing the equation, calculating, interpreting, or explaining—and redo only that step before reviewing the full answer.
Retrieval check
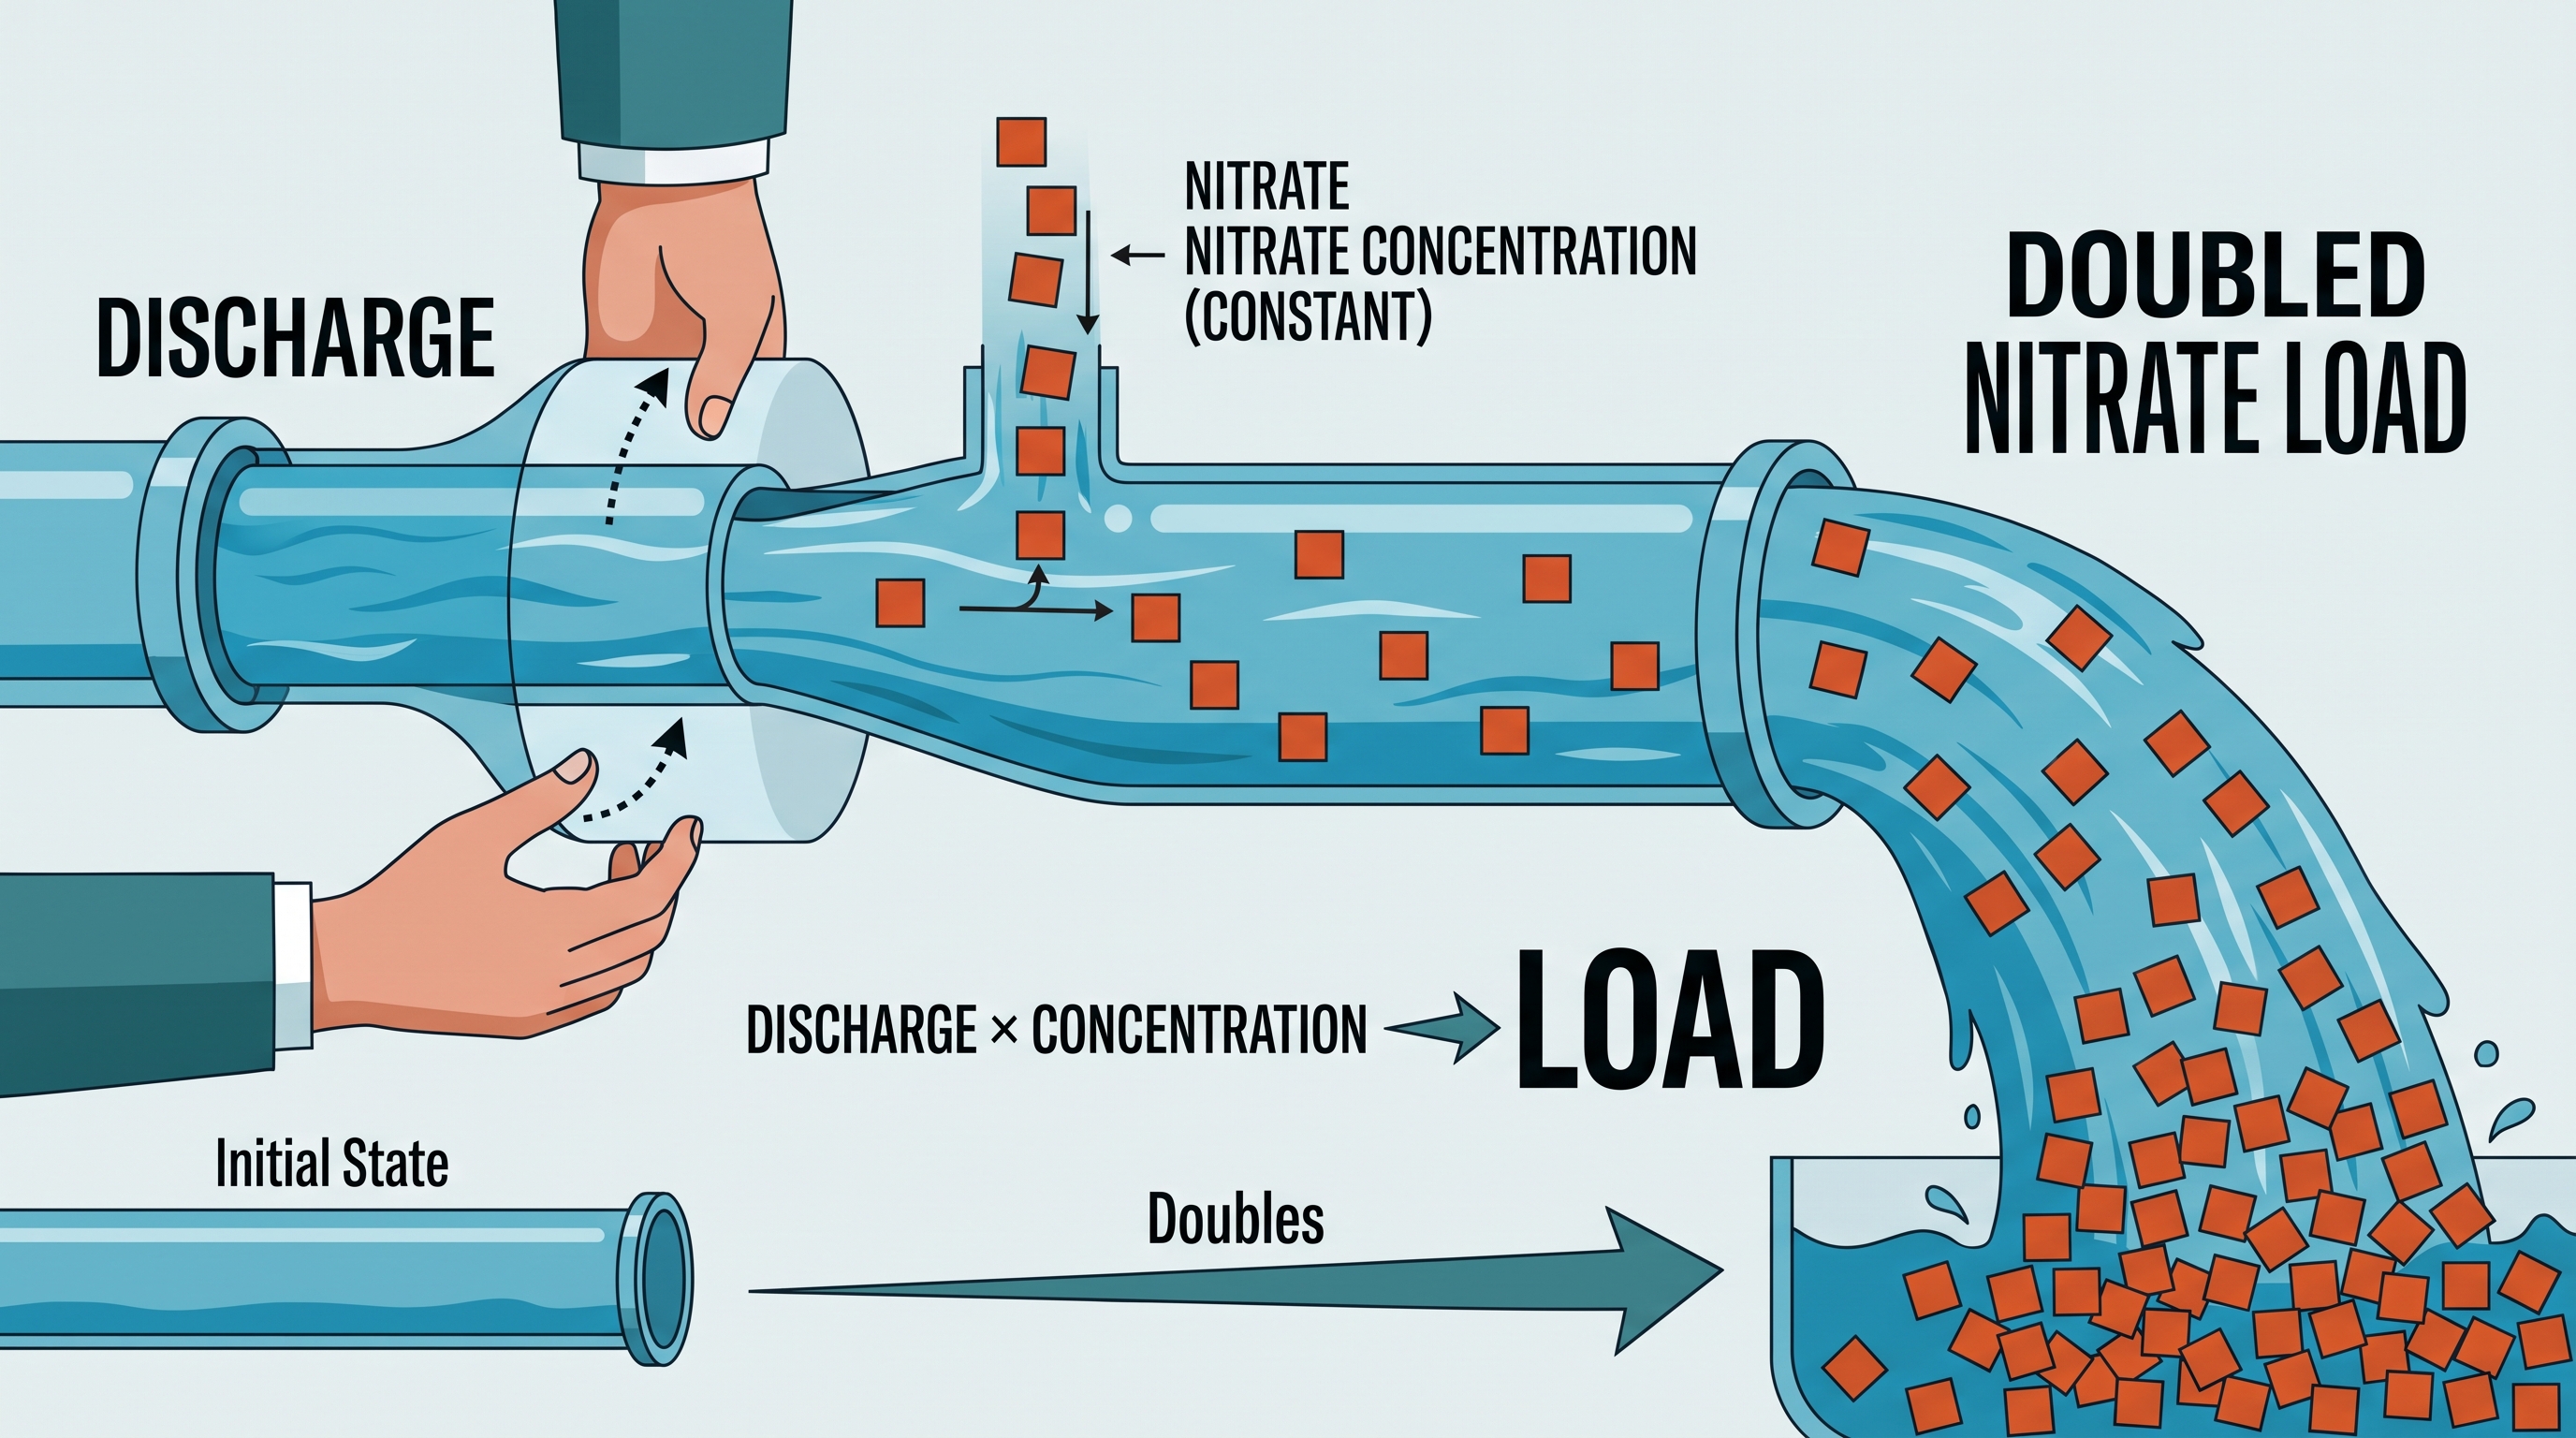
If discharge doubles while nitrate concentration stays constant, what happens to nitrate load? The load doubles, because:
$$\text{load} = \text{concentration} \times \text{discharge}$$
Source Materials
- AP Environmental Science Course and Exam Description
- Review the Clarifications (.pdf)
- AP Environmental Science Course Overview
- AP Environmental Science Course at a Glance
- AP Environmental Science Course at a Glance Poster
- AP Environmental Science
- AP Environmental Science
- AP Environmental Science Sample Syllabus 1
- AP/College Environmental Science-Khan Academy
- AP Environmental Science Exam-College Board
- AP Environmental Science Units-Save my Exams
- AP Environmental Science-Bozeman Science