From the free course AP Environmental Science on Lykke
1.9 Trophic Levels · 1.10 Energy Flow and the 10% Rule
Key concepts: Trophic levels · Energy flow through ecosystems · The 10% rule · Producers · Primary, secondary, and tertiary consumers · Food chains and food webs · Omnivores and carnivores · Detritivores and decomposers · Nutrient cycling · Energy and matter in ecosystems
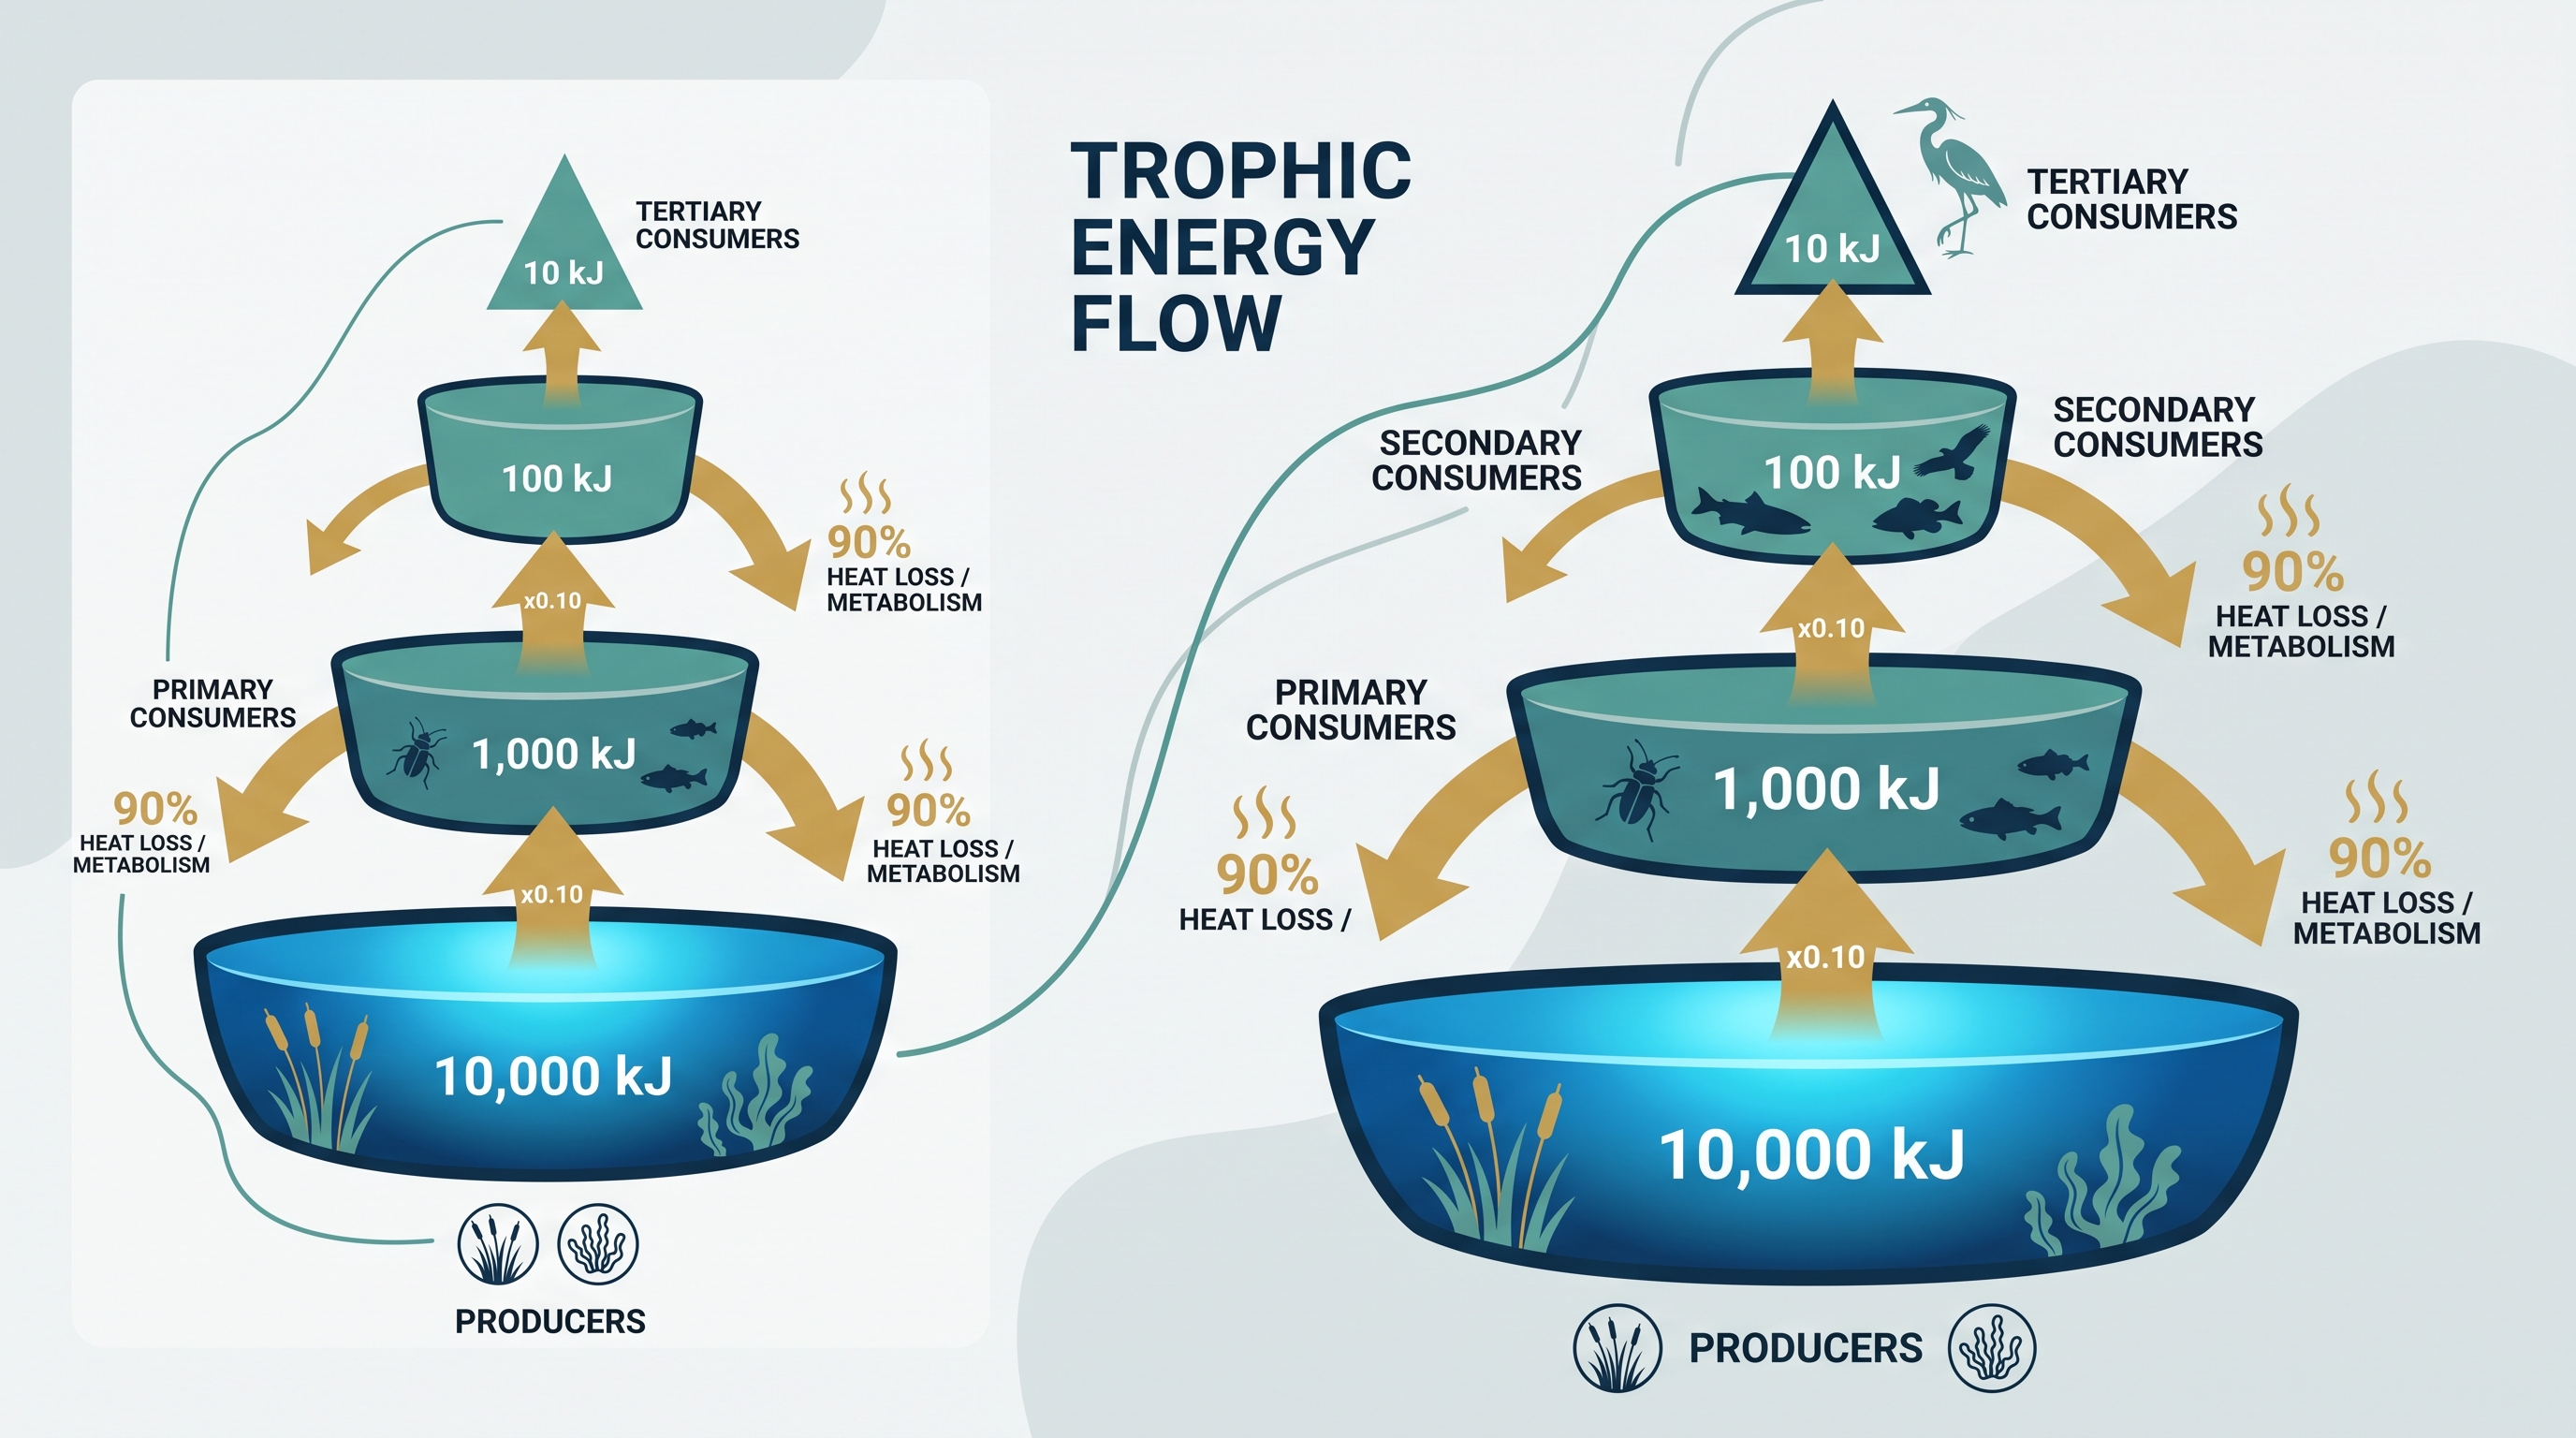
Only about $10\%$ of the energy available at one trophic level reaches the next, so ecosystems contain progressively less usable energy as energy moves upward from producers to consumers.
1.9 Trophic Levels · 1.10 Energy Flow and the 10% Rule
Only about $10%$ of the energy available at one trophic level reaches the next, so ecosystems contain progressively less usable energy as energy moves upward from producers to consumers.
The energy staircase
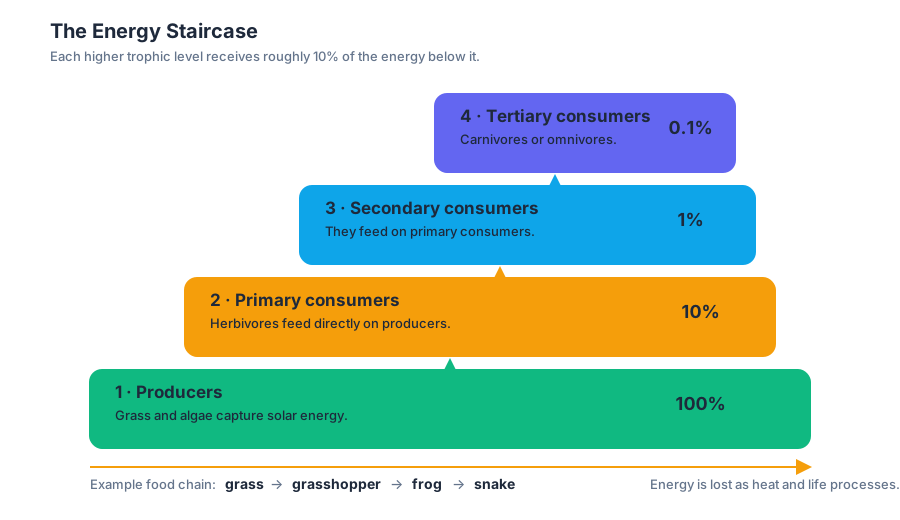
Imagine a staircase whose bottom step is wide and whose higher steps become sharply narrower. The bottom step represents producers, organisms such as plants and algae that capture solar energy and store it as chemical energy. Each higher step represents a trophic level, or feeding position in an ecosystem.
Under ENG-1.C and its required knowledge, trophic levels organize organisms according to how they obtain energy:
- Producers occupy the first trophic level.
- Primary consumers occupy the second trophic level and feed directly on producers. They are usually herbivores.
- Secondary consumers occupy the third trophic level and feed on primary consumers.
- Tertiary consumers occupy the fourth trophic level and feed on secondary consumers. They may be carnivores or omnivores.
A useful chain is:
$$ \text{grass} \rightarrow \text{grasshopper} \rightarrow \text{frog} \rightarrow \text{snake} $$
Here, grass is the producer, the grasshopper is the primary consumer, the frog is the secondary consumer, and the snake is the tertiary consumer. The arrows represent the direction of energy transfer: energy moves from the organism being eaten to the organism that eats it.
Why energy decreases upward
At every trophic level, organisms use much of the energy they obtain for cellular respiration, movement, growth, reproduction, and maintaining body functions. Much of that energy ultimately leaves the ecosystem as heat; additional energy remains in uneaten material or waste. Therefore, only about one-tenth is transferred to the next level.
10% rule:
$$\text{Energy transferred} = 0.10 \times \text{energy available at the previous trophic level}$$
The remaining energy is approximately:
$$ \text{Energy lost} = 0.90 \times \text{energy available at the preceding trophic level} $$
The $10%$ value is an ecological approximation, not a fixed law. Transfer efficiency varies among ecosystems and organisms, but the reliable exam pattern is that energy decreases as it flows from lower to higher trophic levels.
Worked example: tracing energy through four levels
Suppose producers contain $20{,}000\ \text{kJ}$ of available chemical energy. Calculate the energy transferred to each succeeding trophic level.
$$ \text{Primary consumers} = 0.10(20{,}000\ \text{kJ}) = 2{,}000\ \text{kJ} $$
$$ \text{Secondary consumers} = 0.10(2{,}000\ \text{kJ}) = 200\ \text{kJ} $$
$$ \text{Tertiary consumers} = 0.10(200\ \text{kJ}) = 20\ \text{kJ} $$
The decrease from producers to tertiary consumers is:
$$ 20{,}000\ \text{kJ} - 20\ \text{kJ} = 19{,}980\ \text{kJ} $$
Thus, only $20\ \text{kJ}$ reaches the tertiary level, while approximately $19{,}980\ \text{kJ}$ is not transferred upward. A correct AP response reports both the calculation and the unit, such as $\text{kJ}$.
Food chains, food webs, and the matter–energy distinction
A food chain is a single pathway showing energy and matter moving through trophic levels. A food web combines interlocking food chains, giving a more realistic picture because most organisms eat—and are eaten by—multiple species.
For example, a grassland plant may be eaten by grasshoppers, rabbits, and mice. Grasshoppers may be eaten by frogs and birds, while mice may be eaten by snakes and hawks. If one species disappears, several pathways can change, producing positive or negative feedback effects in the web. This relationship is identified in ENG-1.D.2.
Energy and matter behave differently:
| Ecosystem quantity | Typical behavior |
|---|---|
| Energy | Enters primarily as sunlight, moves through trophic levels, and is eventually released as heat |
| Matter | Moves among organisms and the nonliving environment through cycles |
| Nutrients | Returned to soil and water by waste, death, detritivores, and decomposers |
Detritivores consume dead organic material, while decomposers chemically break down that material. Together they return nutrients to soil and make those nutrients available again to producers. They recycle matter, but they do not recycle energy back into sunlight or restore energy lost as heat.
Misconception check
Misconception: The arrows in a food web point toward the organism that provides food.
Correction: Arrows point in the direction of energy transfer—from the food organism to the consumer.
Another common error is to calculate $10%$ of the original producer energy at every step. Instead, apply the rule repeatedly to the previous trophic level. Starting with $5{,}000\ \text{kJ}$, the next levels contain $500\ \text{kJ}$, then $50\ \text{kJ}$, then $5\ \text{kJ}$.
AP science practices in action
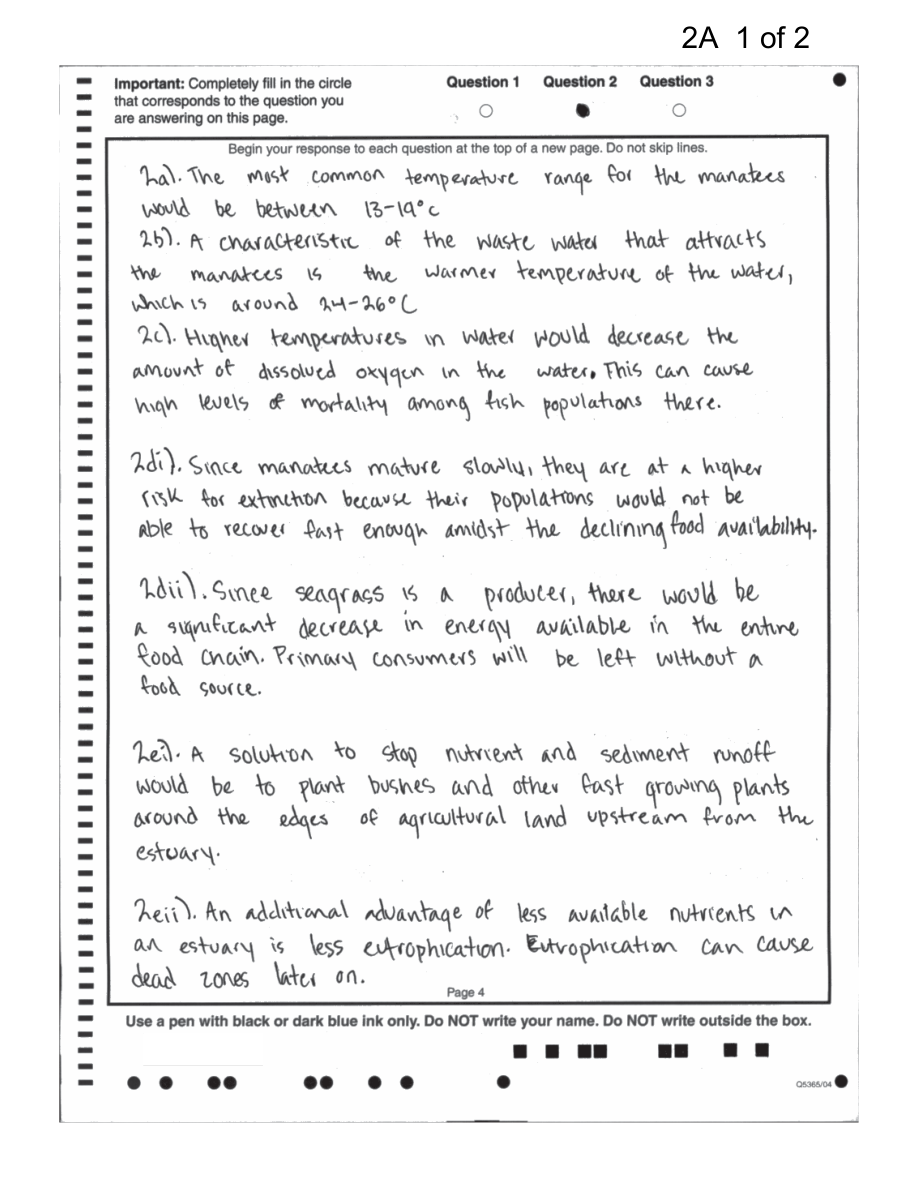
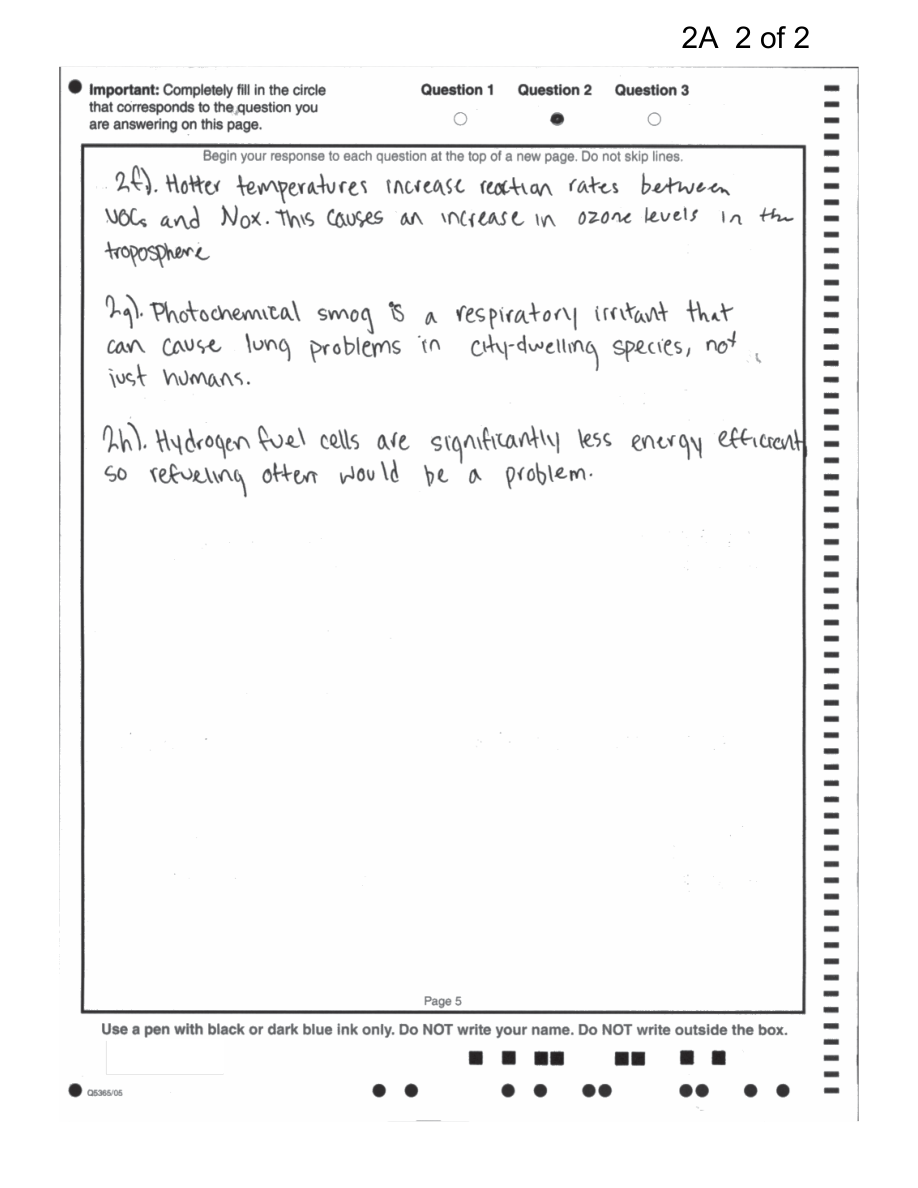
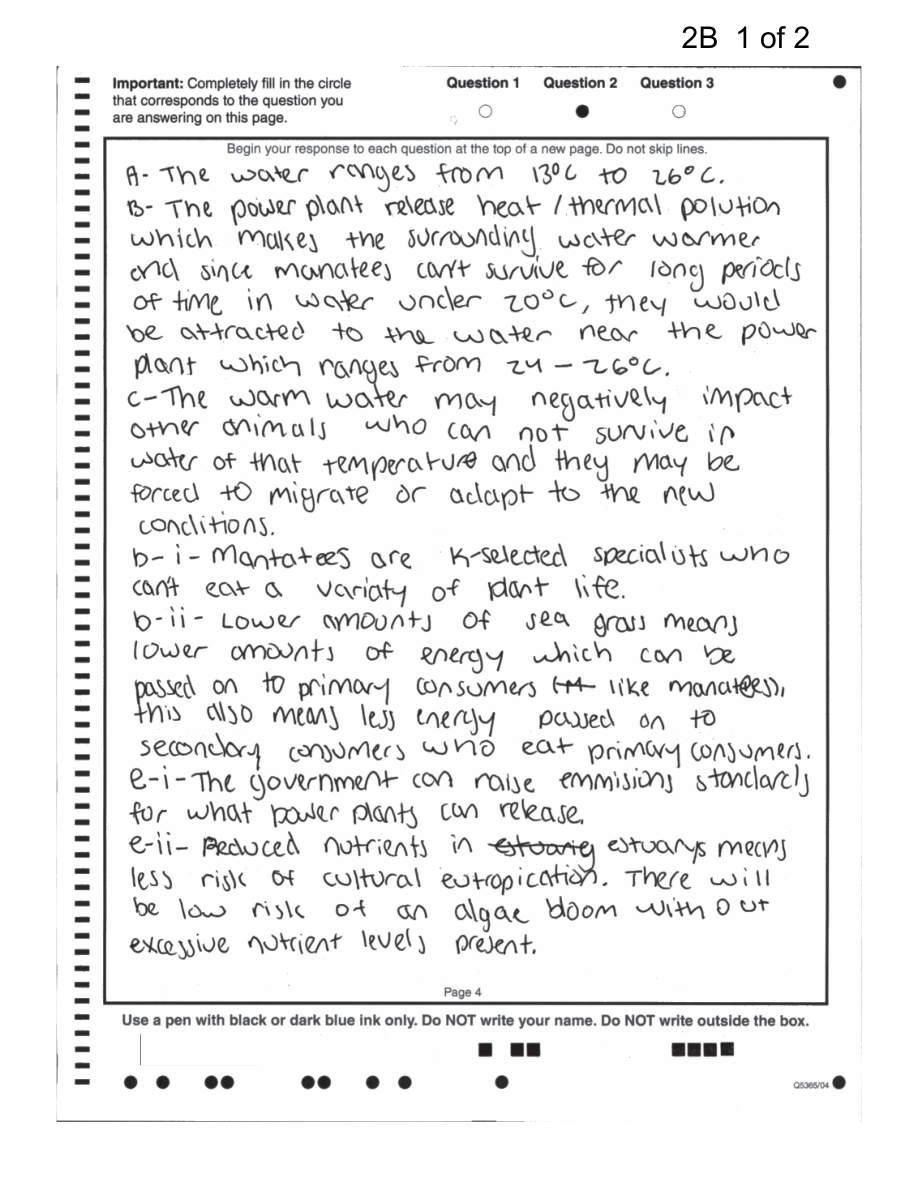
Science Practice 2: Visual Representations, especially 2.A — Describe characteristics of an environmental concept, process, or model represented visually, is assessed when you identify trophic levels, interpret arrows, or explain a food-web diagram. Science Practice 6: Mathematical Routines, especially 6.B — Apply mathematical routines, is assessed when you use the $0.10$ relationship, calculate energy loss, and include appropriate units.
Retrieval check: In a chain containing algae, zooplankton, small fish, and a heron, identify the primary and tertiary consumers. If the algae contain $8{,}000\ \text{kJ}$, how much energy is available to the heron? Explain why nutrients may return to the algae but energy does not.
Source Materials
- AP Environmental Science Course and Exam Description
- Review the Clarifications (.pdf)
- AP Environmental Science Course Overview
- AP Environmental Science Course at a Glance
- AP Environmental Science Course at a Glance Poster
- AP Environmental Science
- AP Environmental Science
- AP Environmental Science Sample Syllabus 1
- Figure — Sample Responses Question 2 - Set 1 (p. 5)
- Figure — Sample Responses Question 2 - Set 1 (p. 6)
- Figure — Sample Responses Question 2 - Set 1 (p. 7)
- Figure — Sample Responses Question 2 - Set 1 (p. 8)