From the free course AP Environmental Science on Lykke
3.5 Population Growth and Resource Availability · 3.6 Age Structure Diagrams
Key concepts: Population growth · Resource availability · Carrying capacity · Finite resource base · Population growth rates · Age structure diagrams · Population age distribution · Stable and declining populations · Social and cultural factors · Population fluctuations
A population can expand rapidly when food, water, space, and other necessities are abundant—but no population can draw indefinitely from an unlimited supply. Resource availability connects the short-term rate of population growth to the longer-term limits imposed by a finite environment.
3.5 Population Growth and Resource Availability · 3.6 Age Structure Diagrams
A population can expand rapidly when food, water, space, and other necessities are abundant—but no population can draw indefinitely from an unlimited supply. Resource availability connects the short-term rate of population growth to the longer-term limits imposed by a finite environment.
3.5 Population Growth and Resource Availability
The resource base is the total amount of usable resources available to a population. It includes necessities such as nutrients, water, food, shelter, and space. Because these resources are limited and finite over all scales of time, population growth cannot remain exponential forever.
ERT-3.F.1: Population growth is limited by environmental factors, especially by available resources and space.
ERT-3.F.2: Resource availability and the total resource base are limited and finite over all scales of time.
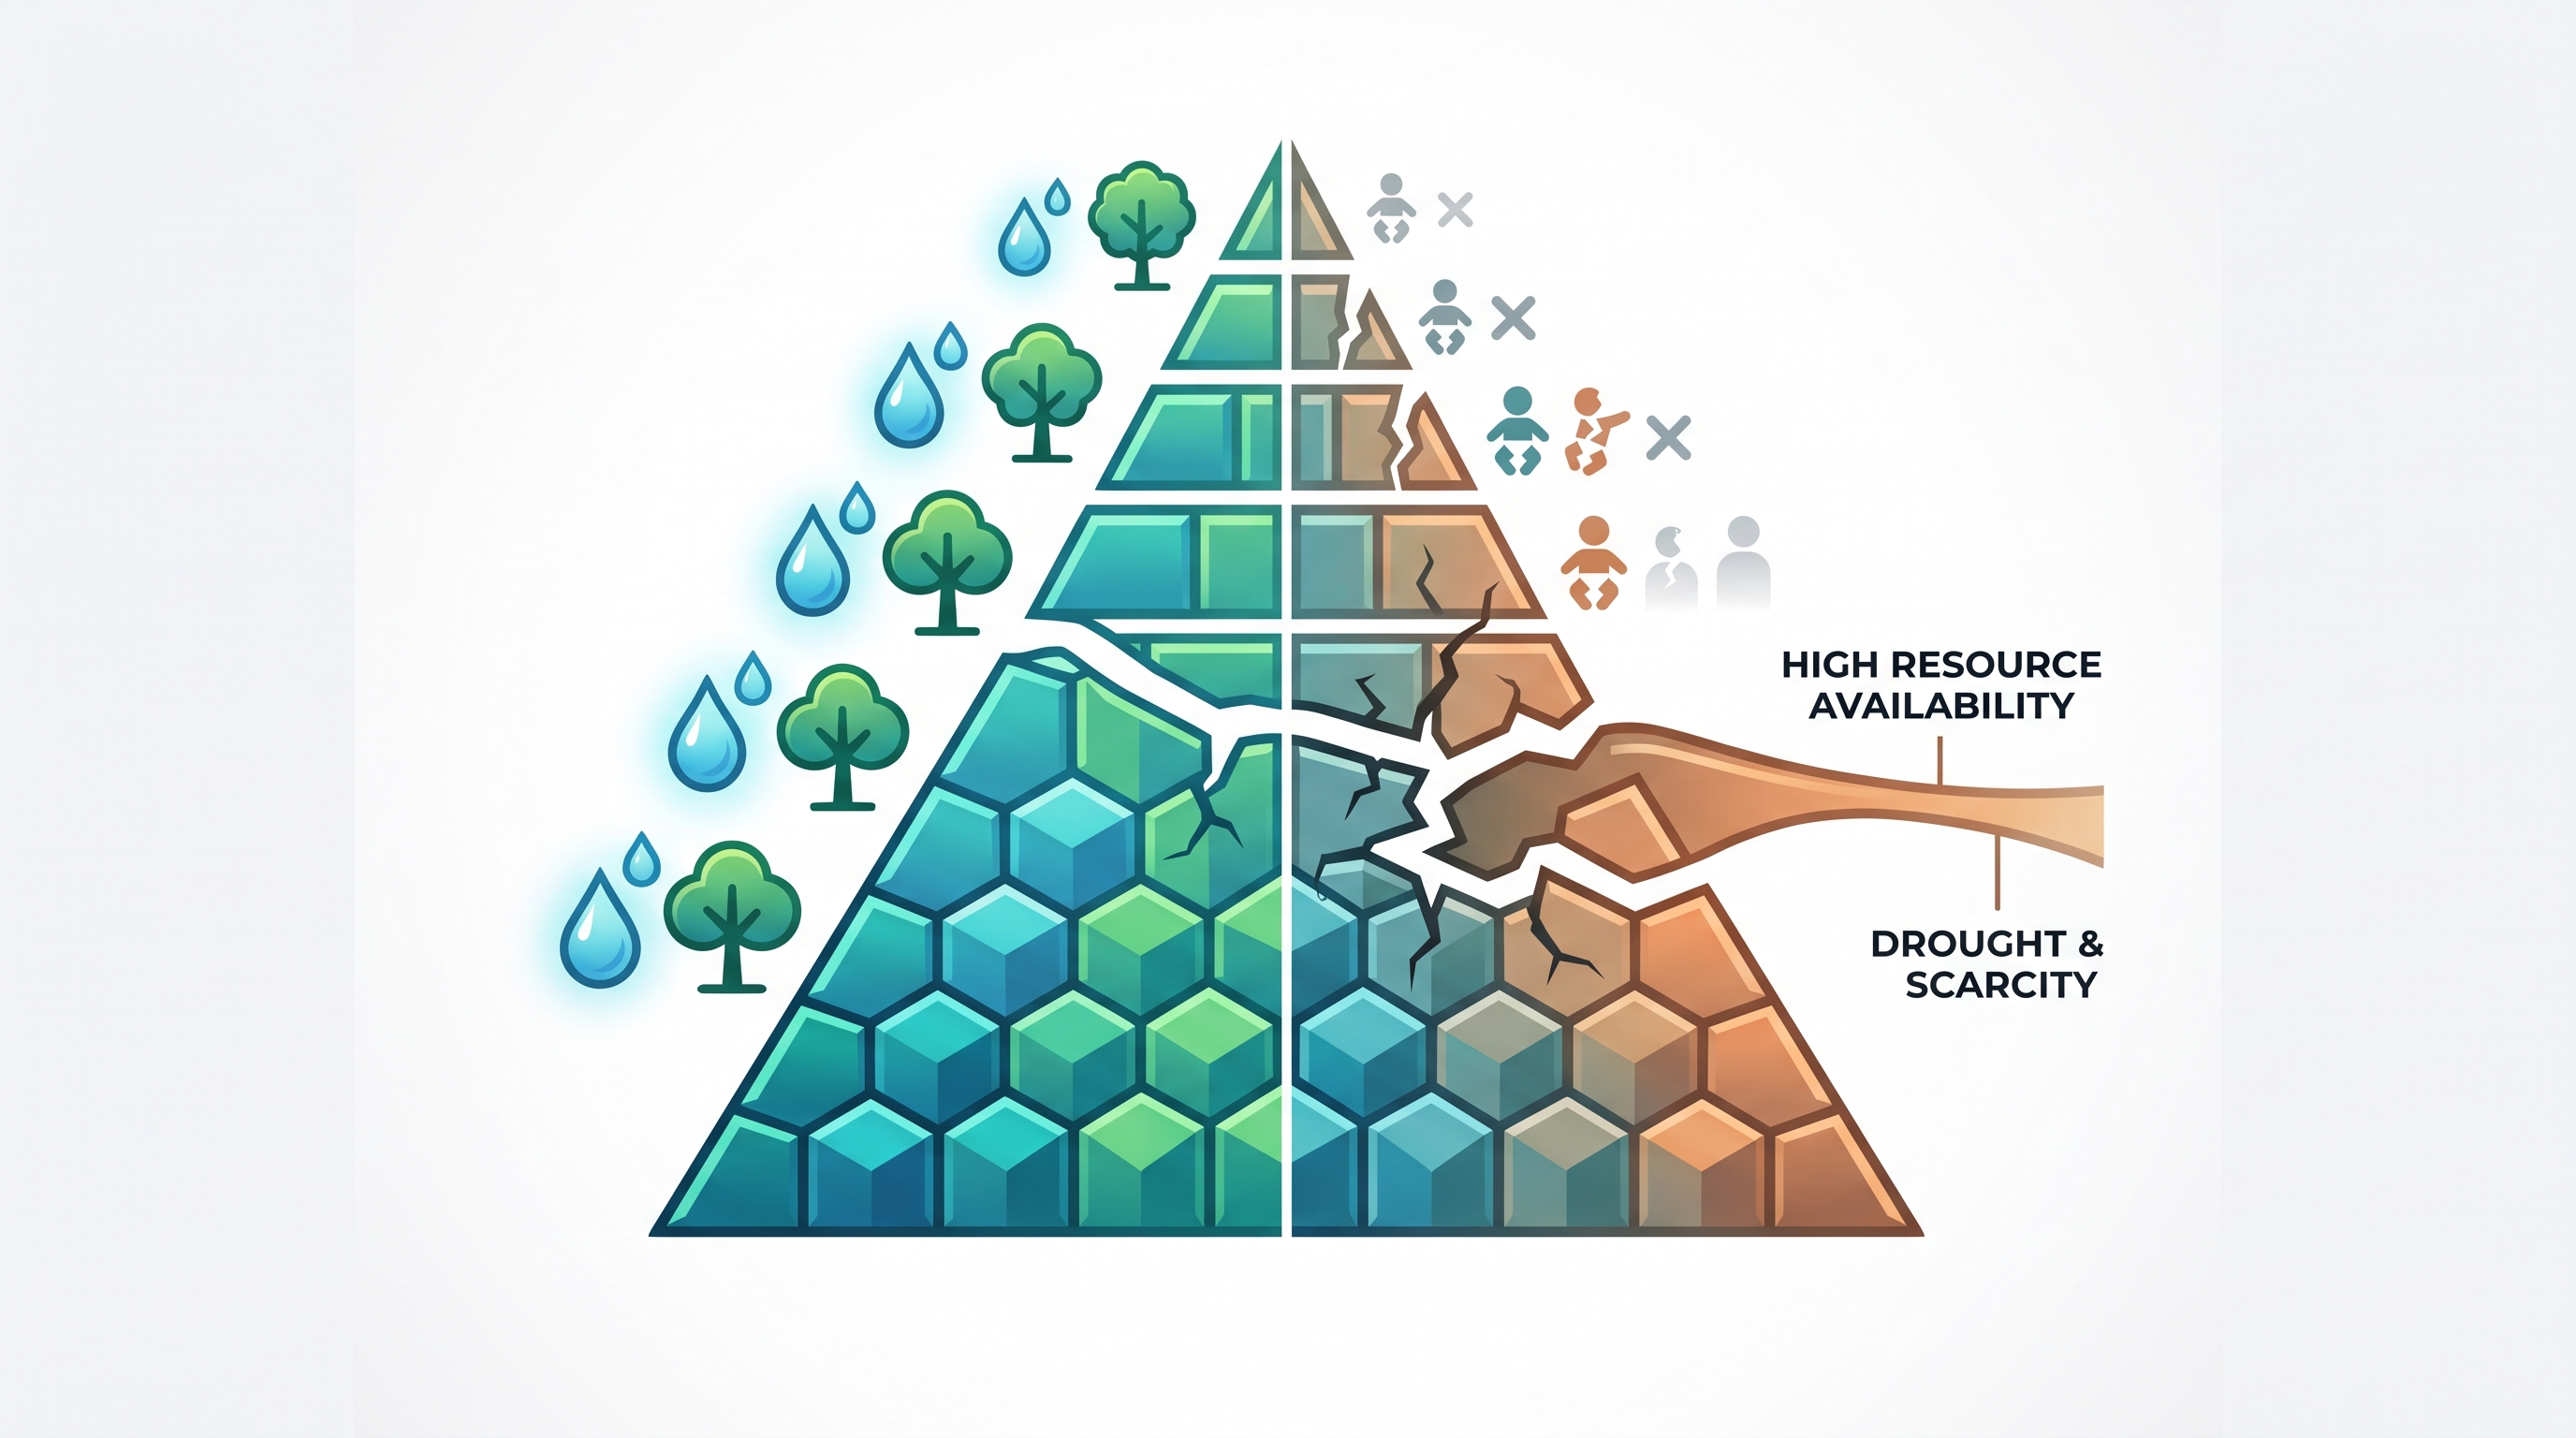
When resources needed for reproduction and survival are abundant, population growth usually accelerates. As the resource base shrinks, competition increases; resources may be distributed unevenly, causing increased mortality, decreased fecundity—the ability to reproduce—or both. Growth may then decline to, or remain at or below, carrying capacity.
Worked example — a deer population: A protected valley begins with $200$ deer and plentiful vegetation. One year later, the population is $230$. The numerical change is
$$ \Delta N = 230 - 200 = 30 \text{ deer}. $$
The finite growth rate is
$$ \frac{\Delta N}{N_0} = \frac{30}{200} = 0.15, $$
or $15%$ per year. If drought reduces plant growth, the population may experience less food, lower birth rates, and higher death rates. Even if the valley’s physical area remains unchanged, its effective resource base has declined, so population growth can slow, stop, or become negative.
Population change should be analyzed with graphs and tables rather than guessed from a single value. A rising population may still be growing more slowly if the slope of its graph is decreasing. A temporary decline may represent dieback, a sharp population reduction caused by famine, disease, conflict, or another limiting factor, rather than a permanent disappearance.
The AP skill 6.B Mathematical Routines is assessed when you calculate and interpret quantities such as population change, growth rate, or percent change. The AP skill 5.C Data Analysis is assessed when you use a graph or table to identify a trend, compare time intervals, and draw a conclusion supported by the data.
Misconception check — “carrying capacity is a permanent number.” Carrying capacity is not automatically fixed. If rainfall, food production, habitat quality, technology, disease prevalence, or conflict changes, the resources available to the population can change as well. A population may therefore fluctuate around a changing limit.
3.6 Age Structure Diagrams
An age structure diagram represents the age distribution of a population. It commonly displays younger individuals at the bottom and older individuals at the top, with males on one side and females on the other. The diagram’s overall shape provides evidence about likely population growth.
EIN-1.A.1: Population growth rates can be interpreted from age structure diagrams by the shape of the structure.
EIN-1.A.2: A rapidly growing population will, as a rule, have a higher proportion of younger people compared to stable or declining populations.
A broad-based, triangular diagram indicates many young people who may soon enter reproductive ages. This age distribution generally signals a growing population. A more column-shaped diagram contains similar proportions across many age groups and suggests a relatively stable population. A narrower-based or top-heavy diagram contains fewer young people and is associated with a declining population.
Worked interpretation: Imagine three countries with the same total population. Country A has a very wide base, Country B has nearly vertical sides, and Country C has a narrow base with a larger older population. Country A is likely to grow fastest because a greater fraction of its population is young. Country B is likely to change slowly, while Country C may decline unless migration or a later increase in births changes the pattern.
Age structure does not determine population change by itself. Social and cultural factors—including access to education and health care, cultural expectations, economic conditions, family planning, and the age at which people have children—can influence birth rates and therefore reshape the diagram over time. Human populations also change through births, deaths, immigration, and emigration.
Misconception check — “a large young population is already growing at its maximum rate.” A youthful age structure indicates potential for continued growth, not a guaranteed growth rate. If resources are scarce or social conditions change, birth rates may fall and mortality may rise.
Retrieval Check
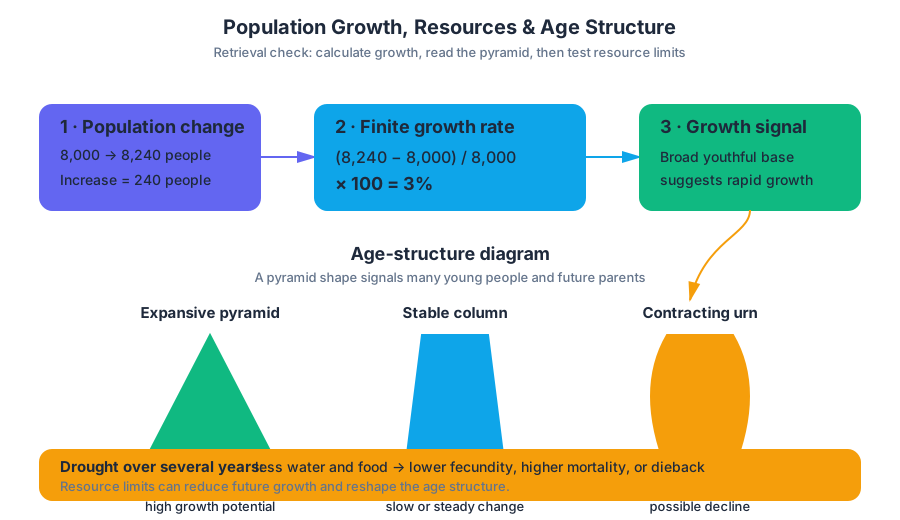
A town increases from $8{,}000$ to $8{,}240$ people in one year. Calculate its finite growth rate, then predict which age-structure shape would most strongly suggest continued rapid growth. Explain how a drought could alter both answers over several years. A complete response should calculate
$$ \frac{8{,}240-8{,}000}{8{,}000}\times 100 = 3% $$
and connect a broad youthful base with growth potential, while linking drought to reduced resource availability, lower fecundity, increased mortality, or dieback. This applies 5.C Data Analysis and 6.B Mathematical Routines.
Source Materials
- AP Environmental Science Course and Exam Description
- Review the Clarifications (.pdf)
- AP Environmental Science Course Overview
- AP Environmental Science Course at a Glance
- AP Environmental Science Course at a Glance Poster
- AP Environmental Science
- AP Environmental Science
- AP Environmental Science Sample Syllabus 1
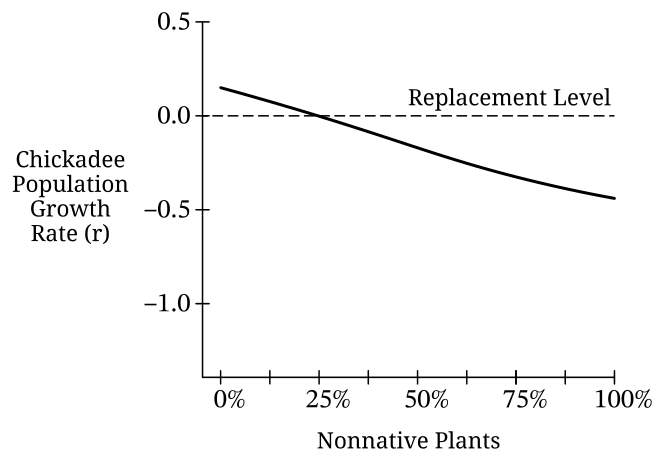
- Figure 2. Chickadee Population Average Growth Rate and Percentage of Nonnative