From the free course AP Environmental Science on Lykke
3.3 Survivorship Curves · 3.4 Carrying Capacity
Key concepts: Survivorship curves · Cohorts and cohort survival · The three main survivorship-curve shapes · Survival patterns across different life stages · K-selected and r-selected reproductive strategies · The relationship between reproductive strategy and survivorship-curve shape · Carrying capacity · Resource availability and sustainable population size · Habitat loss and reduced carrying capacity · Analyzing and explaining patterns and trends in survivorship data
A population can lose most of its members either early in life, steadily across life, or mainly near old age. A survivorship curve shows how the proportion of a birth group remains alive as the group ages; carrying capacity, in contrast, describes how many individuals an environment can sustain.
3.3 Survivorship Curves · 3.4 Carrying Capacity
A population can lose most of its members either early in life, steadily across life, or mainly near old age. A survivorship curve shows how the proportion of a birth group remains alive as the group ages; carrying capacity, in contrast, describes how many individuals an environment can sustain.
Cohorts: Following One Birth Group Through Time
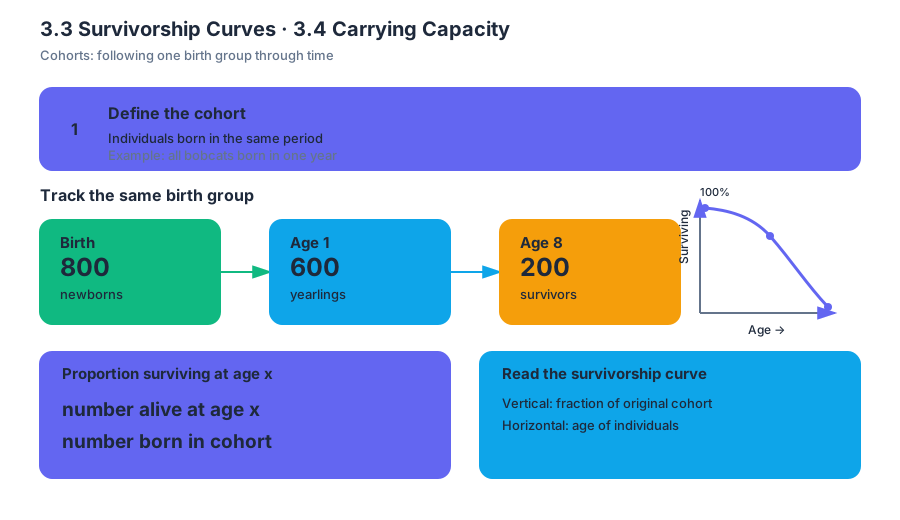
A cohort is a group of individuals born during the same period. Researchers can follow one cohort—such as all bobcats born in a particular year—and record how many survive at successive ages. If $800$ newborns become $600$ yearlings, then $75%$ of the original cohort survived to age one; if $200$ remain at age eight, the cohort survival is $25%$.
$$ \text{Proportion surviving at age }x
\frac{\text{number alive at age }x}{\text{number born in the cohort}} $$
The vertical axis of a survivorship graph therefore represents the fraction or percentage of the original cohort still alive, while the horizontal axis represents age. The curve is about age-specific survival, not the total number of organisms currently living in the ecosystem.
The Three Main Survivorship-Curve Shapes
| Curve type | Survival pattern | Typical interpretation |
|---|---|---|
| Type I | High survival through early and middle life, followed by a steep decline in old age | Most individuals live to an advanced age |
| Type II | A relatively constant probability of dying at any age | Juveniles, adults, and older individuals experience a similar death rate |
| Type III | Very high mortality early in life, followed by high survival among the few that remain | Many offspring die young, but survivors may live much longer |
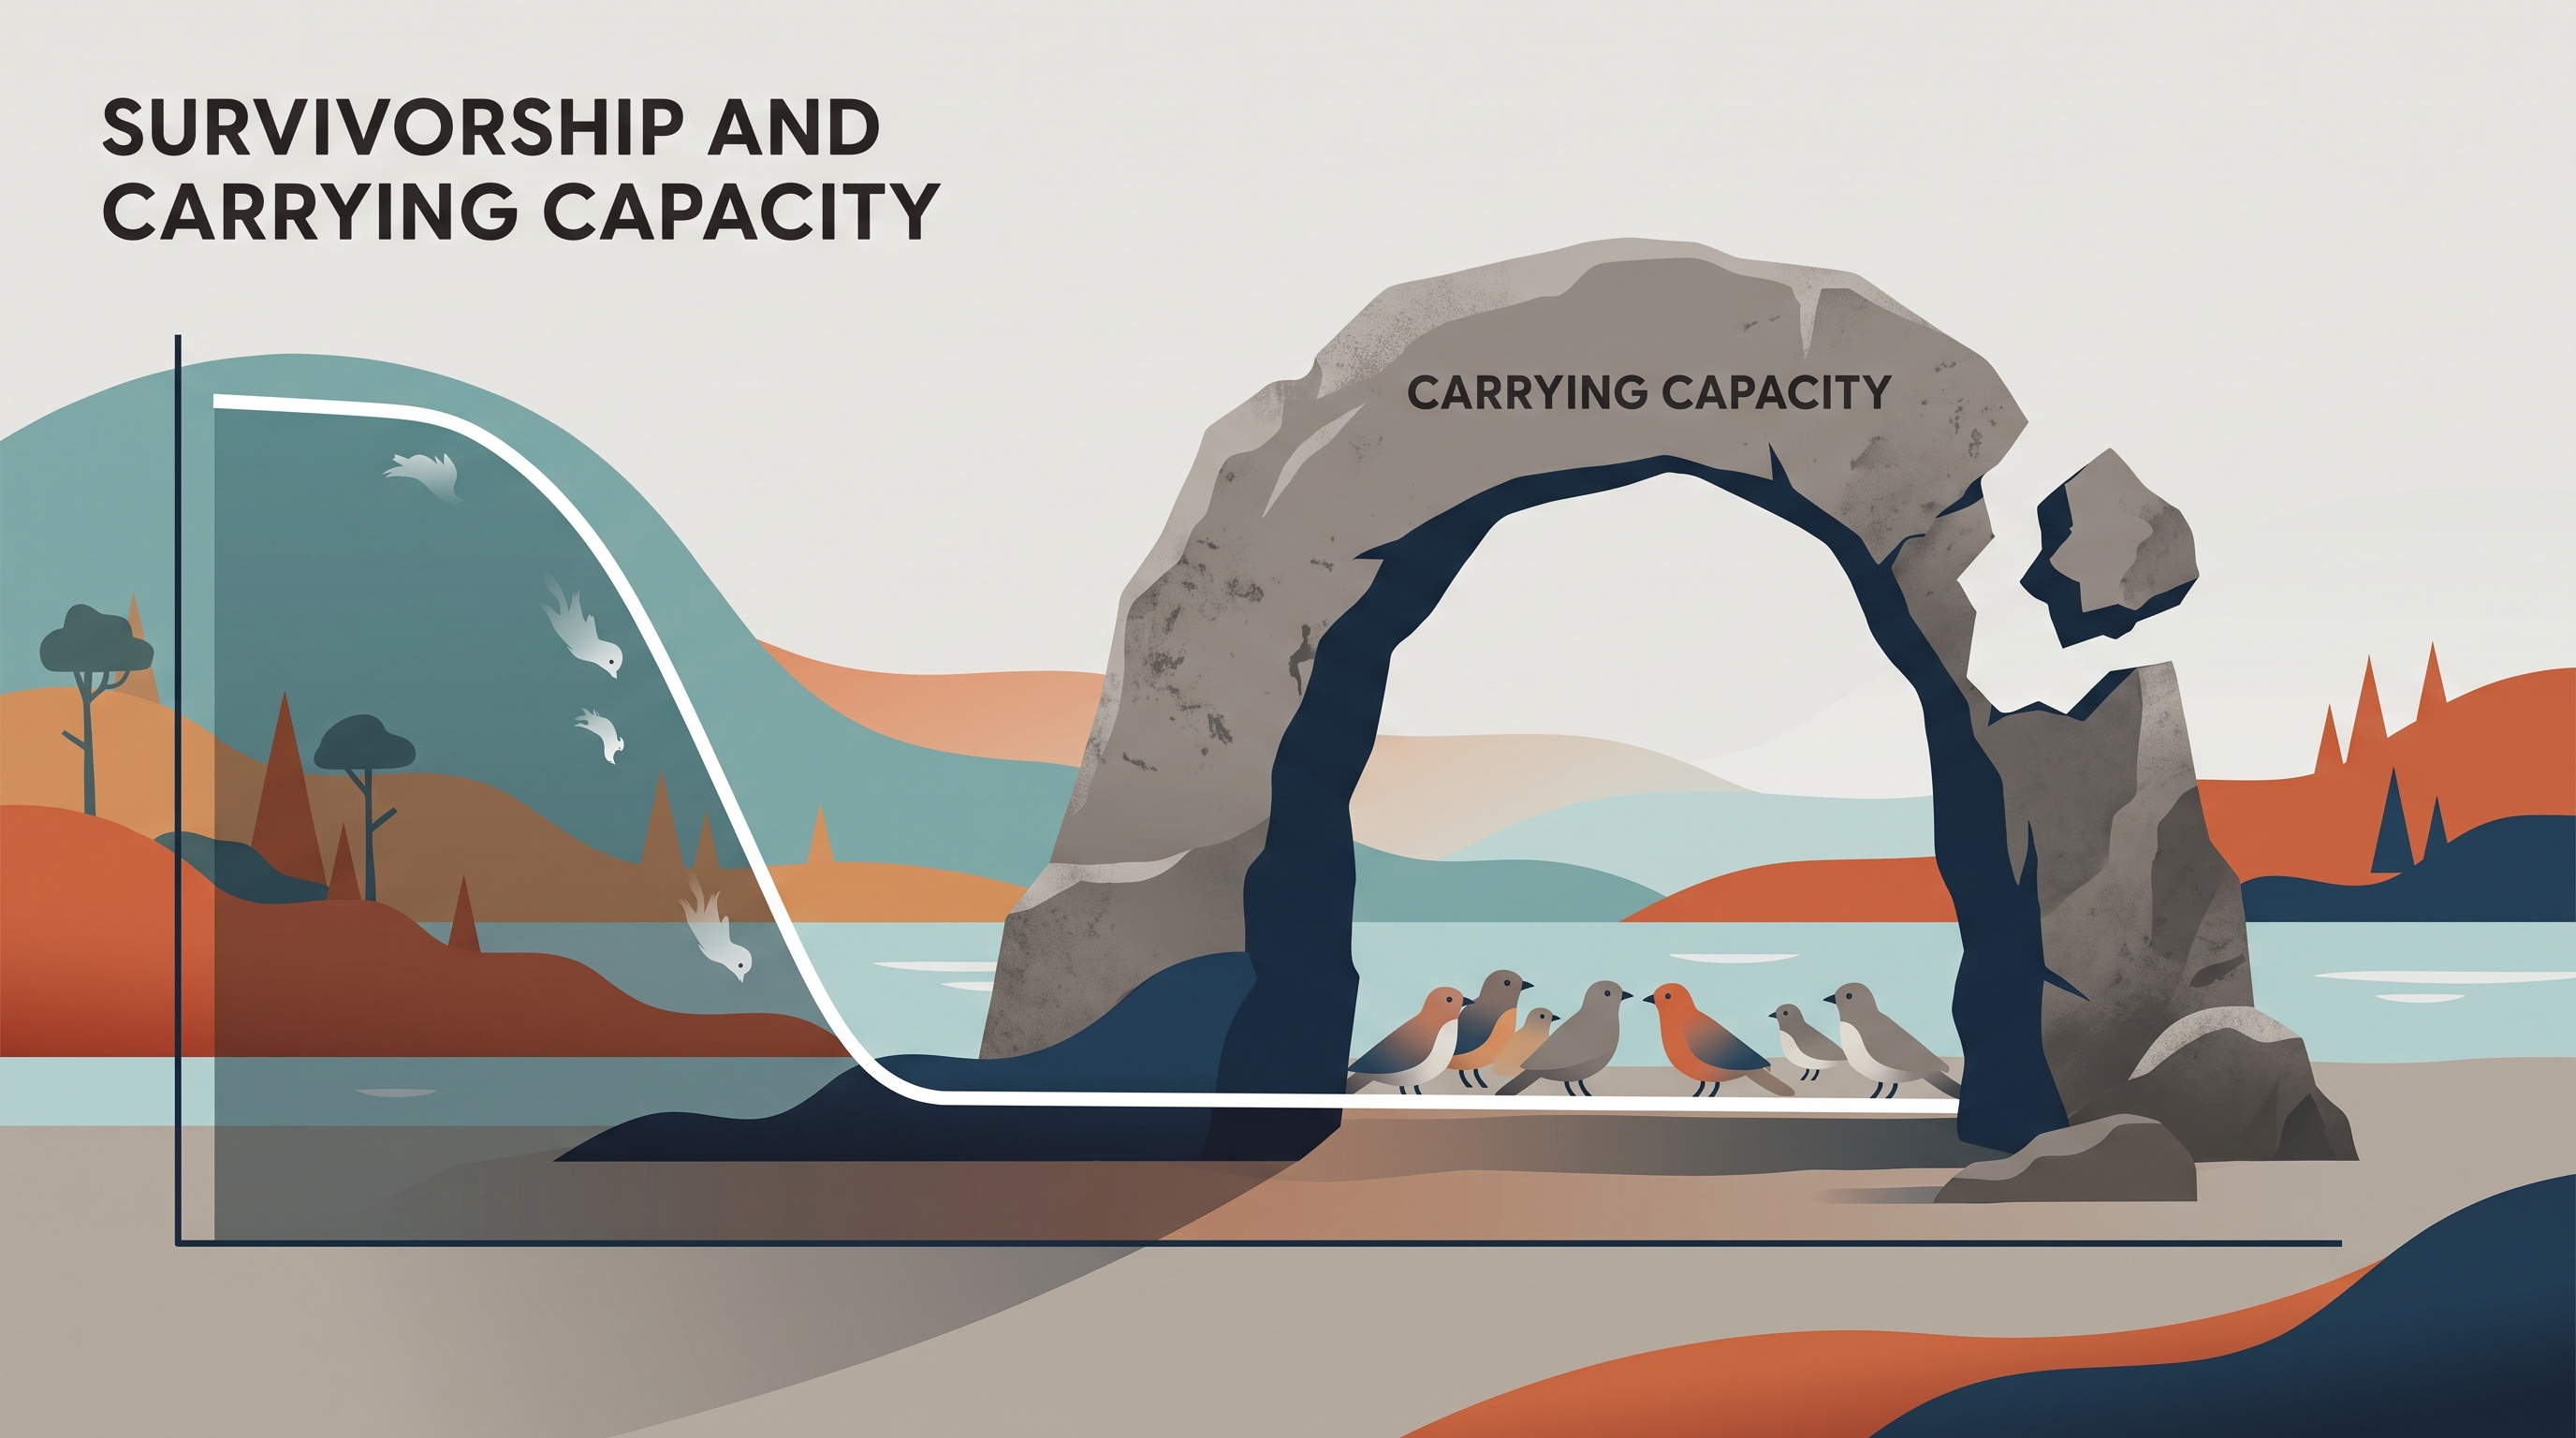
Imagine three different slopes. A Type I curve stays high and bends sharply downward near the end. A Type II curve descends at a fairly steady rate. A Type III curve drops sharply at the beginning and then levels out. These shapes summarize patterns across life stages rather than predicting the exact lifespan of every individual.
Misconception check — “Type III means the species is unhealthy.” Not necessarily. A species may produce thousands of offspring while only a small number survive to adulthood. High early mortality can be a normal life-history pattern, especially when offspring receive little protection or parental investment.
Reproductive Strategy and Survivorship Shape
The relationship with reproductive strategy is statistical, not absolute. K-selected reproductive patterns often align with Type I curves because relatively few offspring receive substantial investment and tend to have high survival after early life. r-selected patterns often align with Type III curves because many offspring are produced, but most do not survive early stages. Real populations can show exceptions, and a species should be classified from its observed survival data rather than from a label alone.
Reading Survivorship Data as Evidence
When interpreting a graph, first identify what each axis measures. Then describe the pattern with a direction and life stage: “survival decreases rapidly during the juvenile years and changes little afterward” is stronger than “the population is affected.” Finally, connect the pattern to a defensible ecological explanation, such as predation on young organisms, disease in older organisms, or protection of offspring.
Worked Example: A Coastal Turtle Cohort
A cohort begins with $1{,}000$ hatchlings. After one year, $120$ remain; after five years, $90$ remain; and after twenty years, $70$ remain. The largest loss occurs during the earliest life stage:
$$ \frac{120}{1{,}000}=0.12=12% $$
Only $12%$ survive to age one, but approximately $58%$ of the one-year survivors remain at age twenty:
$$ \frac{70}{120}\approx 0.58=58% $$
This pattern is consistent with a Type III curve: very high mortality occurs early, while individuals that reach later life stages have a much greater chance of surviving. An evidence-based conclusion would state both the trend and its support: the cohort shows Type III survivorship because survival falls sharply before age one but declines much more slowly afterward.
This is an application of Science Practice 5: Data Analysis, especially 5.E: Explain what the data implies or illustrates about environmental issues. On an exam, use values or visible graph features as evidence; do not merely name the curve.
Carrying Capacity Is a Different Population Measure
Carrying capacity, represented by $K$, is the maximum population size that an environment can sustain over time with its available resources. Food, water, space, shelter, and habitat quality all influence $K$. A survivorship curve can remain unchanged while the number of individuals an area supports changes, because the two concepts answer different questions:
- Survivorship curve: At what ages do individuals in a cohort survive or die?
- Carrying capacity: How many individuals can the environment support?
Worked Example: Bobcats and Habitat Loss
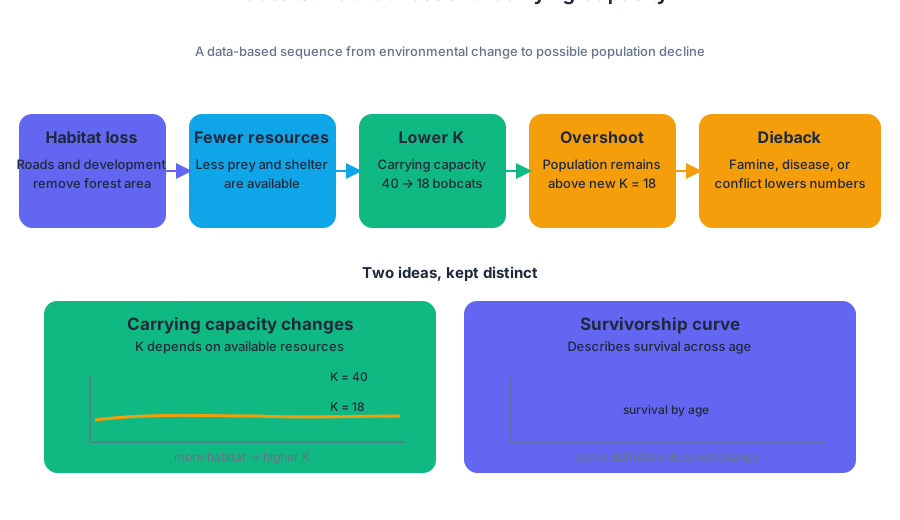
Suppose a forest supports $40$ bobcats when it contains abundant prey and shelter. If roads and development remove much of the forest, fewer resources remain. The area’s carrying capacity for bobcats decreases, perhaps from $K=40$ to $K=18$; the reduction is caused by habitat and resource loss, not by a change in the definition of a survivorship curve.
If the bobcat population remains above the new $K$, overshoot occurs. Resource depletion can then produce dieback, often through famine, disease, or conflict. A strong data-based explanation would connect the representations in sequence: reduced habitat $\rightarrow$ fewer resources $\rightarrow$ lower $K$ $\rightarrow$ possible overshoot and population decline.
Retrieval Check
A graph drops steeply during the first year and then becomes nearly flat. Identify the curve type, state what the graph says about survival at different life stages, and explain why removing habitat would affect carrying capacity even though the graph itself describes age-specific survival.
Source Materials
- AP Environmental Science Course and Exam Description
- Review the Clarifications (.pdf)
- AP Environmental Science Course Overview
- AP Environmental Science Course at a Glance
- AP Environmental Science Course at a Glance Poster
- AP Environmental Science
- AP Environmental Science
- AP Environmental Science Sample Syllabus 1
- 1. Population growing exponentially