From the free course AP Environmental Science on Lykke
1.7 The Hydrologic (Water) Cycle · 1.8 Primary Productivity
Key concepts: The hydrologic (water) cycle · Primary productivity · Gross primary productivity (GPP) · Photosynthesis · Net primary production (NPP) · Solar energy conversion · Energy flow in ecosystems · Productivity comparisons among common ecosystems · Productivity measured per unit area · Productivity measured as total energy
A forest can grow only where water arrives, remains available, and can be moved through living tissue; an ocean can contain abundant water yet support very different photosynthetic activity at different depths.
1.7 The Hydrologic (Water) Cycle · 1.8 Primary Productivity
A forest can grow only where water arrives, remains available, and can be moved through living tissue; an ocean can contain abundant water yet support very different photosynthetic activity at different depths. The hydrologic cycle describes the movement and distribution of water through Earth’s atmosphere, land, surface waters, groundwater, and organisms, while primary productivity measures how quickly photosynthesizers convert solar energy into stored chemical energy.
The hydrologic cycle: water in motion
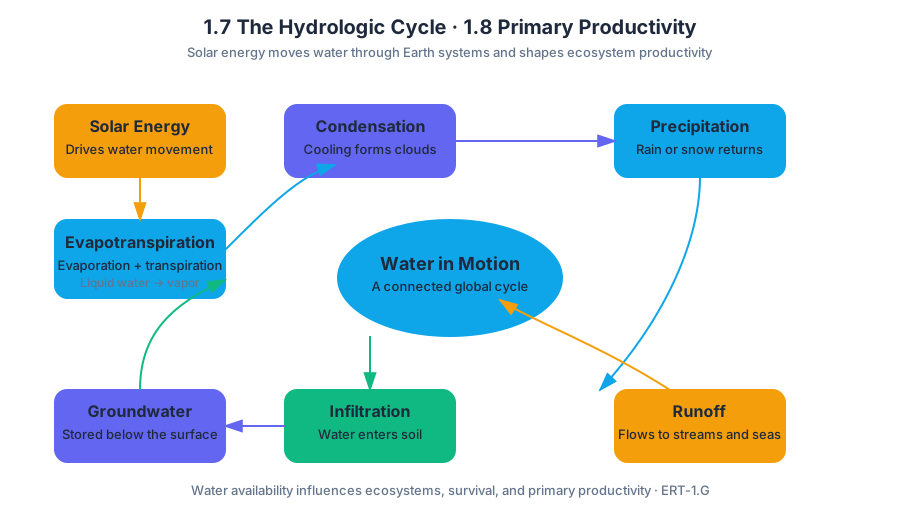
Water is a globally distributed natural resource, but it is not distributed evenly in usable forms. Solar energy drives evaporation, the conversion of liquid water to water vapor, from oceans, lakes, and soil. Plants add water vapor through transpiration, the release of water from leaves. Together, evaporation and transpiration are often called evapotranspiration.
As moist air rises and cools, water vapor undergoes condensation and forms clouds. Water then returns to Earth as precipitation, including rain or snow. Once it reaches the surface, some water enters soil through infiltration, some moves across the land as runoff, and some becomes groundwater that can later flow into streams, lakes, or oceans.
The cycle is not merely a list of processes: it connects Earth systems. For example, vegetation can slow runoff, increase infiltration, and return water to the atmosphere through transpiration. The global distribution of water therefore affects which ecosystems can exist, how productive they can be, and which organisms can survive there. This relationship is part of ERT-1.G, the Earth-systems reasoning associated with water availability and resource distribution.
Worked example: why two landscapes receive the same rain but retain different amounts
Suppose a forest and a paved urban area each receive $100\ \text{mm}$ of rainfall. Forest soil and plant roots allow a substantial portion to infiltrate, while leaves intercept some precipitation and release water gradually through transpiration. Pavement prevents infiltration, so a larger fraction becomes rapid runoff, potentially carrying pollutants into a stream and increasing flood risk.
Misconception check — “Rainfall equals water availability.” Not necessarily. Water availability depends on precipitation and storage, infiltration, runoff, evaporation, transpiration, groundwater access, and human use. A region may receive substantial precipitation but still experience seasonal water shortages if water leaves the system rapidly or demand exceeds supply.
Primary productivity: converting sunlight into biomass
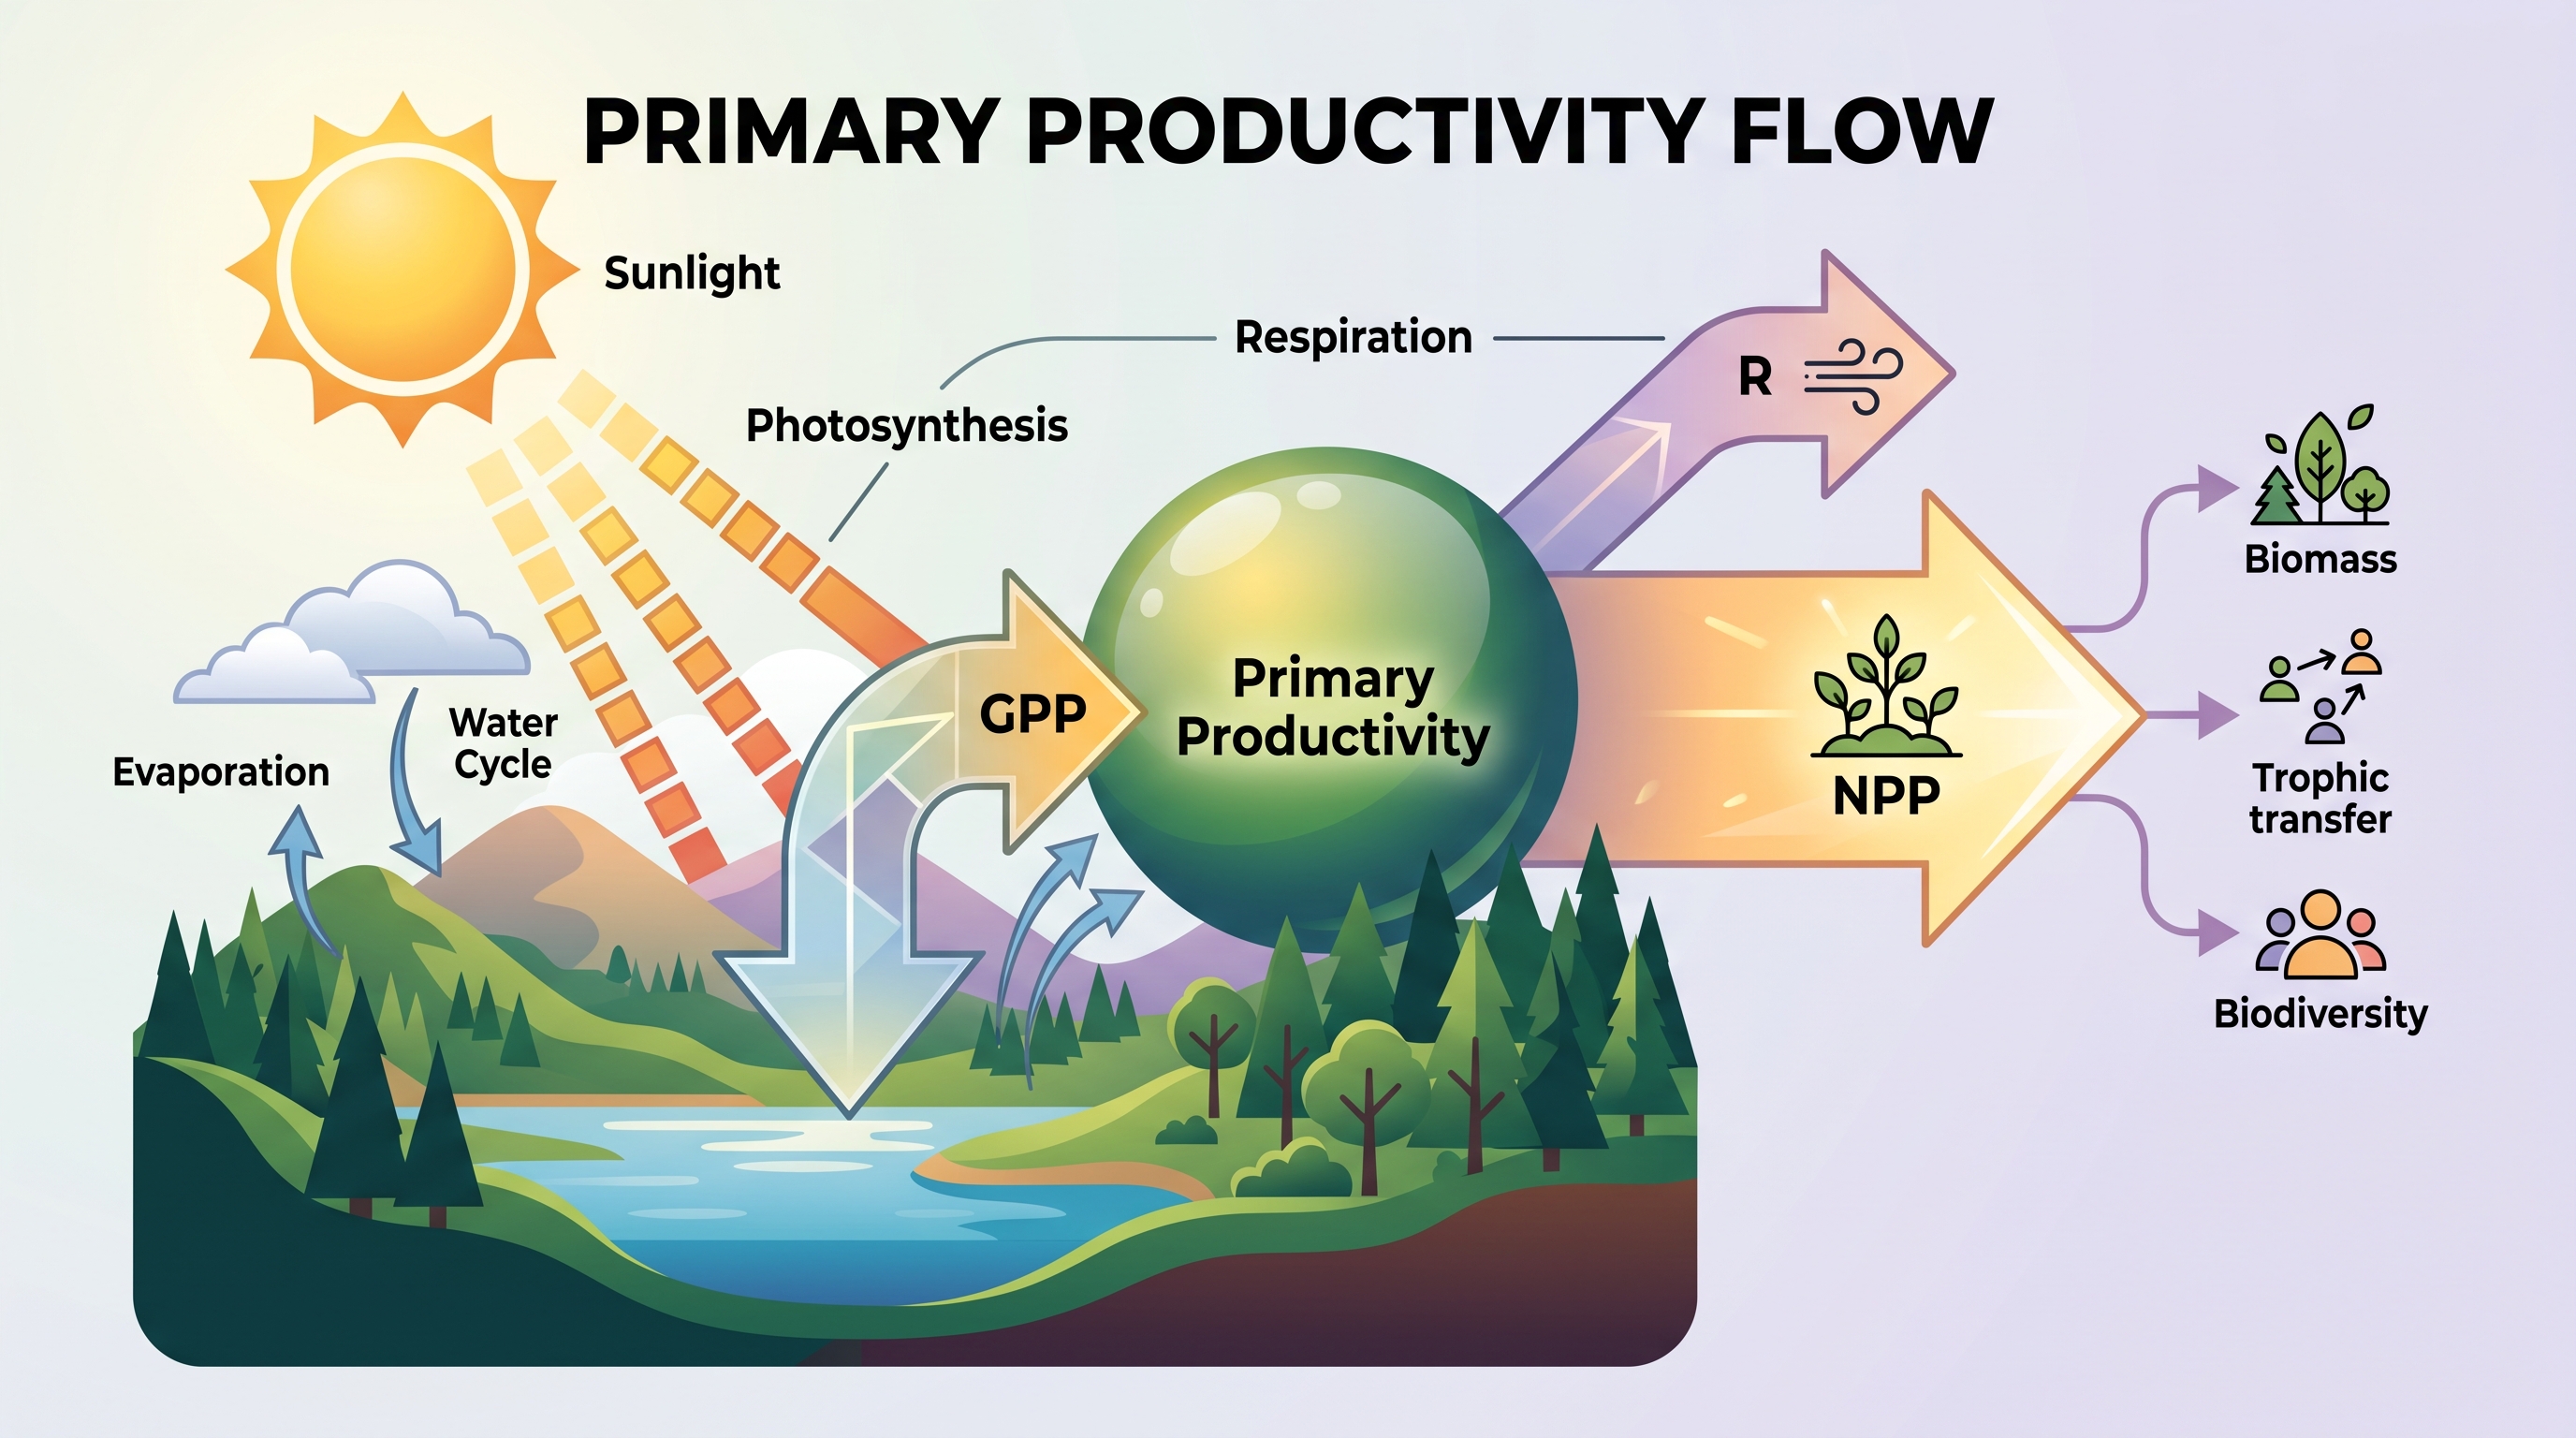
Primary productivity is the rate at which solar energy is converted into organic compounds through photosynthesis over a unit of time (ENG-1.A.1). During photosynthesis, producers use light energy to build energy-rich organic molecules from carbon dioxide and water:
$$ 6CO_2 + 6H_2O + \text{light energy} \rightarrow C_6H_{12}O_6 + 6O_2 $$
The total rate of photosynthesis in a given area is gross primary productivity (GPP) (ENG-1.A.2). Producers do not retain all of this captured energy: they use some for cellular respiration. The energy remaining after respiration is net primary productivity (NPP), the rate of energy storage by photosynthesizers (ENG-1.A.3):
$$ \text{NPP} = \text{GPP} - \text{respiration} $$
Productivity is commonly expressed as energy per unit area per unit time, such as $\text{kcal},\text{m}^{-2},\text{yr}^{-1}$ (ENG-1.A.4). It can also be expressed as total energy, such as total $\text{kcal}$ produced by an entire ecosystem. These are different measurements: one describes intensity per area, while the other describes the overall energy captured.
Per-unit-area productivity versus total productivity
Imagine two ecosystems:
| Ecosystem | Area | Productivity | Total energy captured |
|---|---|---|---|
| Coastal marsh | $10\ \text{km}^2$ | $1{,}000\ \text{kcal},\text{m}^{-2},\text{yr}^{-1}$ | Smaller total |
| Open ocean | Very large | $100\ \text{kcal},\text{m}^{-2},\text{yr}^{-1}$ | Larger total |
The marsh may be more productive per square meter, but the immense ocean can capture more energy in total. Misconception check — “The ecosystem with the highest productivity per unit area produces the most energy overall.” This confuses a rate density with a total. To compare total productivity, multiply productivity per unit area by ecosystem area, after converting all areas to compatible units.
Light limits aquatic productivity
Light availability changes with depth. Most red light is absorbed within the upper $1\ \text{m}$ of water, while blue light can penetrate deeper than $100\ \text{m}$ only in the clearest water (ENG-1.A.5). Aquatic photosynthesizers therefore adapt to limited visible light, and productivity generally declines below the well-lit surface zone.
A lake with clear water may support photosynthesis deeper than a muddy lake because suspended particles scatter and absorb light. However, nutrients, temperature, mixing, and the availability of carbon dioxide also influence productivity; light alone does not determine GPP or NPP.
AP skill and retrieval check
This topic is directly assessed through Science Practice 1.A, Concept Explanation: Describe environmental concepts and processes. A strong explanation links mechanism to outcome: sunlight powers photosynthesis, photosynthesis produces GPP, respiration reduces stored energy, and the remainder is NPP. Science Practice 2, Visual Representations, Science Practice 5, Data Analysis, and Science Practice 6, Mathematical Routines may require interpreting or calculating productivity from graphs.
Retrieval check: An ecosystem has a GPP of $2{,}400\ \text{kcal},\text{m}^{-2},\text{yr}^{-1}$ and producer respiration of $900\ \text{kcal},\text{m}^{-2},\text{yr}^{-1}$. Its NPP is:
$$ 2{,}400 - 900 = 1{,}500\ \text{kcal},\text{m}^{-2},\text{yr}^{-1} $$
If a second ecosystem has lower productivity per unit area but covers a much larger area, it may still have greater total productivity.
Source Materials
- AP Environmental Science Course and Exam Description
- Review the Clarifications (.pdf)
- AP Environmental Science Course Overview
- AP Environmental Science Course at a Glance
- AP Environmental Science Course at a Glance Poster
- AP Environmental Science
- AP Environmental Science
- AP Environmental Science Sample Syllabus 1
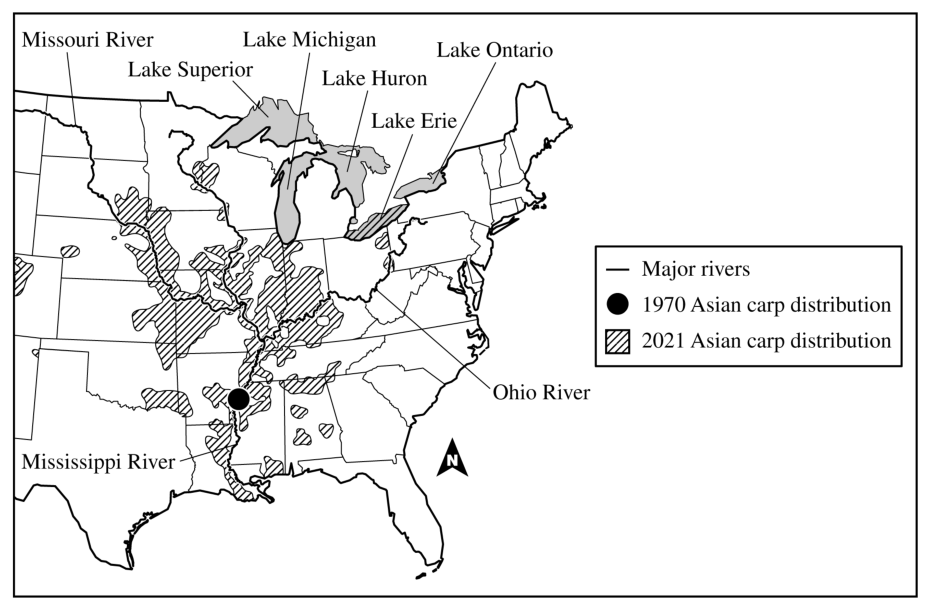
- (a) Based on the information given, identify a body of water invaded by Asian carp that is labeled on the map.
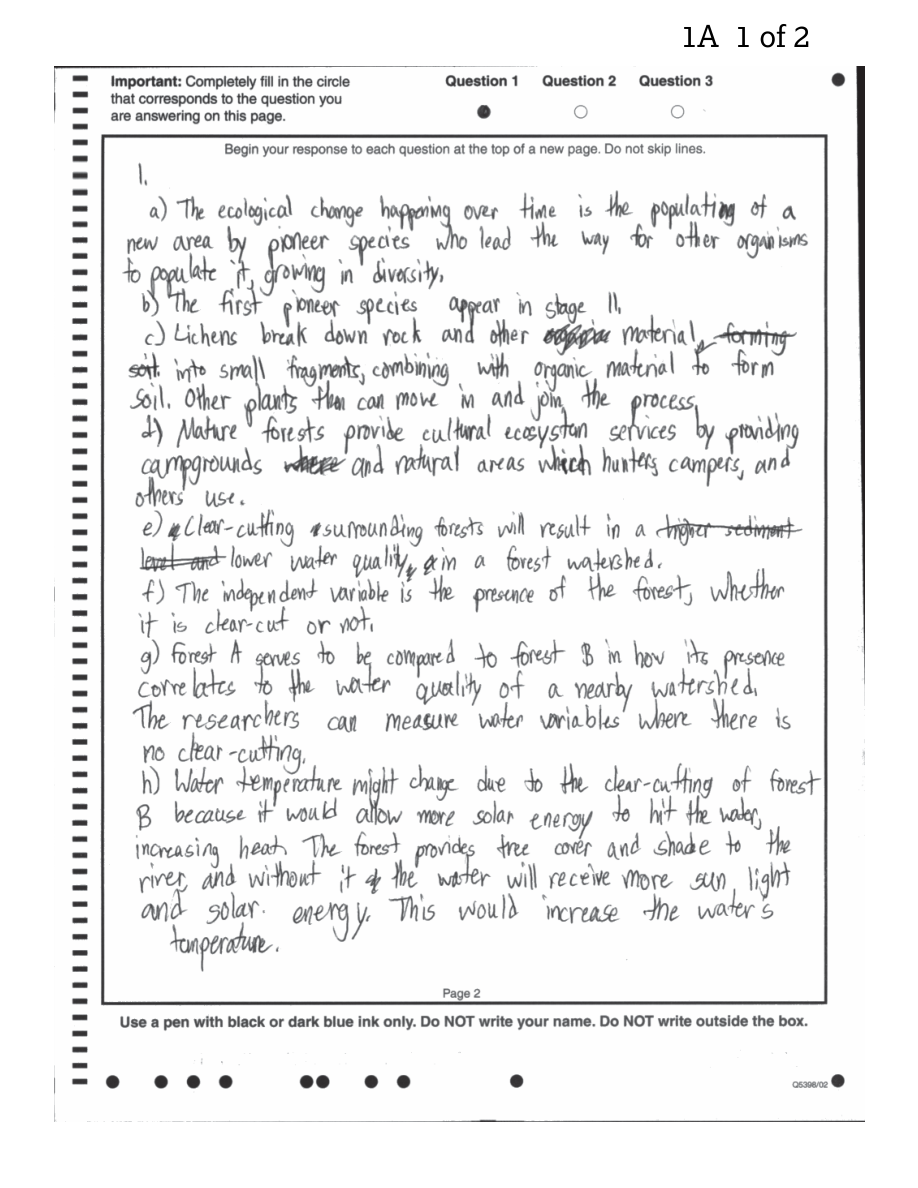
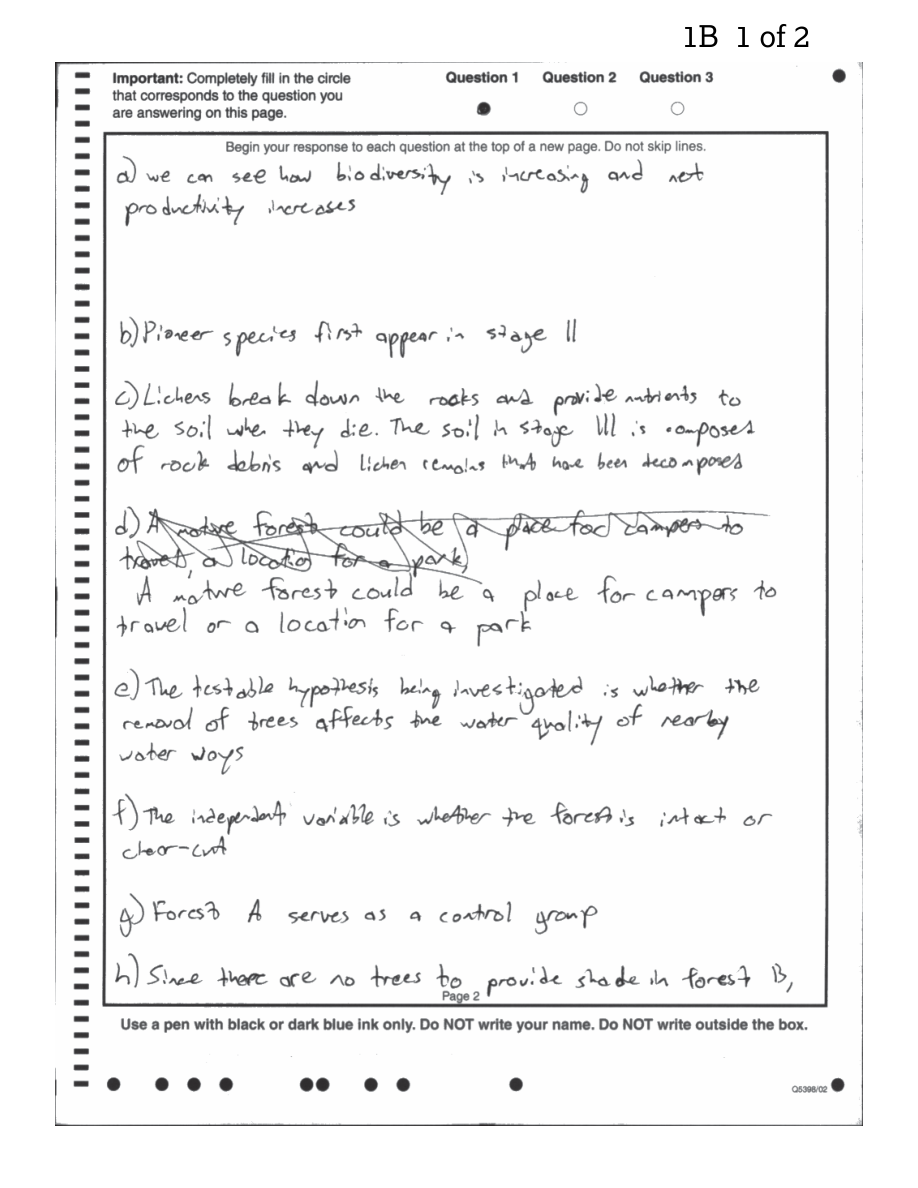
- Figure — Sample Responses Question 1 - Set 2 (p. 4)
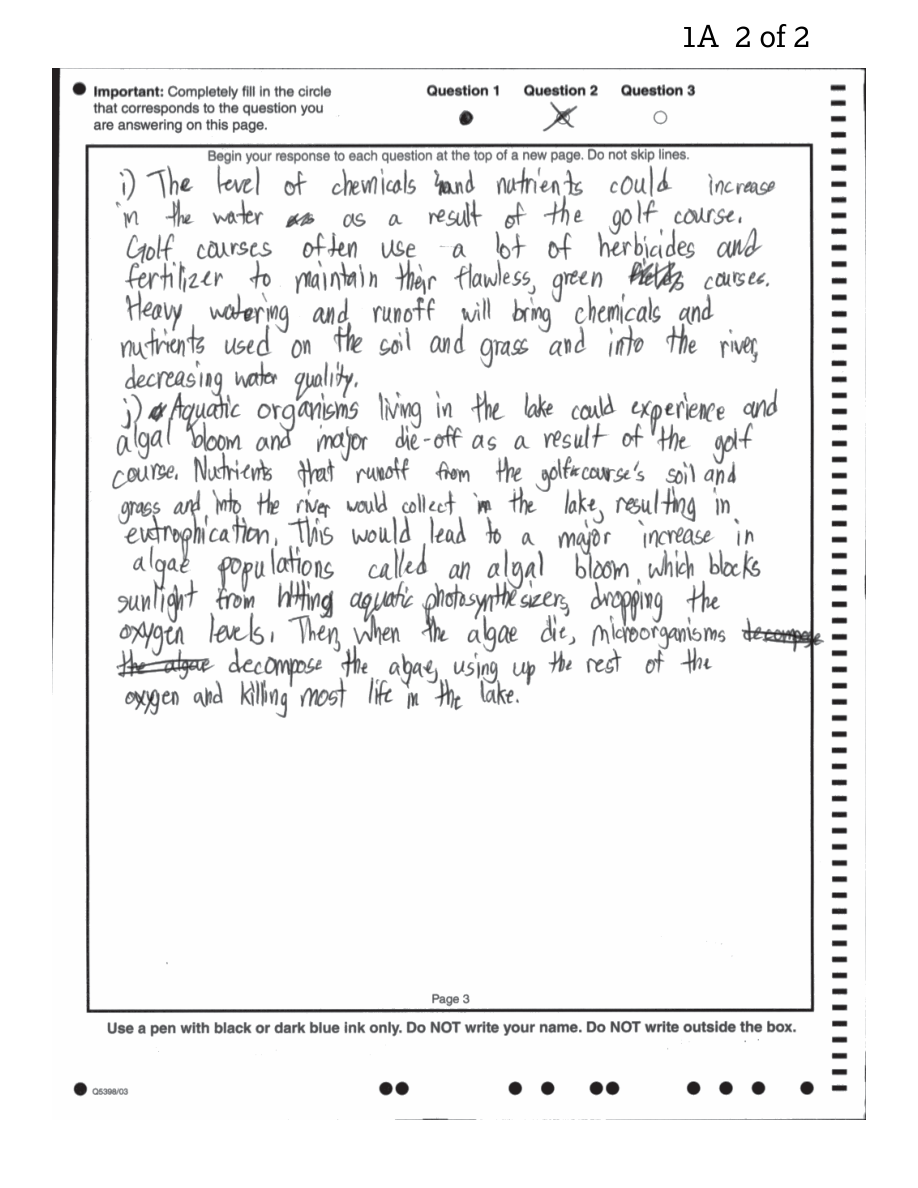
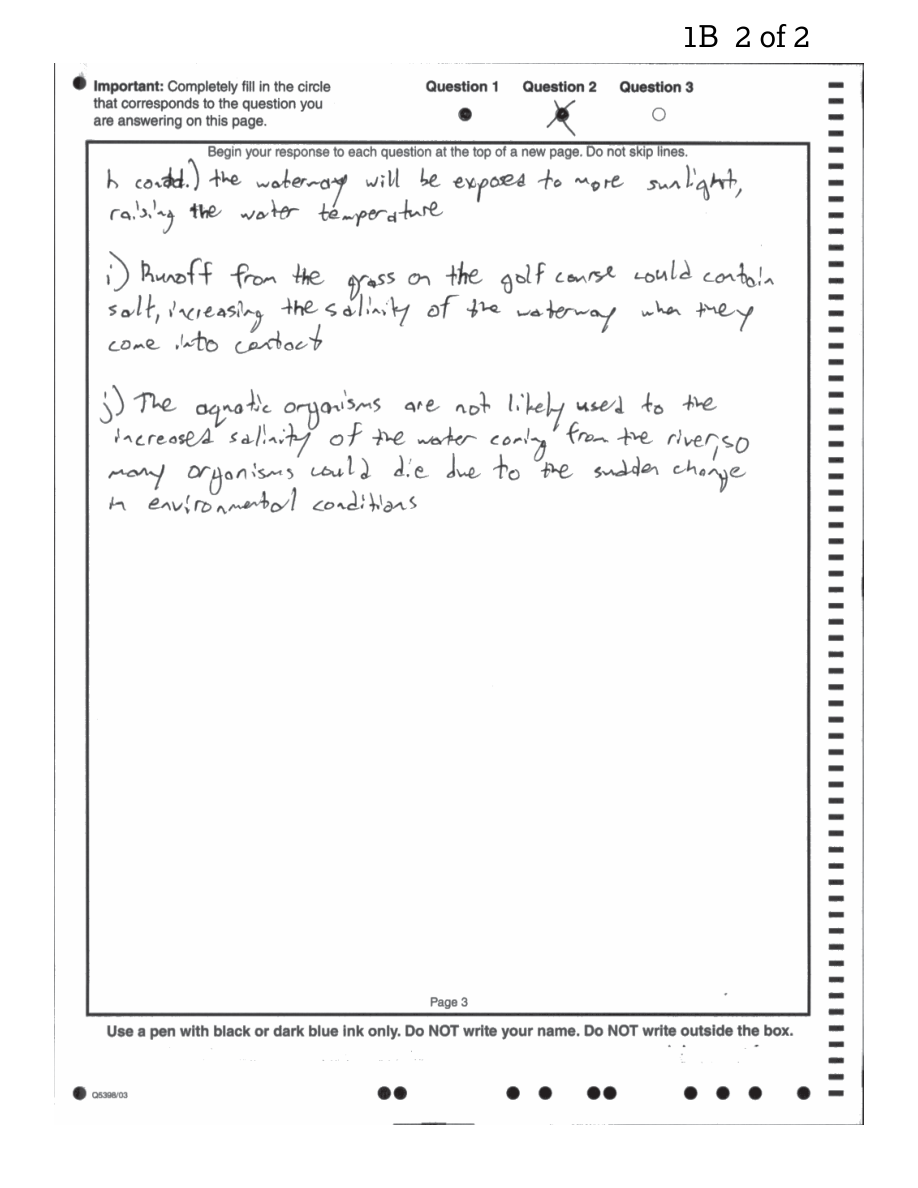
- Figure — Sample Responses Question 1 - Set 2 (p. 5)
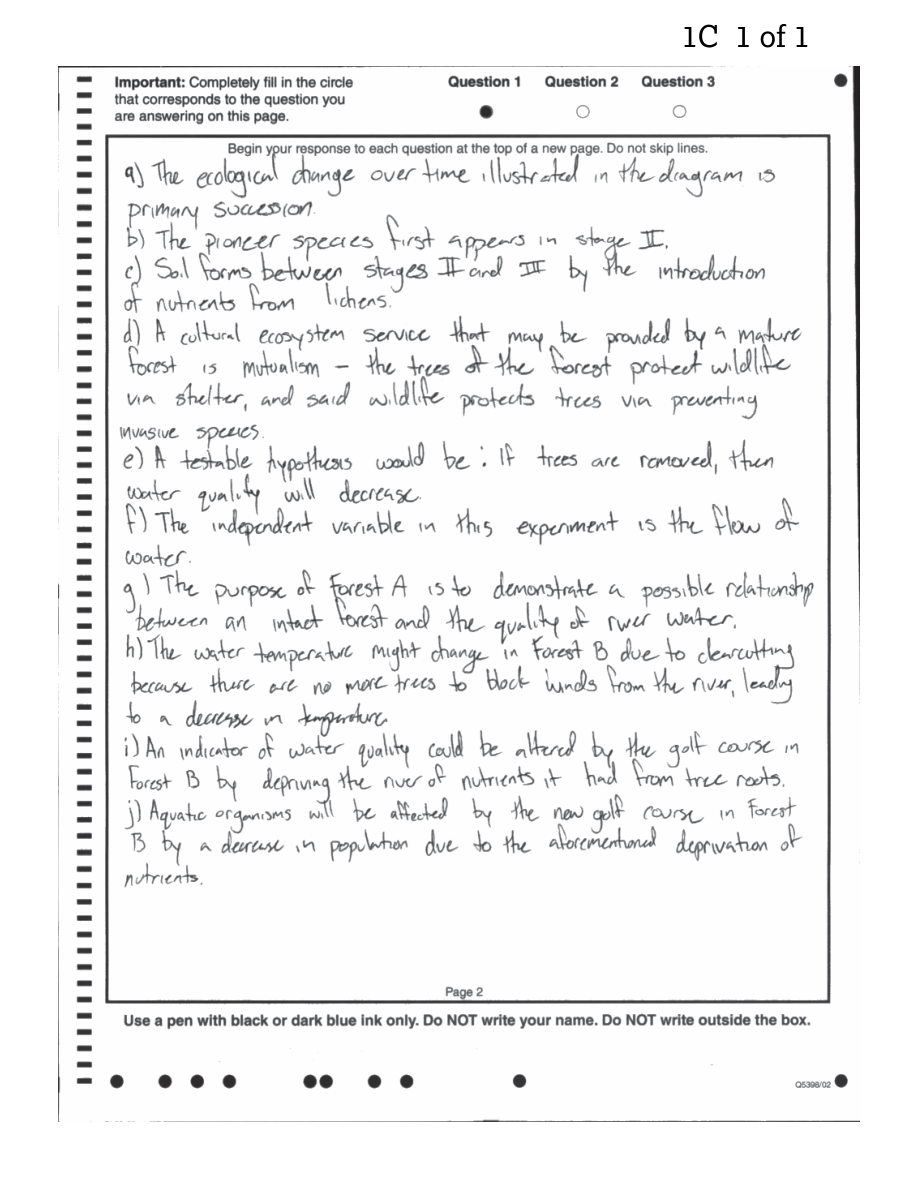
- Figure — Sample Responses Question 1 - Set 2 (p. 6)