From the free course AP Environmental Science on Lykke
3.9 Demographic Transition
The demographic transition is the long-term shift from high birth and death rates to low birth and death rates as a society industrializes and gains access to improved sanitation, medicine, education, and economic opportunities.
3.9 Demographic Transition
The demographic transition is the long-term shift from high birth and death rates to low birth and death rates as a society industrializes and gains access to improved sanitation, medicine, education, and economic opportunities.
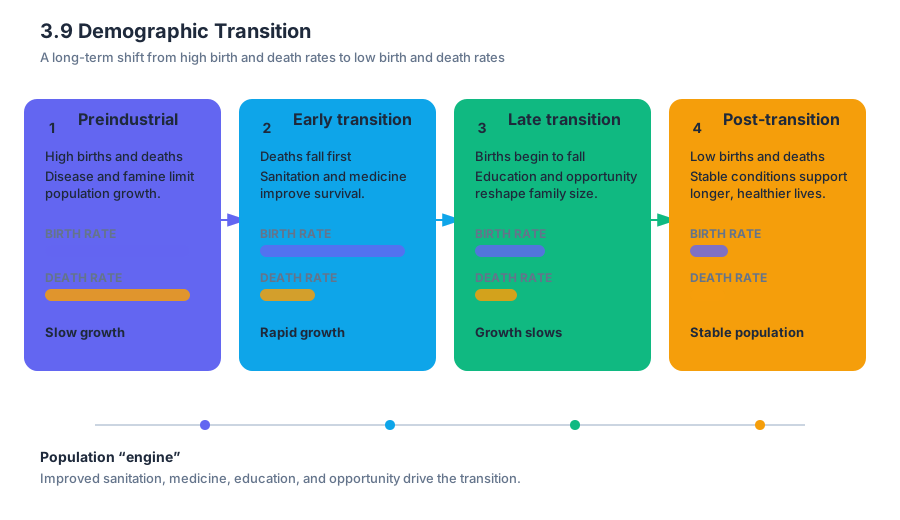
Imagine a country as a population “engine.” At first, the engine adds many people through high birth rates, but disease, famine, and poor sanitation remove many through high death rates. As living conditions improve, deaths decline before births do, producing rapid population growth; later, births also decline, and growth slows.
The four-stage model
The demographic transition model is a conceptual model, not a prediction that every country follows an identical path. It connects changes in crude birth rate (births per $1{,}000$ people per year), crude death rate (deaths per $1{,}000$ people per year), and natural increase rate (population change from births and deaths, excluding migration).
| Stage | Birth rate | Death rate | Population pattern | Typical conditions |
|---|---|---|---|---|
| 1. Preindustrial | High | High and variable | Slow growth or stability | Limited sanitation, frequent disease, high infant mortality |
| 2. Transitional | Remains high at first | Drops rapidly | Rapid growth | Improved food supply, sanitation, clean water, and medicine |
| 3. Industrial | Declines | Low | Growth slows | Urbanization, education, contraception, and increased cost of raising children |
| 4. Postindustrial | Low | Low | Stable or declining | High life expectancy, low fertility, and an older population |
In Stage 1, high mortality offsets high fertility. A population may remain nearly stable even when families have many children because many individuals die young. In Stage 2, mortality falls first, often because clean water, sewage treatment, vaccination, nutrition, and medical care improve; birth rates may remain high because cultural expectations and family decisions change more slowly.
During Stage 3, birth rates fall as families gain access to contraception and as women’s education, employment, and economic independence increase. Urban families may also choose fewer children because children are less economically necessary and housing, schooling, and health care are costly. In Stage 4, both rates are low, so a population can stabilize or decline if deaths exceed births.
Worked example: finding natural increase
Suppose a Stage 2 country records a crude birth rate of $35$ births per $1{,}000$ people and a crude death rate of $10$ deaths per $1{,}000$ people. Its natural increase is the difference between the two rates, but the denominator must remain $1{,}000$ because both original values are reported per $1{,}000$ people.
$$ \text{Natural increase rate}
\frac{35-10}{1{,}000}
\frac{25}{1{,}000}
0.025
2.5% $$
The population is therefore increasing naturally by $2.5%$ per year, before considering immigration or emigration. This is rapid growth: even if the birth rate later begins to decline, population momentum may continue because a large younger generation is entering reproductive age.
Key insight: In the demographic transition, death rates usually decline before birth rates. That gap is what creates the fastest population growth.
Applying the model to evidence
A graph showing a sharply declining death rate while the birth rate remains high indicates Stage 2, not Stage 3. A graph showing both rates low, with the birth rate below the death rate, suggests Stage 4 and possible natural decrease. Migration can alter total population size, but it does not change the natural increase rate itself.
Science Practice 1: Concept Application, Skill 1.C — Apply environmental concepts, processes, and models is the designated skill pairing for Topic 3.9 Demographic Transition. On an exam, applying this skill means using the model to interpret a graph, classify a country’s stage, predict a population trend, or connect a demographic change to environmental pressures such as resource demand, urban expansion, or waste production.
Misconception check
Misconception: “Every country must pass through the stages at the same speed.” The model describes a common pattern, but countries can move unevenly because of government policies, conflict, migration, access to health care, cultural practices, and economic conditions. A country may also have regions at different stages at the same time.
Misconception: “A low birth rate immediately means the population gets smaller.” Population size depends on both births and deaths, and population momentum can keep a population growing after fertility declines. A population begins natural decrease only when the death rate exceeds the birth rate; migration can then increase or decrease total population independently.
Retrieval check
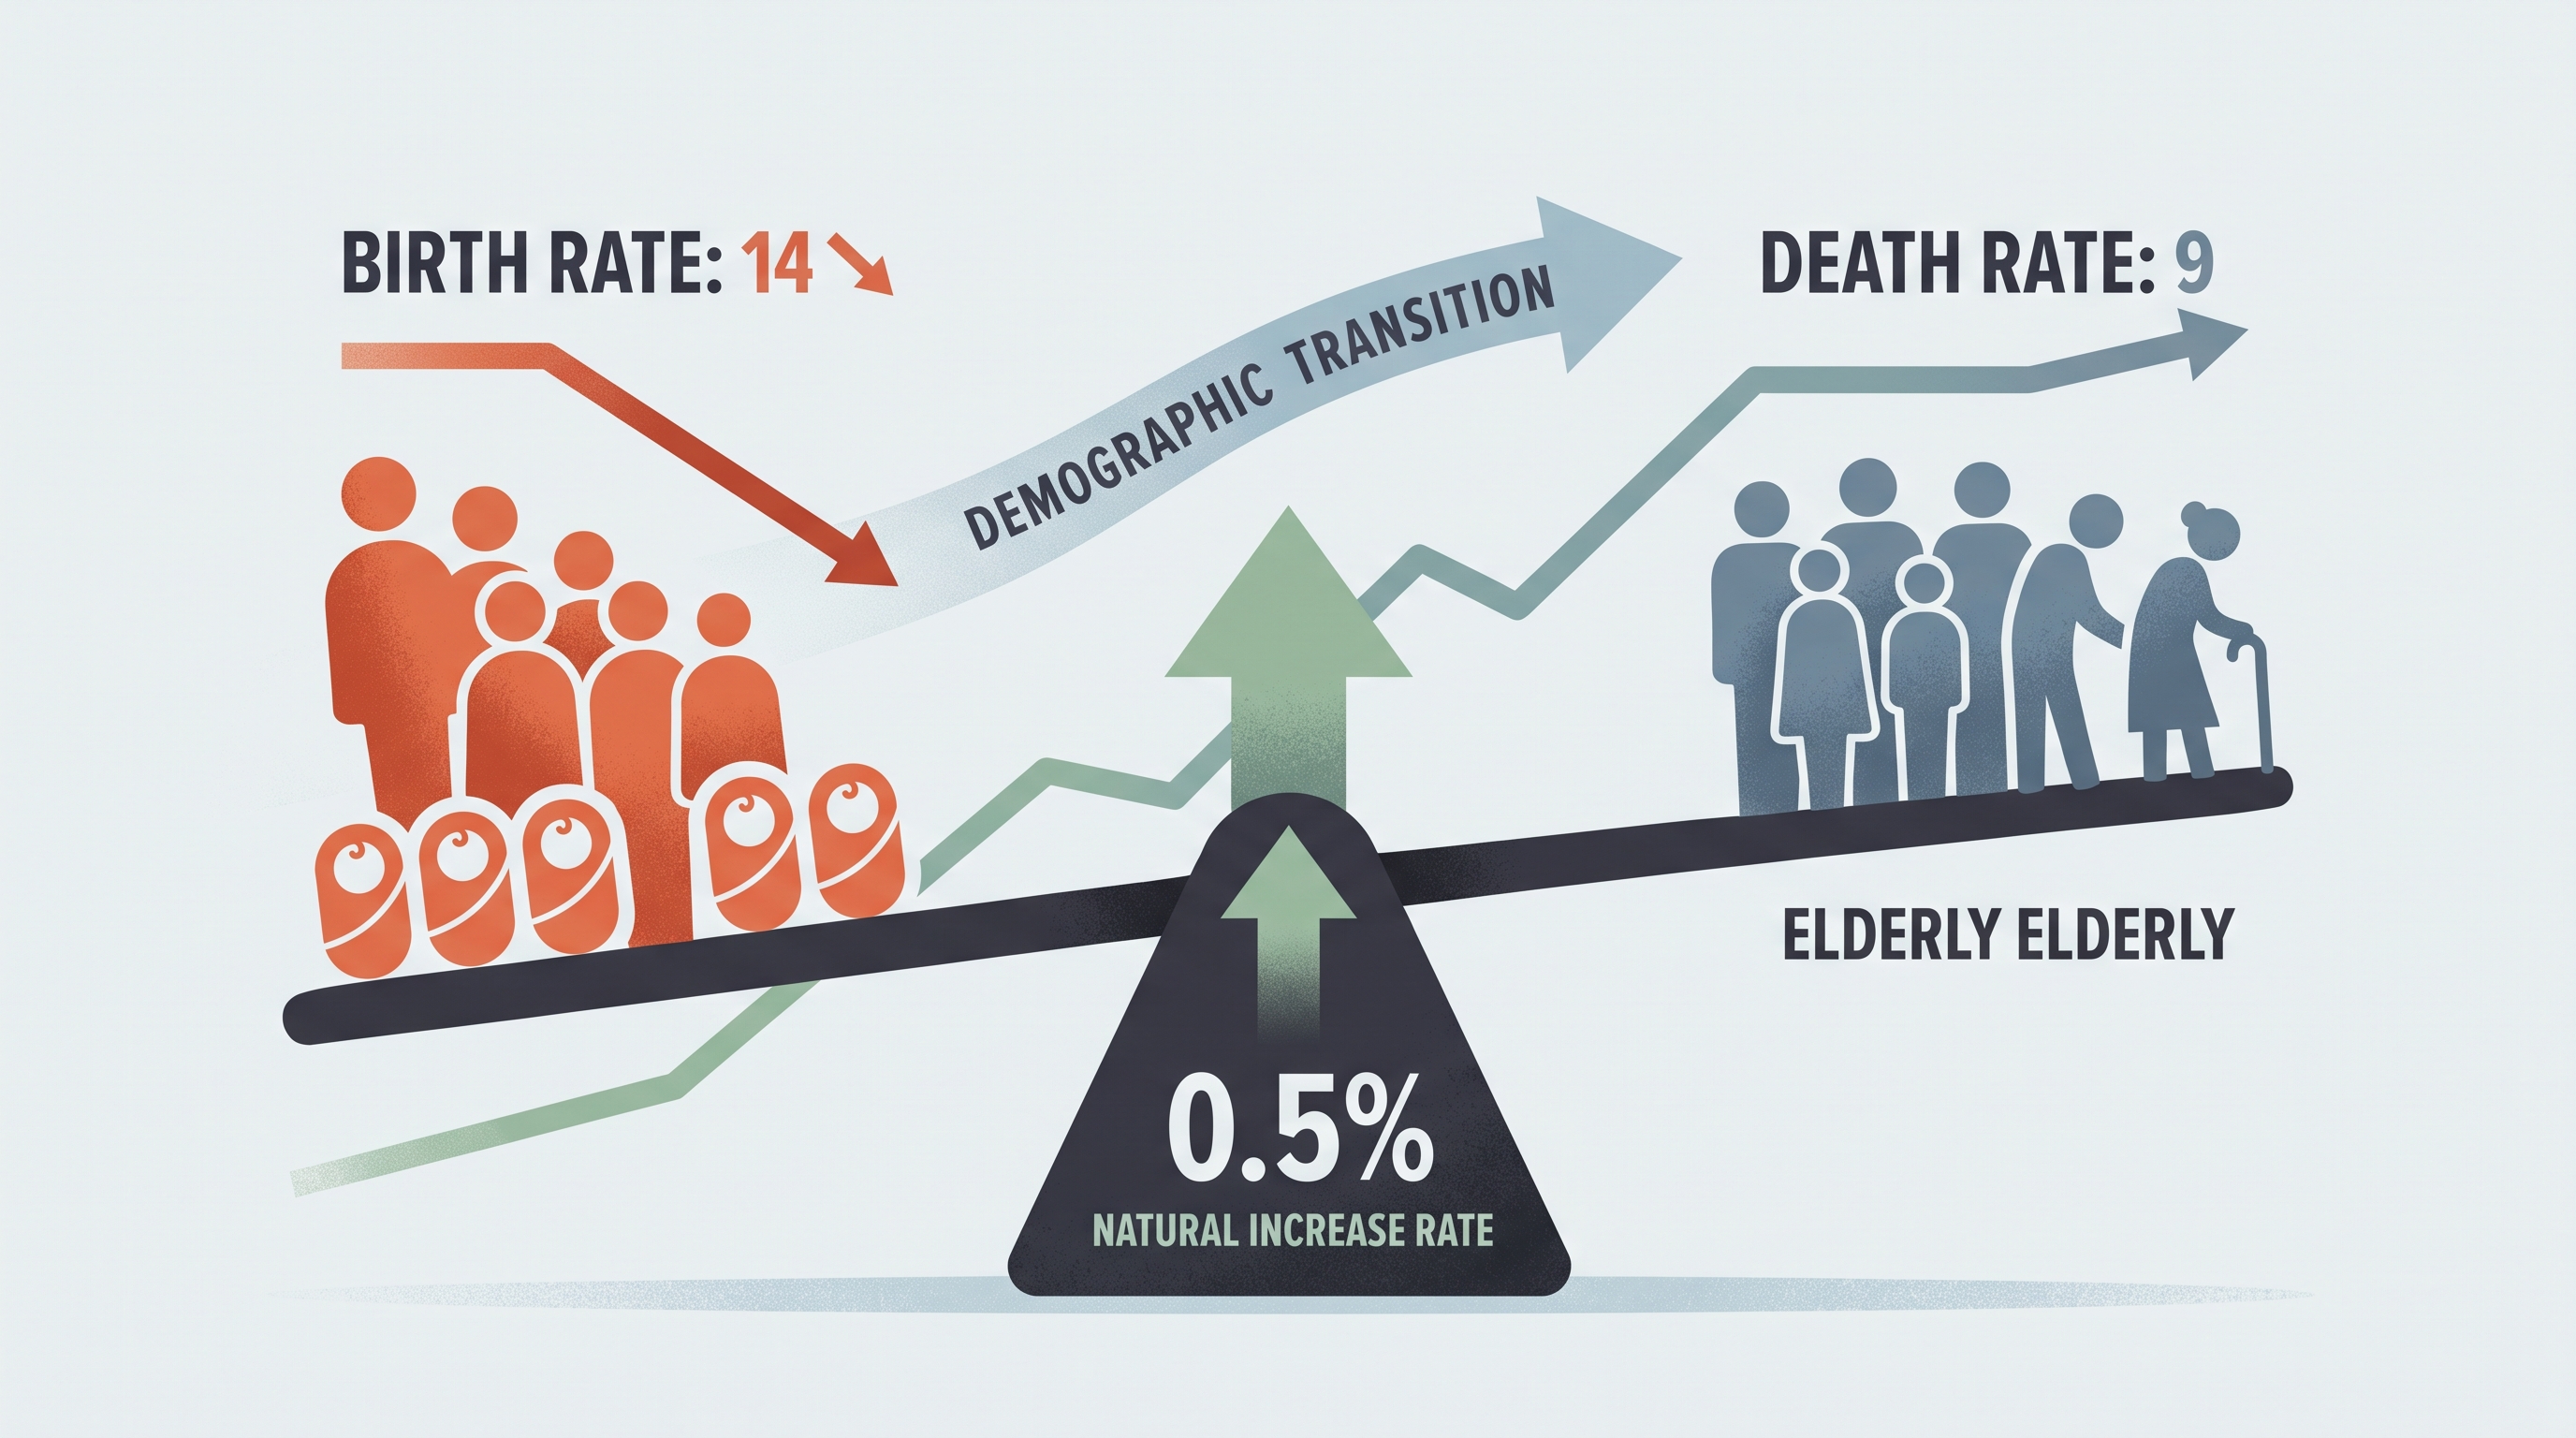
A country’s birth rate is $14$ per $1{,}000$ and its death rate is $9$ per $1{,}000$. Calculate its natural increase rate and identify the most likely demographic-transition pattern.
$$ \frac{14-9}{1{,}000}
\frac{5}{1{,}000}
0.005
0.5% $$
A positive rate of $0.5%$ indicates natural growth, but slower growth than the worked Stage 2 example. If both rates are relatively low, the country is most consistent with Stage 3, where mortality is already low and fertility has begun to decline.
Source Materials
- AP Environmental Science Course and Exam Description
- Review the Clarifications (.pdf)
- AP Environmental Science Course Overview
- AP Environmental Science Course at a Glance
- AP Environmental Science Course at a Glance Poster
- AP Environmental Science
- AP Environmental Science
- AP Environmental Science Sample Syllabus 1