From the free course AP Environmental Science on Lykke
AP Practice 2
Key concepts: Biogeochemical cycles · Energy acquisition and transfer into usable forms · Human impacts on Earth-system cycles · Environmental science terminology · Patterns and trends in environmental data · Ecological services and ecological functions · Biodiversity and genetic diversity · Reproductive strategies of species · Invasive and endangered species · Evaluating environmental solutions and legislation
A wetland can be both a living machine and a public health safeguard: its plants capture energy, its soils store nutrients, and its standing water can either support biodiversity or create mosquito-breeding habitat when drainage and water movement are disrupted.
AP Practice 2
A wetland can be both a living machine and a public health safeguard: its plants capture energy, its soils store nutrients, and its standing water can either support biodiversity or create mosquito-breeding habitat when drainage and water movement are disrupted. A strong environmental analysis follows those connections through the system rather than treating each problem as an isolated fact.
Task type: Analyze an Environmental Problem and Propose a Solution
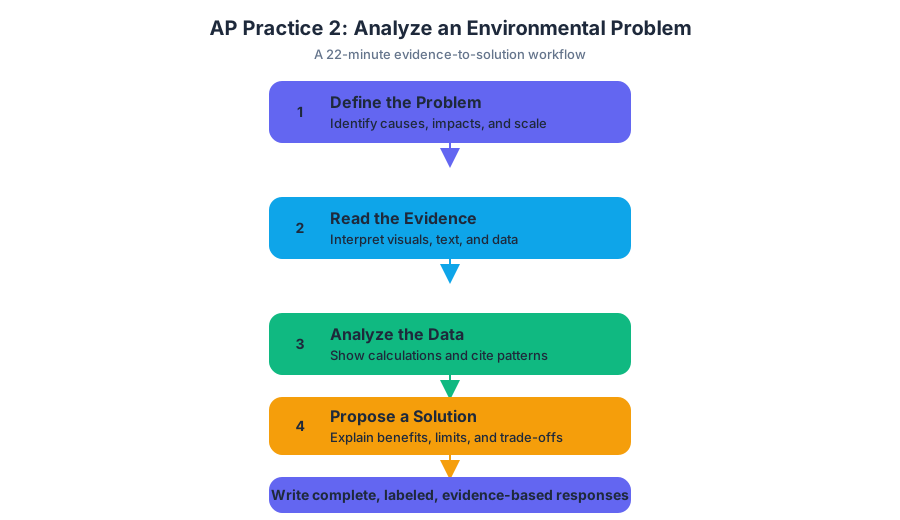
This original, unofficial practice task emphasizes Science Practice 1: Concept Explanation, Science Practice 2: Visual Representations, Science Practice 3: Text Analysis, Science Practice 5: Data Analysis, and Science Practice 7: Environmental Solutions. Allow about $22$ minutes, matching the approximate pacing for one of the three free-response questions. Write in complete sentences, label every part, show calculation work, and connect each claim to evidence.
Scenario and data
A coastal city replaces portions of a tidal wetland with roads and buildings. The remaining wetland becomes fragmented into smaller patches. Researchers measure air pollution, mosquito abundance, plant diversity, and mosquito-borne disease cases before and after development.
| Year | Wetland area ($ha$) | Average fine particulate concentration ($\mu g,m^{-3}$) | Plant species richness | Mosquitoes per trap | Disease cases |
|---|---|---|---|---|---|
| 1 | $820$ | $12$ | $34$ | $18$ | $6$ |
| 3 | $690$ | $16$ | $29$ | $31$ | $11$ |
| 5 | $510$ | $23$ | $21$ | $47$ | $19$ |
| 7 | $390$ | $28$ | $17$ | $63$ | $27$ |
(a) Identify the relationship between wetland area and mosquito abundance.
(b) Calculate the percent decrease in wetland area from Year $1$ to Year $7$.
(c) Describe one trend in the air-pollution data and identify one limitation that prevents the data from proving that wetland loss caused the trend.
(d) Explain how wetland loss and fragmentation could reduce both biodiversity and genetic diversity.
(e) Distinguish between an ecological function and an ecological service, giving one example of each for a wetland.
(f) Explain how energy enters and moves through the wetland ecosystem.
(g) Compare why an invasive mosquito species is more likely to spread successfully than an endangered wetland bird.
(h) Propose one solution that would reduce mosquito-borne disease while preserving wetland functions.
(i) Describe how legislation could develop to mitigate one environmental problem shown in the scenario.
Worked reasoning
(a) Relationship. Mosquito abundance increases as wetland area decreases: the two variables show a negative relationship. This is a description of an observed pattern, not automatically proof of causation.
(b) Calculation. Use
$$ \text{percent decrease}=\frac{\text{initial value}-\text{final value}}{\text{initial value}}\times 100 $$
$$ \text{percent decrease}=\frac{820-390}{820}\times 100 =\frac{430}{820}\times 100\approx 52.4% $$
The wetland area decreased by approximately $52.4%$. A response that gives only the number, without showing the setup when work is requested, is less defensible.
(c) Trend and limitation. Fine particulate concentration rises from $12$ to $28\ \mu g,m^{-3}$, an increase of $16\ \mu g,m^{-3}$. However, the study does not establish causation because vehicle traffic, construction activity, wind direction, or regional pollution could also have changed during the seven-year period. A controlled comparison with a similar undeveloped wetland would strengthen the inference.
(d) Biodiversity connection. Wetland loss removes habitat, so fewer species can survive; fragmentation further isolates populations and reduces movement between patches. Small isolated populations are more vulnerable to inbreeding, genetic drift, and random loss of alleles. Therefore, genetic diversity can decline even before a species disappears entirely. Reduced genetic variation leaves populations with fewer traits that might help them adapt to disease, temperature change, or altered water quality.
(e) Key distinction. An ecological function is a process performed by an ecosystem, such as wetland plants slowing water flow or microorganisms decomposing organic matter. An ecological service is a benefit people receive from that function, such as reduced flooding, water filtration, recreation, or disease-risk reduction. The function is the ecological process; the service is the human-relevant benefit. Confusing the two is a common vocabulary error.
(f) Energy flow. Producers capture light energy through photosynthesis and store it as chemical energy in organic molecules. Herbivores acquire some of that energy by feeding on plants, predators acquire some through feeding relationships, and organisms use cellular respiration to convert chemical energy into usable cellular energy. Energy transfer is not perfectly efficient: much is released as heat at each trophic transfer, while matter such as carbon and nitrogen cycles through the ecosystem.
(g) Reproductive strategies. An invasive mosquito is likely to spread because it may reproduce rapidly, mature early, produce many offspring, and tolerate a broad range of conditions. An endangered wetland bird is more likely to have a slower, $K$-selected strategy: fewer offspring, delayed maturity, and substantial parental investment. Those traits can support competitive individuals but make population recovery slow after habitat loss.
(h) Solution. The city could restore connected wetland patches while removing isolated pools that hold stagnant water near homes, using targeted biological or physical mosquito control rather than broad-spectrum pesticide application. This approach addresses disease risk while preserving filtration, flood reduction, habitat, and energy-flow functions. Monitoring should compare mosquito abundance, disease cases, native species richness, and water quality before and after implementation.
(i) Legislation pathway. A government could first require monitoring that documents wetland loss, pollution, and disease risk. Scientists and residents could then present the evidence during a rulemaking process; lawmakers or agencies could establish wetland-protection zones, development permits, runoff standards, and restoration requirements. The policy should include enforcement, funding, and periodic evaluation so that new data can reveal whether the intervention works.
Misconception check
A rising mosquito count does not by itself prove that mosquitoes caused the disease increase, just as declining wetland area does not by itself prove that every biodiversity change came from development. Strong responses identify a trend, cite the relevant variables, acknowledge alternative explanations, and propose a testable solution.
Error-review routine
After completing the task, mark each response as trend, calculation, mechanism, definition, evidence limitation, or solution. For every missed point, rewrite the answer using the pattern: claim → evidence or mechanism → environmental consequence. Ask whether you distinguished function from service, explained genetic diversity rather than only species richness, and traced energy from sunlight to chemical energy to cellular use.

Source Materials
- AP Environmental Science Course and Exam Description
- Review the Clarifications (.pdf)
- AP Environmental Science Course Overview
- AP Environmental Science Course at a Glance
- AP Environmental Science Course at a Glance Poster
- AP Environmental Science
- AP Environmental Science
- AP Environmental Science Sample Syllabus 1
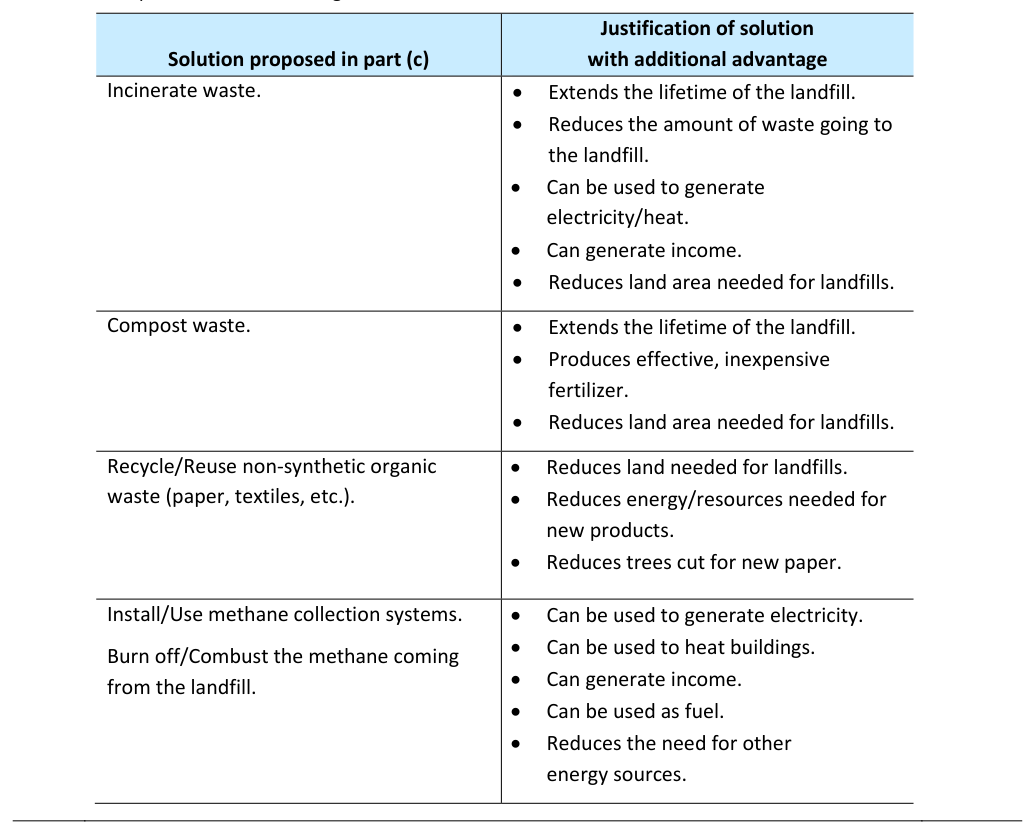
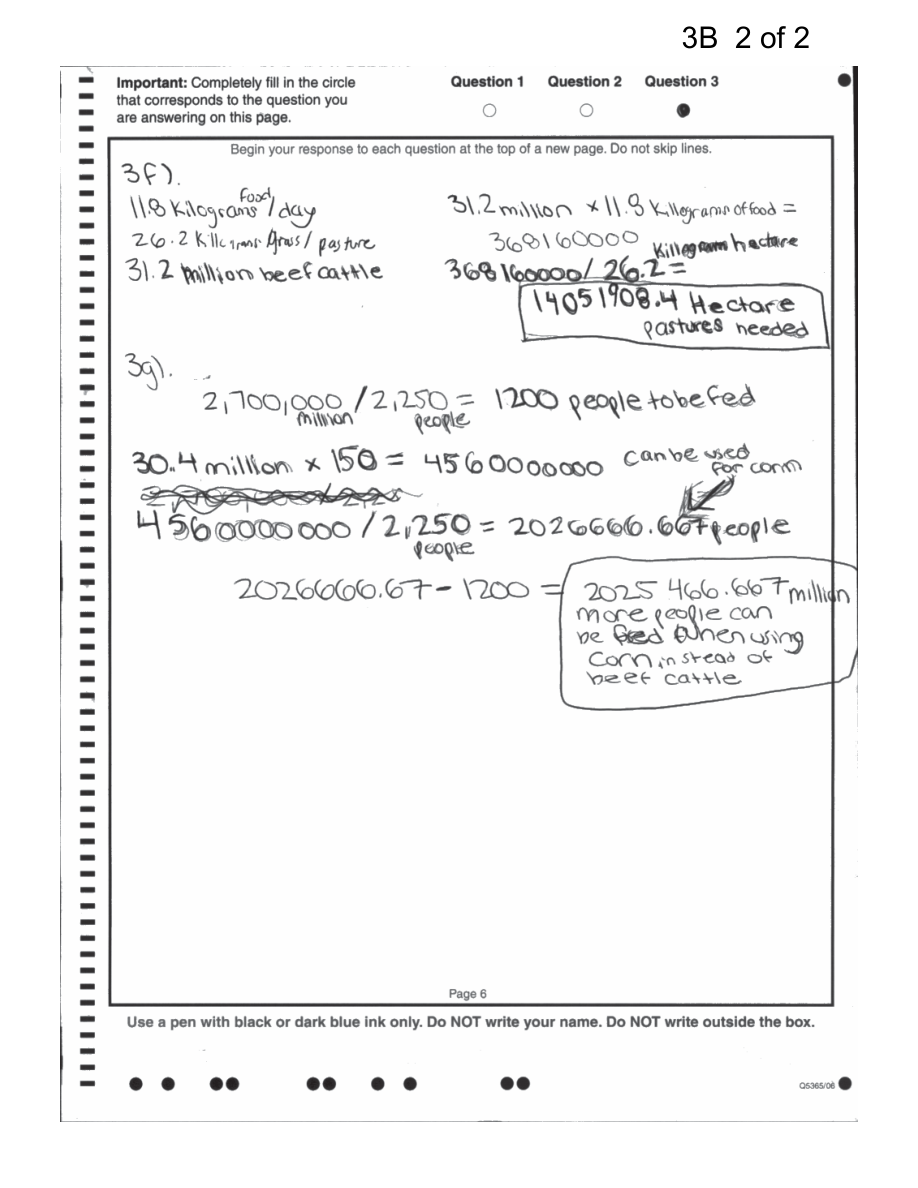
- Figure — Sample Responses Question 3 - Set 2 (p. 3)
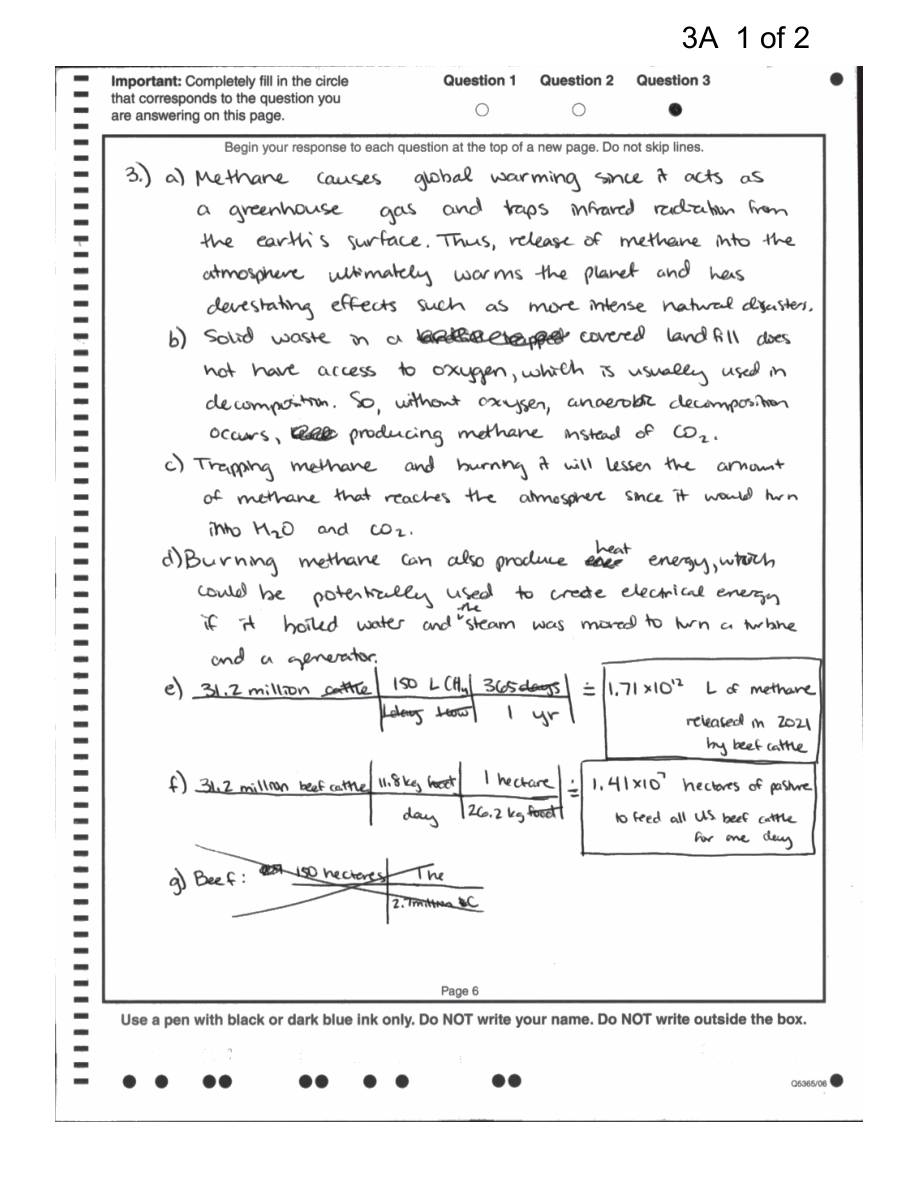
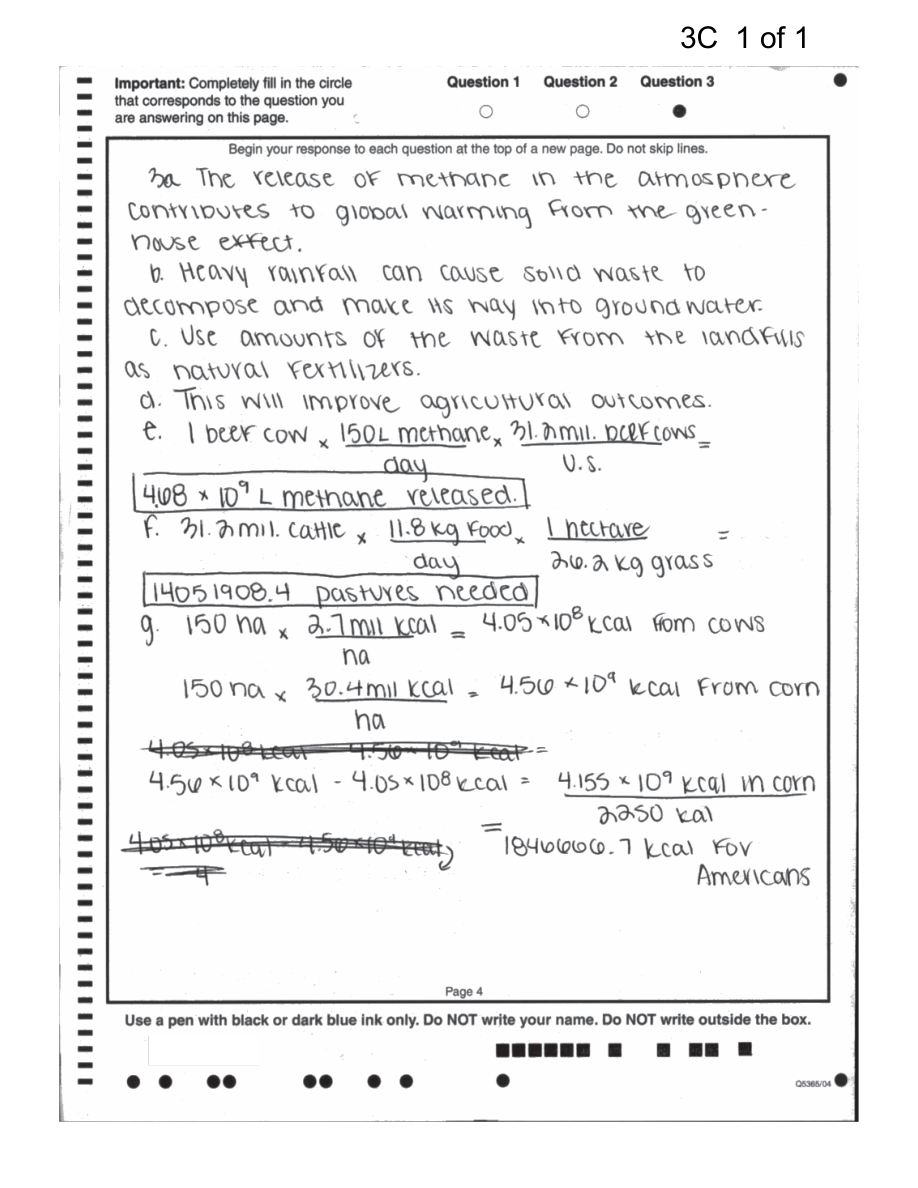
- Figure — Sample Responses Question 3 - Set 2 (p. 6)
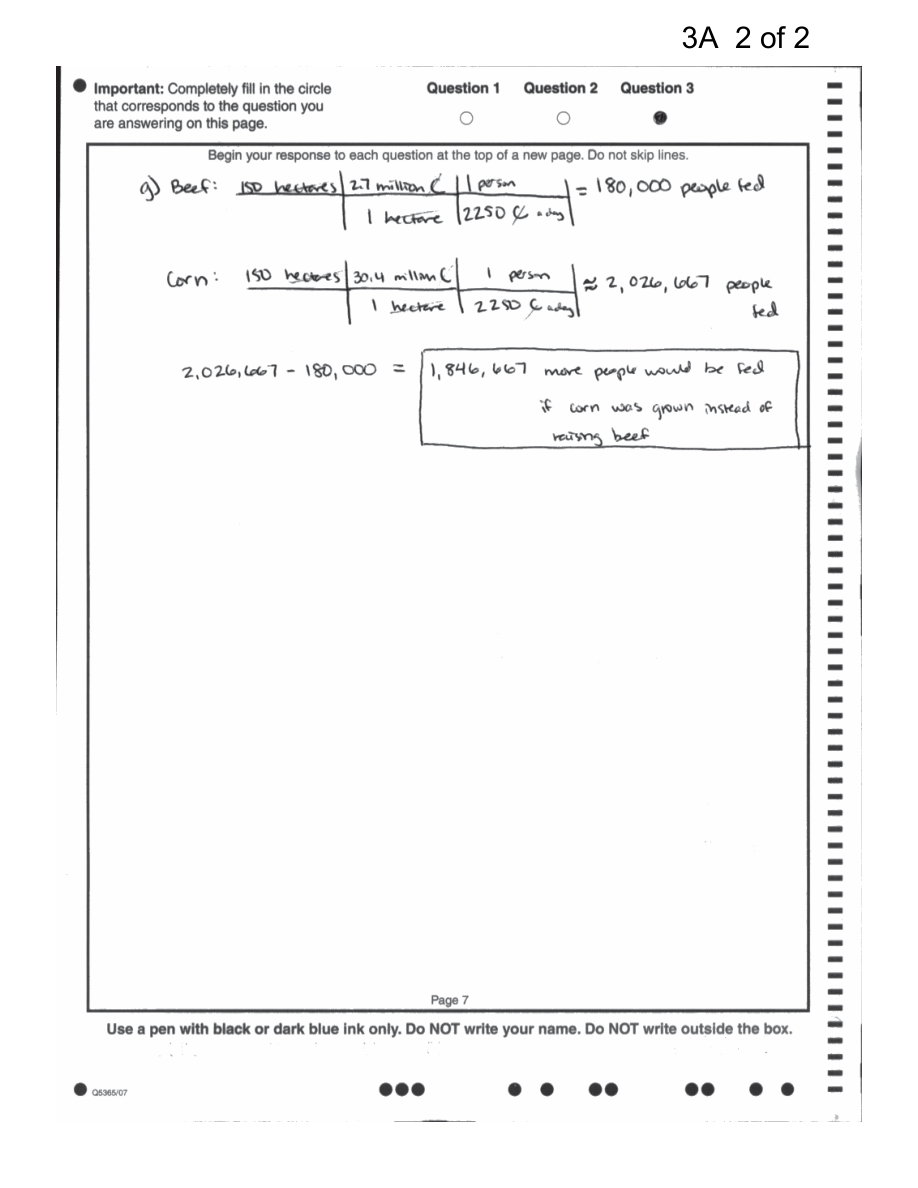
- Figure — Sample Responses Question 3 - Set 2 (p. 7)
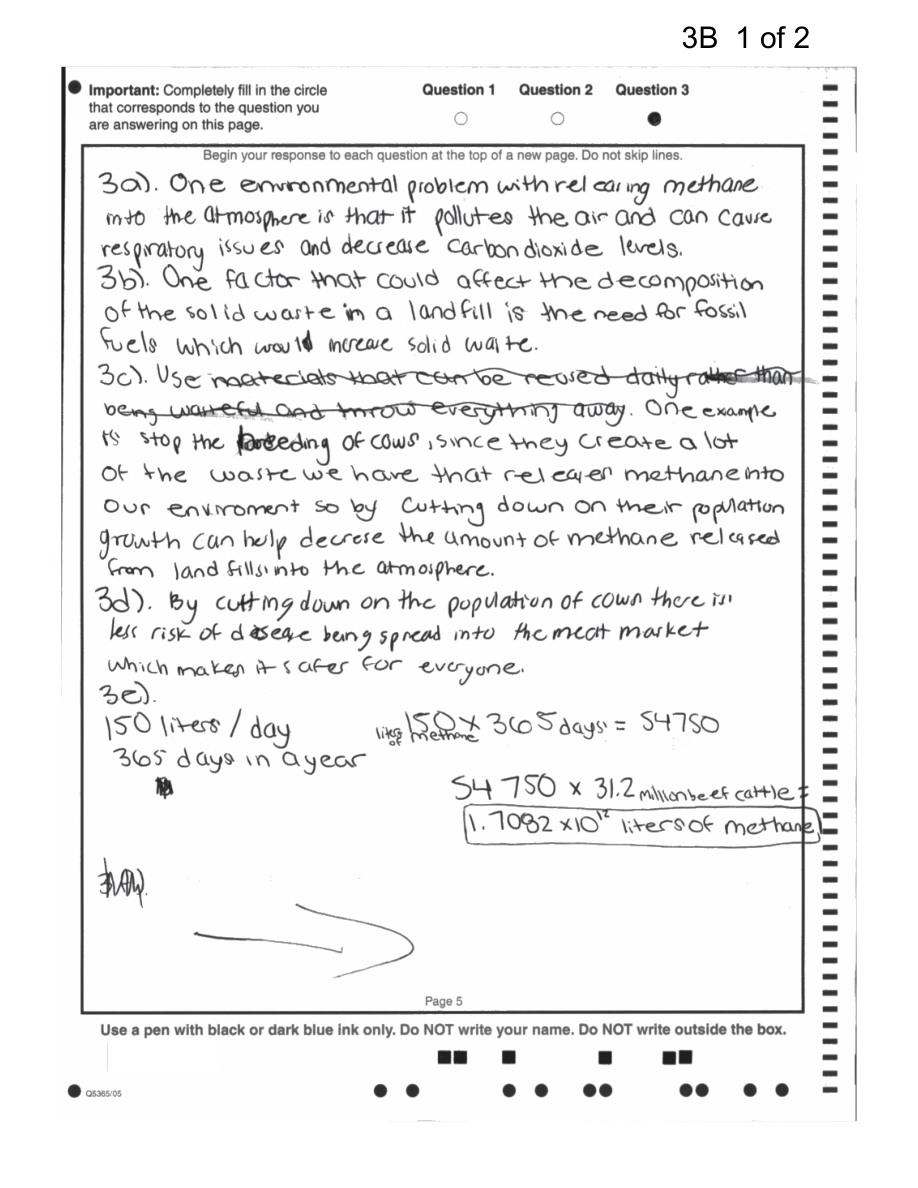
- Figure — Sample Responses Question 3 - Set 2 (p. 8)