From the free course AP Environmental Science on Lykke
3.7 Total Fertility Rate · 3.8 Human Population Dynamics
Key concepts: Total fertility rate (TFR) · Human population dynamics · Birth rates and death rates · Immigration and emigration · Rate of natural increase (RNI) · Replacement-level fertility · Infant mortality rates · Population pyramids · Factors affecting fertility, including age at first child and education · Data analysis of population patterns and trends
A population can continue growing even after its total fertility rate has fallen because today’s large number of young people may still enter childbearing ages.
3.7 Total Fertility Rate · 3.8 Human Population Dynamics
A population can continue growing even after its total fertility rate has fallen because today’s large number of young people may still enter childbearing ages. Human population change therefore depends on more than births alone: it is the combined result of births, deaths, immigration, and emigration.
Total Fertility Rate and Its Drivers
Total fertility rate (TFR) is the average number of children a female is expected to have over her lifetime if current age-specific fertility rates remain constant. TFR describes reproductive patterns across a population; it is not the number of births occurring in one year and not the fertility of one individual.
EIN-1.B — Learning Objective: Explain factors that affect total fertility rate in human populations.
The EIN-1.B.1 factors affecting TFR include the age at which females have their first child, educational opportunities for females, access to family planning, and government acts and policies. When people have greater access to education and family planning, and when childbearing begins later, the average number of children often decreases because individuals have more control over the timing and number of births.
These factors interact rather than operate as isolated switches:
| Factor | How it can affect TFR |
|---|---|
| Age at first child | Earlier first births generally allow more potential childbearing years; later first births often reduce lifetime fertility. |
| Education | More educational opportunity can delay childbearing and expand employment choices. |
| Family planning | Contraception and reproductive-health services allow people to plan births. |
| Government policy | Laws, incentives, healthcare systems, and social programs can influence reproductive decisions. |
| Healthcare and nutrition | Better maternal care and nutrition can reduce infant mortality and alter fertility decisions over time. |
Replacement-level fertility is the fertility rate at which a population replaces itself from one generation to the next. Under EIN-1.B.2, fertility at replacement levels produces a relatively stable population when other factors, especially migration, are excluded. Replacement level is not a universal single number because survival rates and population conditions differ.
Under EIN-1.B.3, infant mortality is associated with whether mothers have access to good healthcare and nutrition. If infant mortality is high, families may have more children because some may not survive to adulthood; if healthcare and nutrition improve, infant mortality may decline, and fertility patterns may change over time.
Misconception check: A lower TFR does not automatically mean that the population immediately shrinks. Population age structure can delay the effect of changing fertility.
Human Population Dynamics
Human population dynamics describes how the size and structure of a human population change through time. The basic accounting relationship is:
$$ \Delta P = (B - D) + (I - E) $$
where $B$ is births, $D$ is deaths, $I$ is immigration, and $E$ is emigration. Births and immigration increase population size; deaths and emigration decrease it.
Birth and death rates respond to social and environmental conditions. Access to education, family planning, healthcare, and nutrition can affect birth rates, death rates, and infant mortality. Poor health conditions, inadequate nutrition, or limited medical access may increase death rates, while improved healthcare can reduce mortality even before fertility declines.
Rate of Natural Increase
The rate of natural increase (RNI) measures population growth or decline from births and deaths alone, excluding migration. Under EIN-1.C.4, RNI is calculated by subtracting the crude death rate from the crude birth rate and is typically expressed as a percentage:
$$ \text{RNI} = \text{crude birth rate} - \text{crude death rate} $$
If a country has a crude birth rate of $24$ births per $1{,}000$ people and a crude death rate of $9$ deaths per $1{,}000$ people:
$$ \text{RNI} = \frac{24-9}{1{,}000} \times 100 = 1.5% $$
A common estimate of population doubling time is the rule of $70$:
$$ \text{Doubling time} \approx \frac{70}{\text{annual growth rate expressed as a percentage}} $$
For an annual growth rate of $1.5%$:
$$ \text{Doubling time} \approx \frac{70}{1.5} \approx 46.7\text{ years} $$
This estimate assumes continued growth at approximately the same rate; it is not a guarantee.
EIN-1.C.1: Human population growth and decline are determined by the rates of birth, death, immigration, and emigration.
Reading Population Data
A population pyramid displays the proportions of young and old individuals. A broad base indicates a large proportion of young people and suggests potential future growth as those individuals reach reproductive ages. A more rectangular shape suggests a relatively even distribution across age groups, while a narrower base indicates fewer young people and possible future decline.
For Science Practice 5: Data Analysis, especially 5.A — Describe patterns and trends in data, identify the overall direction, compare groups or time periods, and support the statement with values from the graph or table. For example: “The TFR decreased from approximately $4.0$ to $2.1$ children per female while female educational access increased.” That response describes a pattern; merely saying “the graph changes” does not.
Environmental Significance
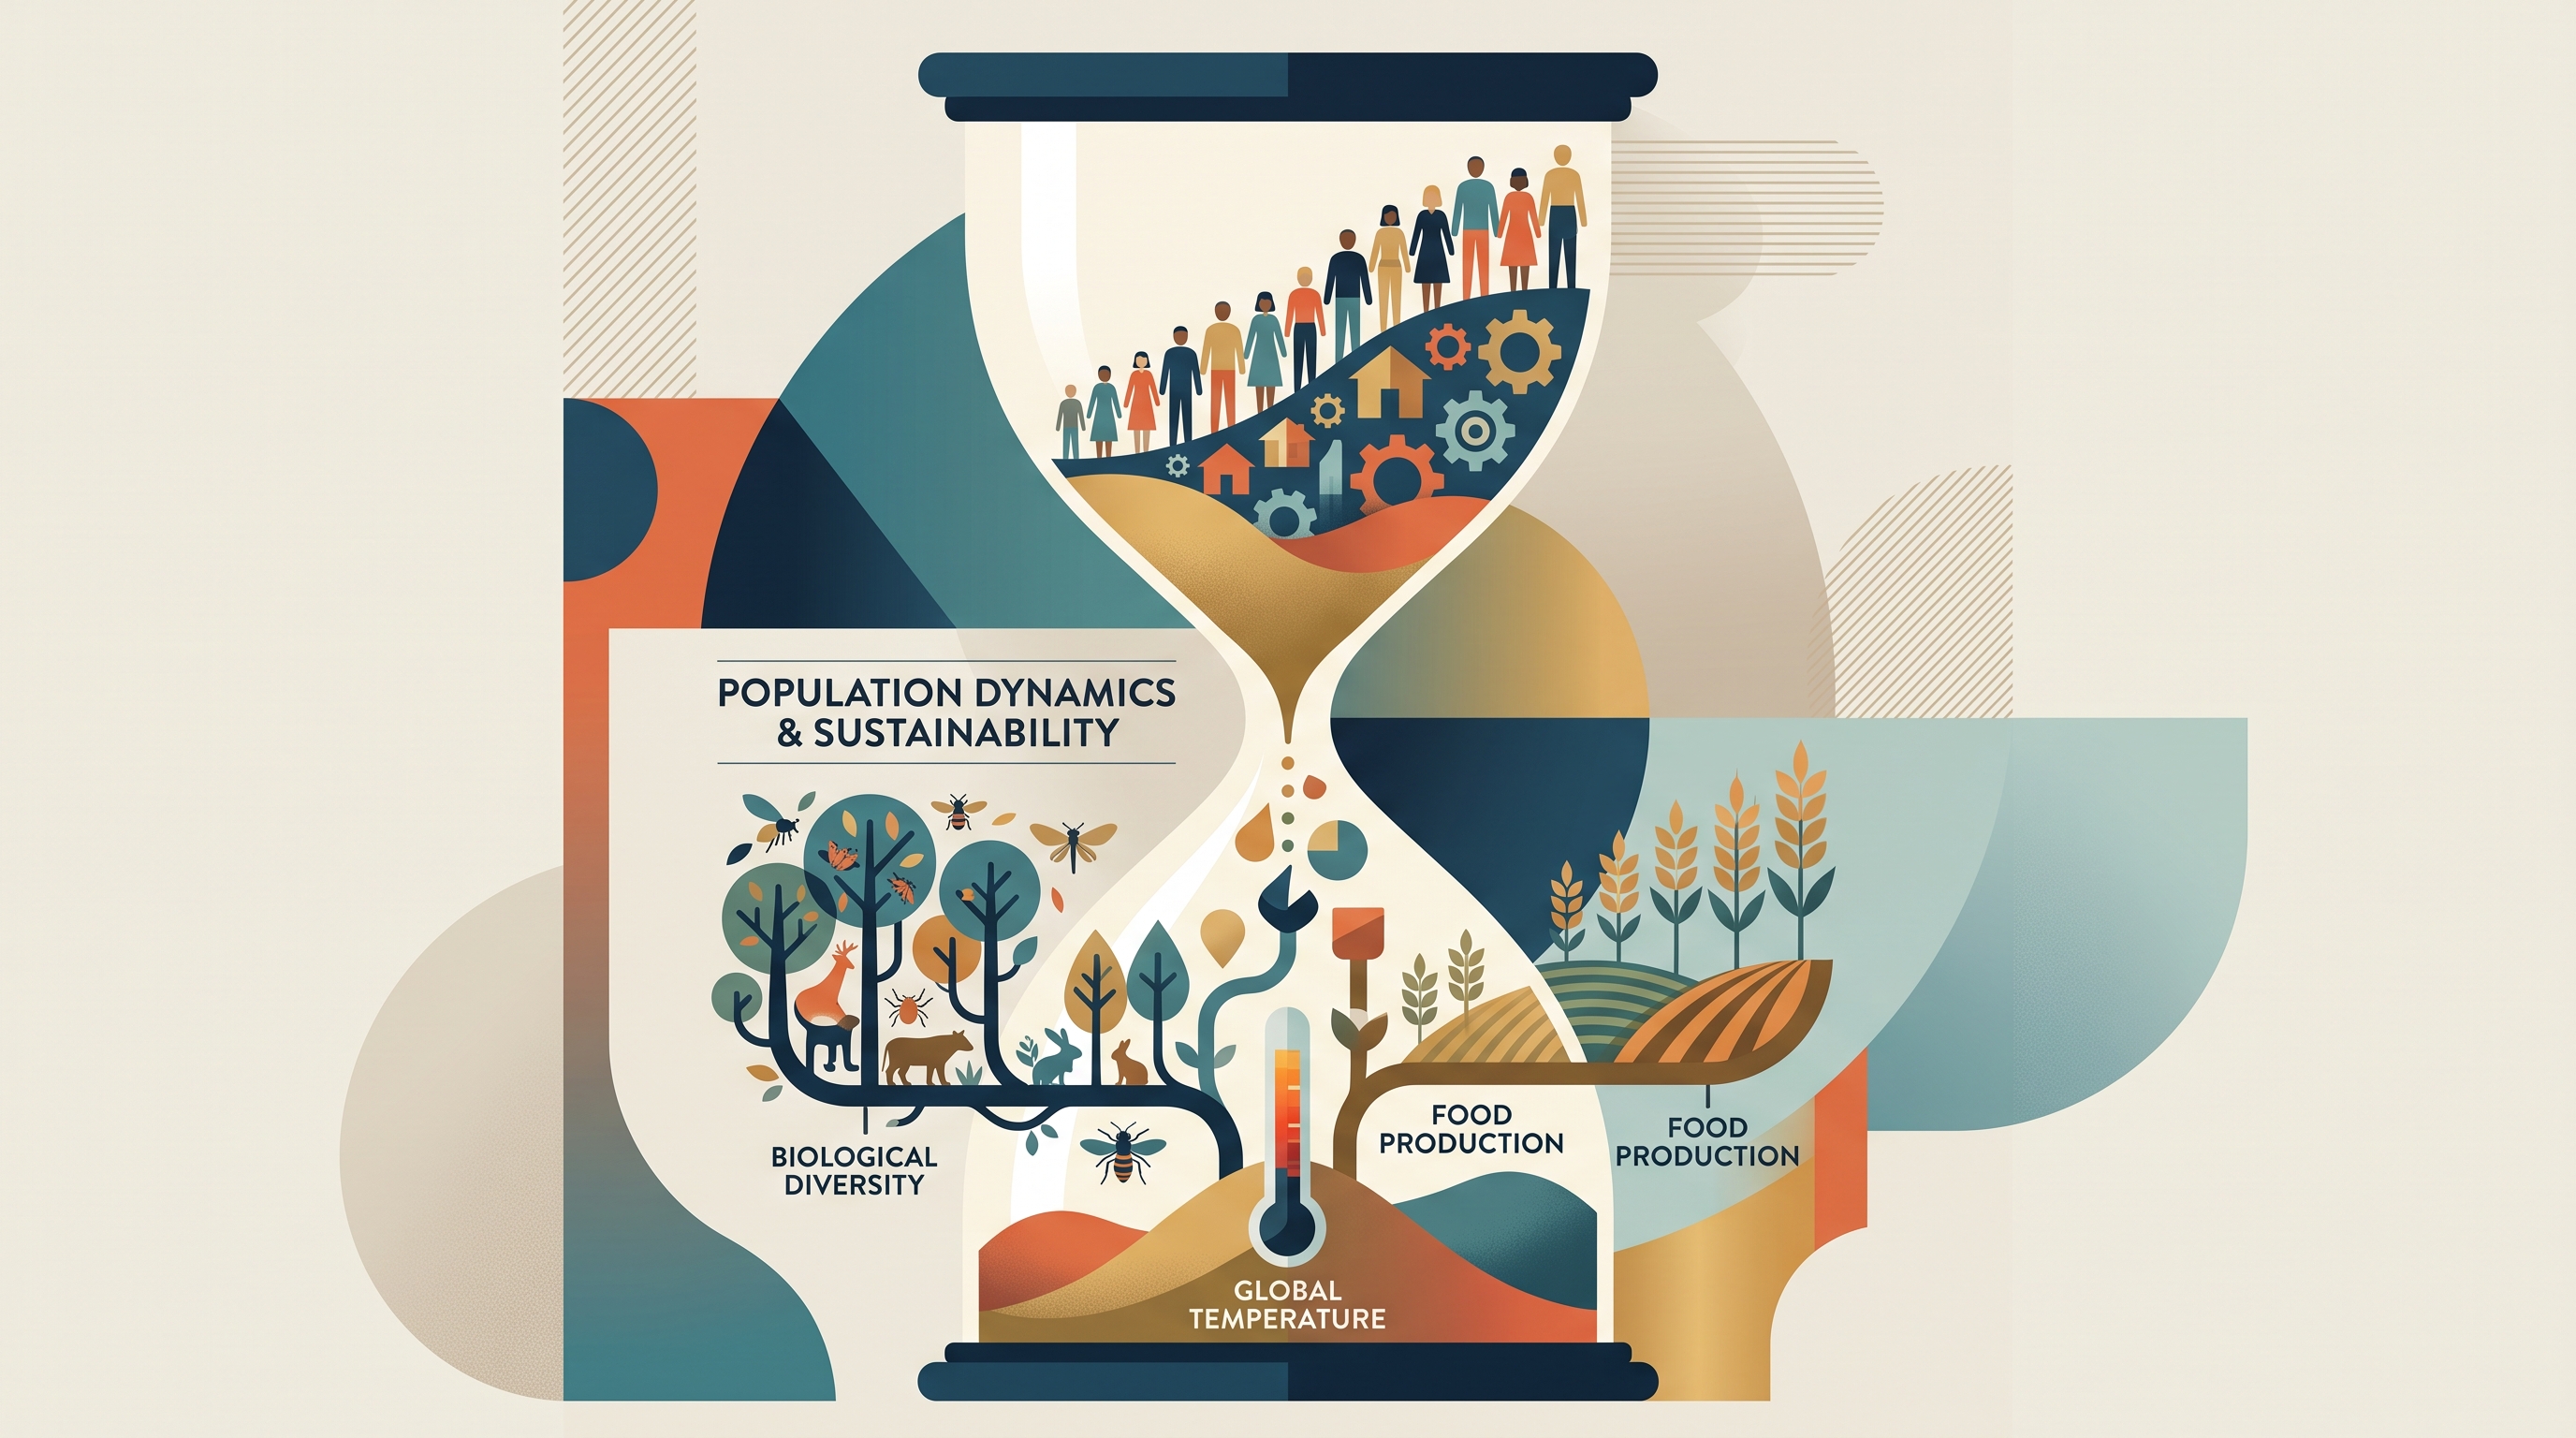
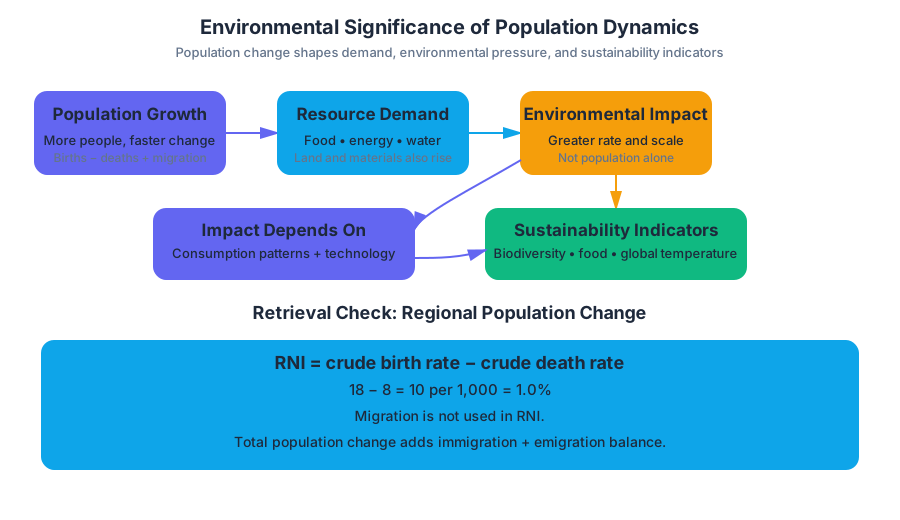
Human population growth has increased both the rate and the scale of environmental impacts. More people can increase demand for food, energy, water, land, and materials, although the environmental effect also depends on consumption patterns and technology. Sustainability can be tracked using indicators such as biological diversity, food production, and average global temperature.
Retrieval check: A region has a crude birth rate of $18$ per $1{,}000$ people, a crude death rate of $8$ per $1{,}000$, immigration of $3{,}000$ people, and emigration of $1{,}000$ people. Is its RNI calculated using migration? What is its RNI percentage, and which two population flows must be added to determine total population change?
Source Materials
- AP Environmental Science Course and Exam Description
- Review the Clarifications (.pdf)
- AP Environmental Science Course Overview
- AP Environmental Science Course at a Glance
- AP Environmental Science Course at a Glance Poster
- AP Environmental Science
- AP Environmental Science
- AP Environmental Science Sample Syllabus 1
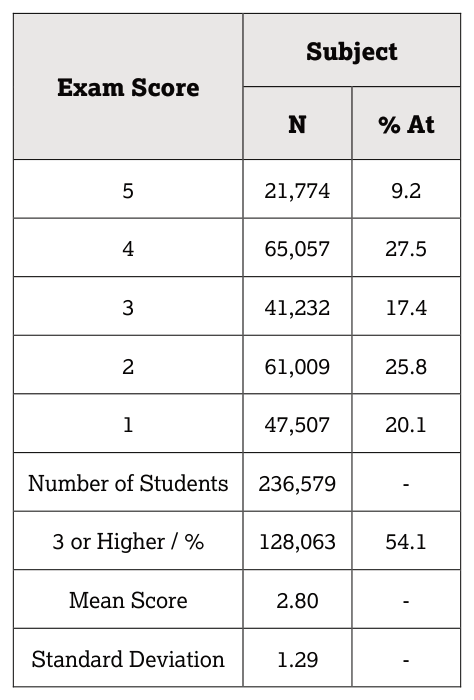
- Figure — Score Distributions (p. 1)