From the free course AP Chemistry on Lykke
3.7 Solutions and Mixtures · 3.8 Representations of Solutions
Key concepts: Solutions · Mixtures · Representations of solutions · Learning objectives · Essential knowledge
A solution is a homogeneous mixture: its composition and macroscopic properties are uniform throughout the sample. A glass of saltwater looks uniform because the dissolved particles are distributed throughout the water, not because the salt has disappeared.
3.7 Solutions and Mixtures · 3.8 Representations of Solutions
A solution is a homogeneous mixture: its composition and macroscopic properties are uniform throughout the sample. A glass of saltwater looks uniform because the dissolved particles are distributed throughout the water, not because the salt has disappeared.
Solutions versus other mixtures
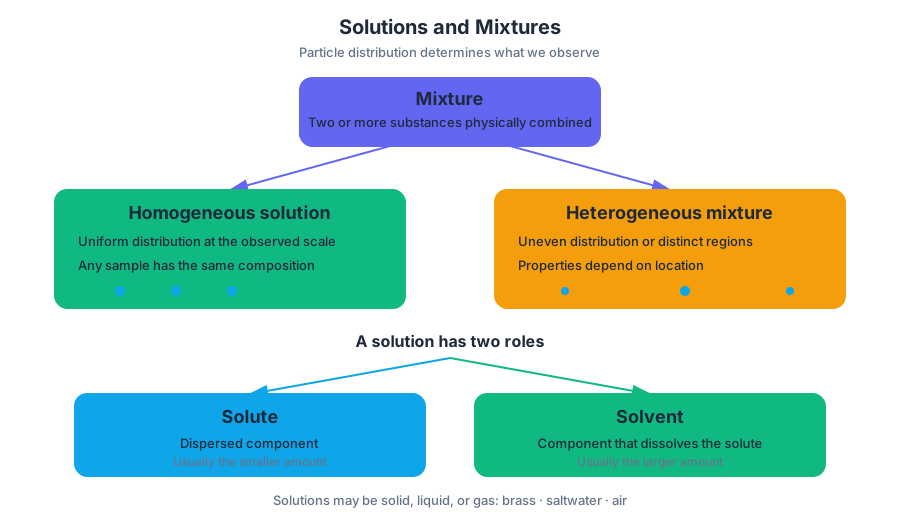
A mixture contains two or more substances physically combined. In a homogeneous mixture, the properties do not depend on where a sample is taken. In a heterogeneous mixture, properties can change from one location to another because the components are not uniformly distributed.
| Mixture type | Particle-level description | Macroscopic consequence |
|---|---|---|
| Homogeneous solution | Components are distributed uniformly at the scale being observed | A sample from any location has the same composition |
| Heterogeneous mixture | Components are unevenly distributed or remain in visibly distinct regions | Properties depend on location |
Solutions can exist as solids, liquids, or gases. Brass is a solid solution of metals, saltwater is a liquid solution, and air is a gaseous solution. The terms solute and solvent identify roles: the solute is the component dispersed in the solution, while the solvent is the component that dissolves it and is usually present in the larger amount.
Quantifying solution composition
The composition of a solution can be represented in several ways, but molarity is especially common in laboratory chemistry. Molarity, written $M$, is the amount of solute in moles per liter of solution:
$$ M=\frac{n_{\text{solute}}}{L_{\text{solution}}} $$
The denominator is the volume of the entire solution, not merely the volume of solvent. Rearranging the relationship lets you calculate any one of the three quantities:
$$ n_{\text{solute}}=M L_{\text{solution}} $$
$$ L_{\text{solution}}=\frac{n_{\text{solute}}}{M} $$
Worked example. A laboratory sample contains $0.250\ \mathrm{mol}$ of dissolved glucose in $0.500\ \mathrm{L}$ of solution. Its molarity is
$$ M=\frac{0.250\ \mathrm{mol}}{0.500\ \mathrm{L}} =0.500\ \mathrm{mol,L^{-1}} =0.500\ M $$
If the same solution were diluted until its total volume became $1.00\ \mathrm{L}$, the amount of glucose would remain $0.250\ \mathrm{mol}$, but the molarity would become
$$ M=\frac{0.250\ \mathrm{mol}}{1.00\ \mathrm{L}} =0.250\ M $$
The particles have not vanished; they are spread through a larger volume.
Key distinction: Molarity describes the ratio of solute amount to total solution volume. It is not the mass of solute, the volume of solvent, or the number of visible particles.
Topic 3.7: Solutions and Mixtures
Learning Objective 3.7.A: Calculate the number of solute particles, volume, or molarity of solutions.
Essential Knowledge 3.7.A.1 identifies solutions as homogeneous mixtures that may be solids, liquids, or gases. Their macroscopic properties do not vary throughout the sample, unlike those of a heterogeneous mixture, whose properties depend on location.
Essential Knowledge 3.7.A.2 states that solution composition can be expressed in several ways, with molarity being the most common representation in laboratory work. A reliable calculation begins by identifying the requested quantity, converting units when necessary, and applying the molarity relationship.
Topic 3.8: Representations of Solutions
Suggested Skill: Representing Data and Phenomena — 3.C: Represent visually the relationship between the structures and interactions across multiple levels or scales (e.g., particulate to macroscopic).
Learning Objective 3.8.A: Using particulate models for mixtures:
- i. Represent interactions between components.
- ii. Represent concentrations of components.
Essential Knowledge 3.8.A.1: Particulate representations of solutions communicate the structure and properties of solutions by showing the relative concentrations of the components and/or illustrating interactions among those components.
How to draw a strong particulate model
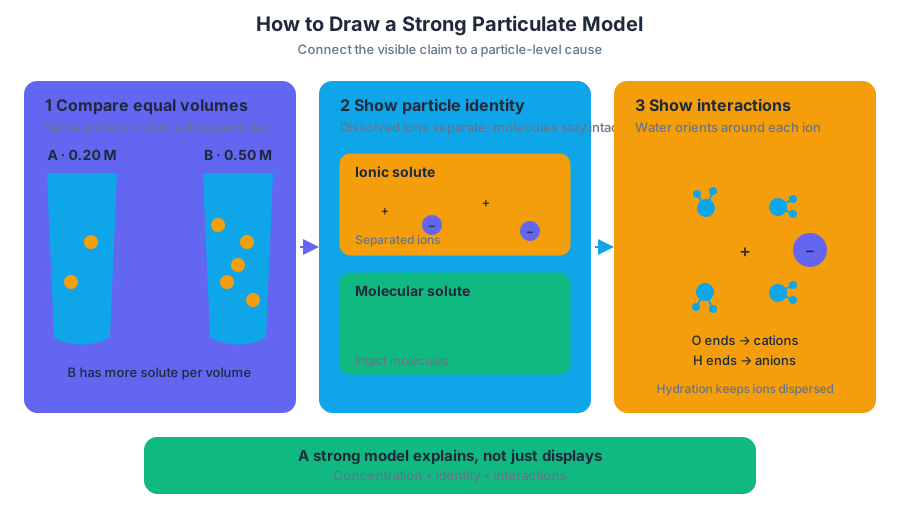
A useful model must do more than scatter dots randomly. It should connect the visible claim—such as “solution B is more concentrated”—to a particle-level cause: solution B contains more solute particles per equal volume of solution.
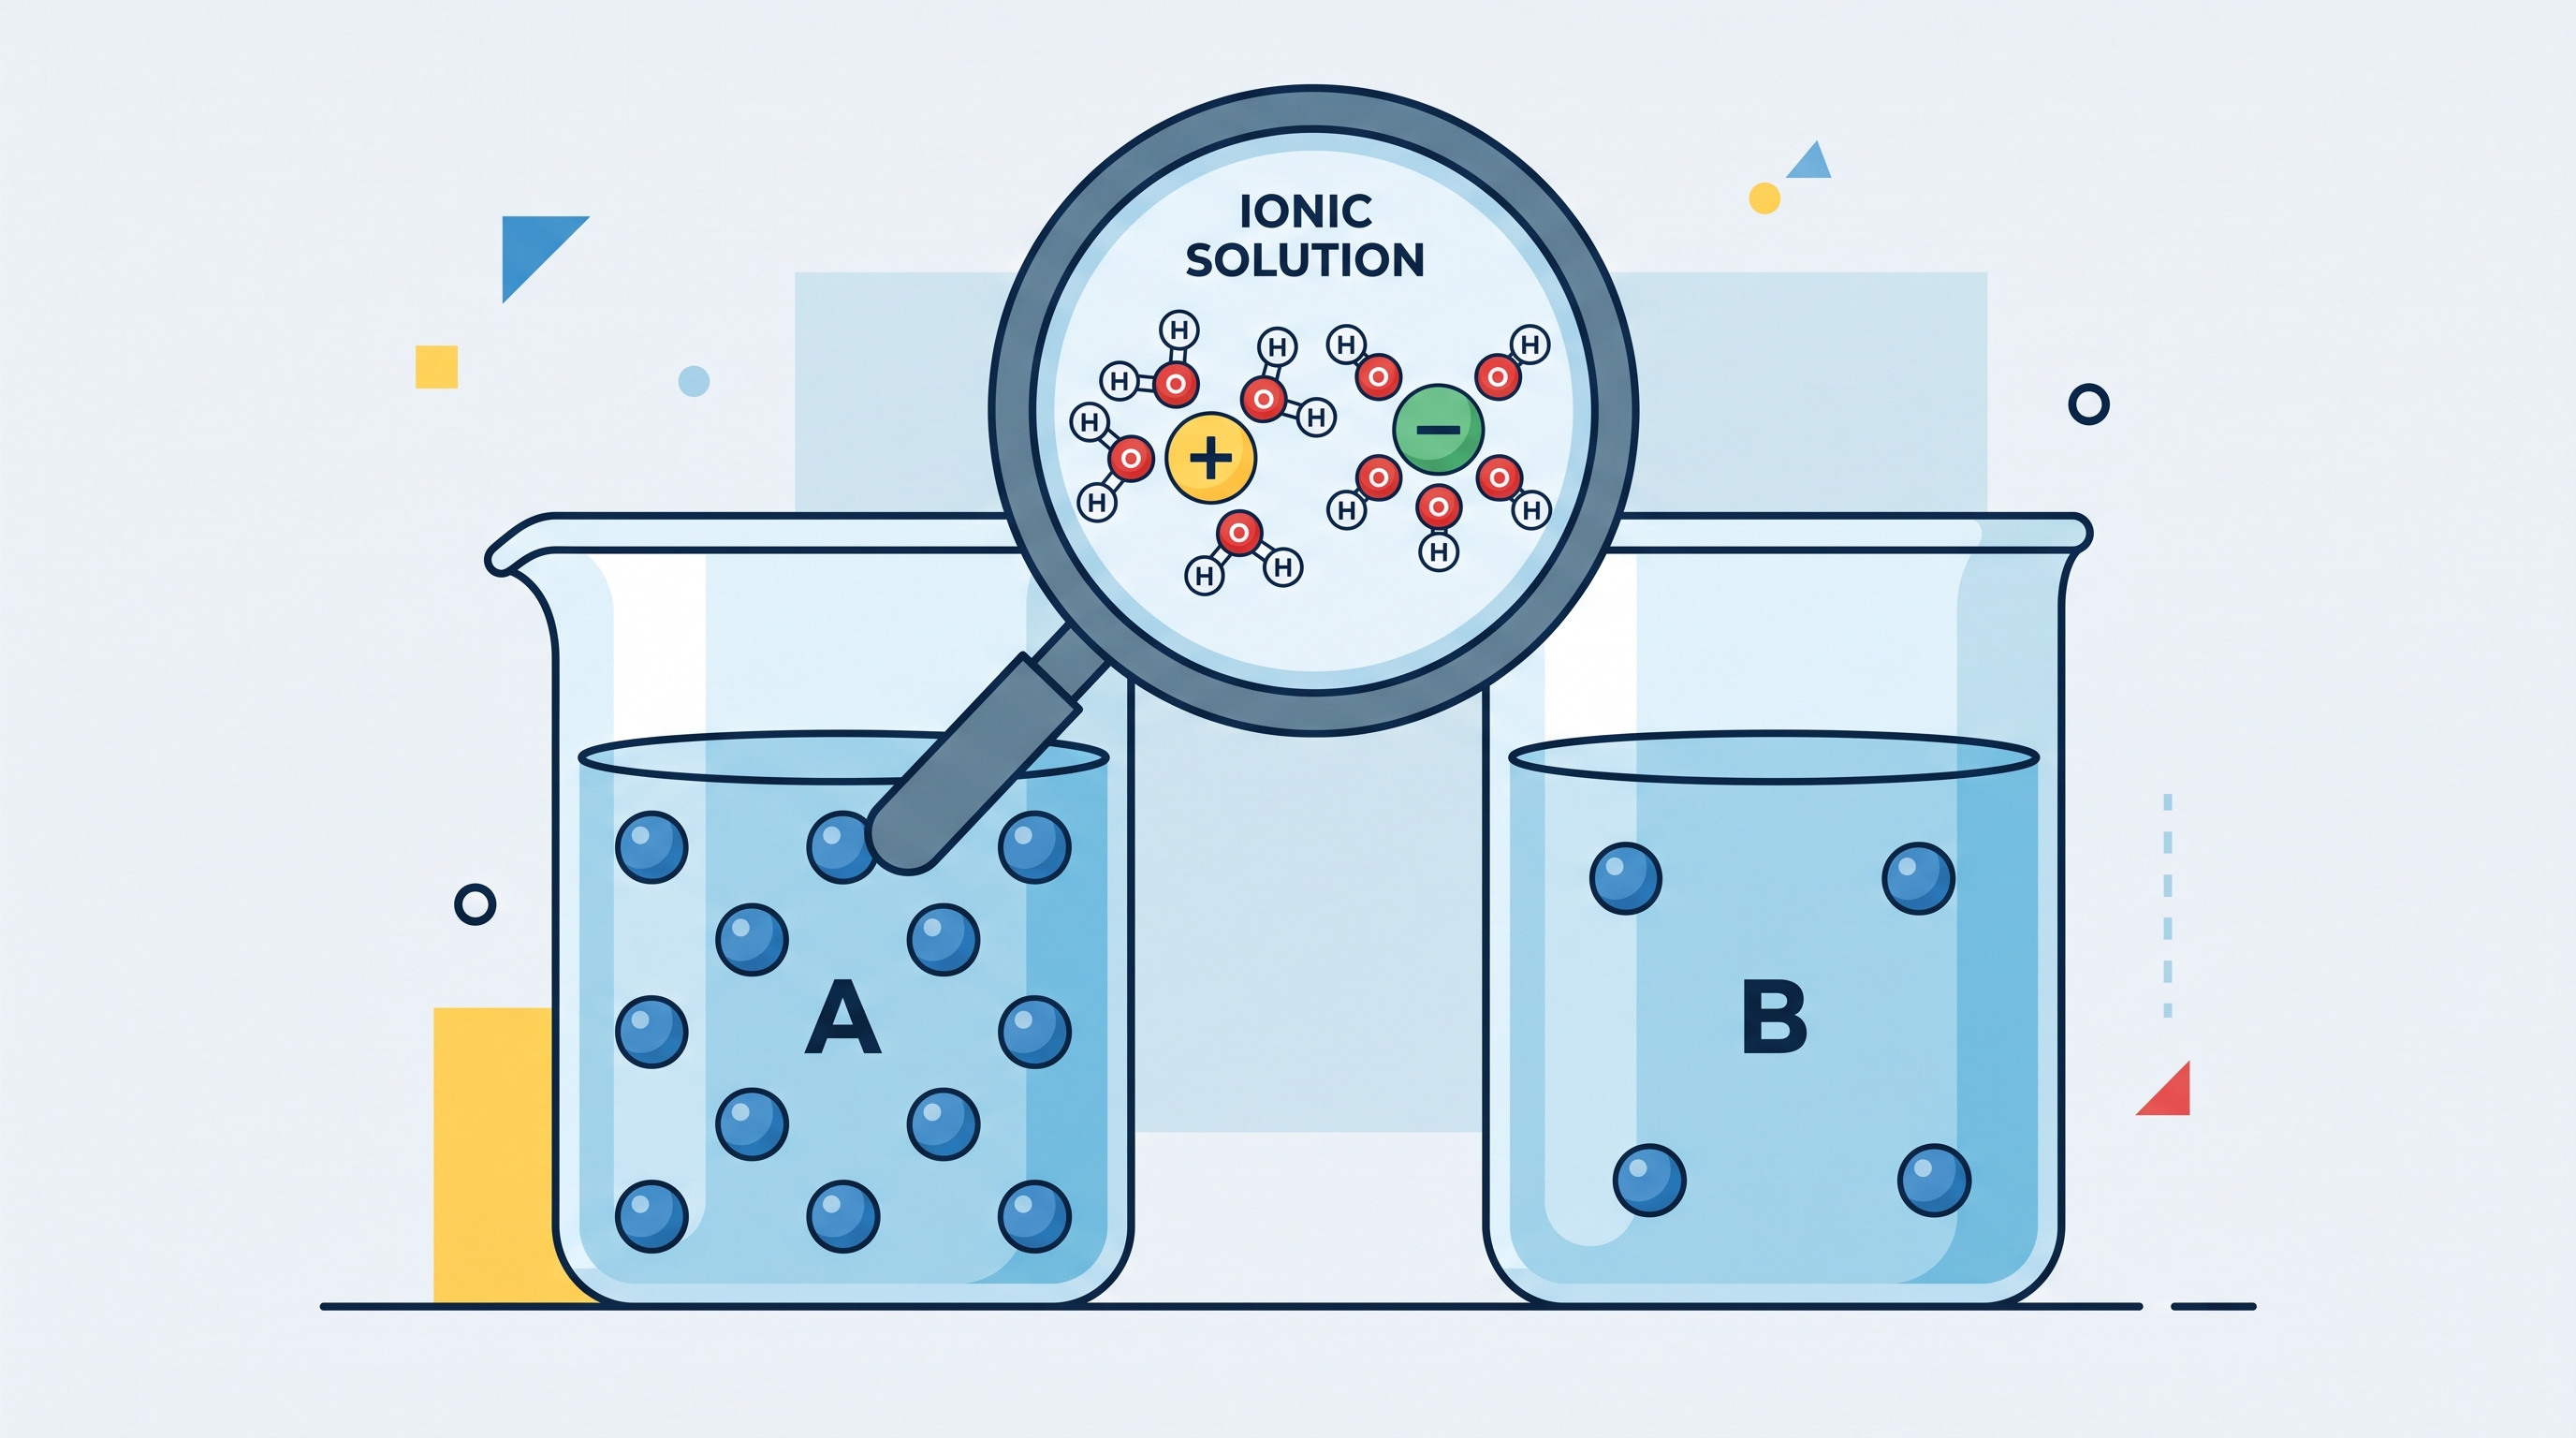
For example, two equal-volume beakers can represent a $0.20\ M$ and a $0.50\ M$ solution using identical solvent particles. The second beaker should show a greater number of solute particles in the same represented volume. If the solute is ionic, the model should show separated ions; if the solute remains molecular, it should show intact molecules.
Interactions also matter. In an aqueous ionic solution, water molecules orient their partially charged ends around ions: oxygen ends point toward cations, while hydrogen ends point toward anions. A particulate drawing that shows this arrangement explains why the ions are dispersed rather than displayed as an undissolved crystal.
Misconception check
Misconception: “A more concentrated solution must have more total particles.” Concentration compares solute amount with solution volume. A large volume of dilute solution may contain more total solute than a small volume of concentrated solution. Always compare the number of solute particles per equal volume.
Retrieval check
A model shows two equal-volume solutions. Beaker A contains twice as many solute particles as Beaker B, and both models show uniform distribution. Which is more concentrated, and what additional feature would the model need to explain an ion-containing solution?
Answer: Beaker A is more concentrated because it has more solute particles in the same volume. To explain an ionic solution, the model should show separated ions and the orientation of solvent particles around them, representing component interactions.