From the free course AP Chemistry on Lykke
1.1 Moles and Molar Mass · 1.2 Mass Spectra of Elements
Key concepts: Mole concept · Avogadro’s number · Molar mass · Converting between mass and amount of substance · Mass spectra of elements · Quantitative relationship between a mass spectrum and isotope masses · Quantitative relationship between a mass spectrum and isotope abundances · Learning objective 1.2.A · Mathematical routines (5.B) · Atomic Structure and Properties unit content
A mole is chemistry’s counting unit: just as a dozen means $12$ objects, one mole means $6.022\times10^{23}$ specified particles.
1.1 Moles and Molar Mass · 1.2 Mass Spectra of Elements
A mole is chemistry’s counting unit: just as a dozen means $12$ objects, one mole means $6.022\times10^{23}$ specified particles.
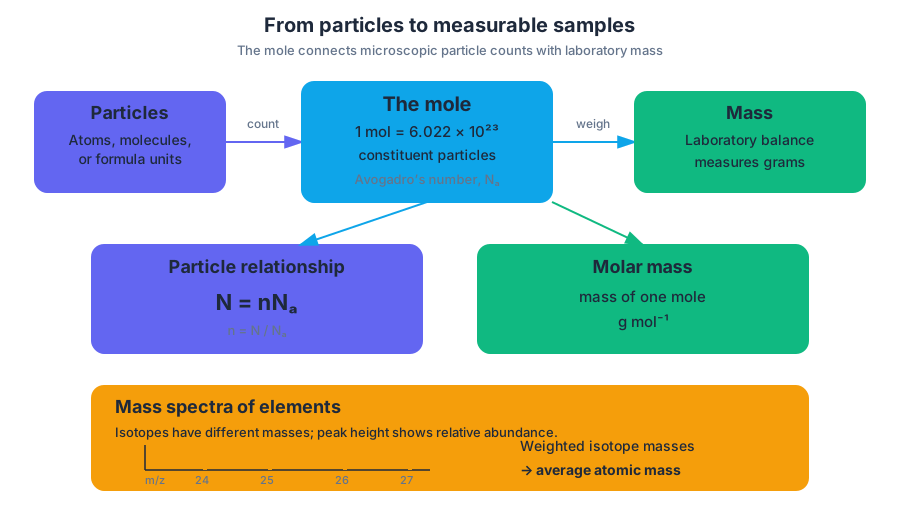
From particles to measurable samples
Atoms and molecules are far too small to count individually during a reaction, but laboratory balances measure mass. The mole connects those two scales: it tells us how many particles are present, while molar mass tells us what that amount weighs.
Avogadro’s number, $N_A=6.022\times10^{23}\ \mathrm{mol^{-1}}$, is the number of constituent particles in exactly one mole of a substance.
For an element, the particles may be atoms; for a molecular substance, they may be molecules; for an ionic compound, they are formula units. The numerical relationship is
$$ N=nN_A $$
where $N$ is the number of particles and $n$ is the amount of substance in moles. Conversely,
$$ n=\frac{N}{N_A} $$
A mole does not always mean the same mass: one mole of carbon atoms and one mole of iron atoms contain the same number of particles, but their atoms have different masses.
Molar mass: the mass of one mole
Molar mass is the mass of one mole of a substance, expressed in grams per mole, $\mathrm{g,mol^{-1}}$. Its numerical value comes from the substance’s atomic, molecular, or formula mass.
For example, the molar mass of calcium carbonate is found by adding the contributions of each atom:
$$ M(\mathrm{CaCO_3})
(1)(40.08)+(1)(12.01)+(3)(16.00)
100.09\ \mathrm{g,mol^{-1}} $$
The central conversion equation is
$$ n=\frac{m}{M} $$
where $n$ is amount in moles, $m$ is mass in grams, and $M$ is molar mass in $\mathrm{g,mol^{-1}}$.
Worked example: a mineral sample
A sample contains $25.0\ \mathrm{g}$ of $\mathrm{CaCO_3}$. How many moles of calcium carbonate does it contain?
$$ n=\frac{m}{M}
\frac{25.0\ \mathrm{g}}{100.09\ \mathrm{g,mol^{-1}}}
0.250\ \mathrm{mol} $$
The grams cancel, leaving moles. If the number of formula units is needed, continue:
$$ N=(0.250\ \mathrm{mol})(6.022\times10^{23}\ \mathrm{formula\ units,mol^{-1}}) $$
$$ N=1.51\times10^{23}\ \mathrm{formula\ units} $$
This is dimensional analysis in action: each conversion factor is chosen so unwanted units cancel.
Misconception check — “A mole is a mass.”
A mole measures amount of substance, not mass. The mass depends on particle identity. One mole of helium atoms has a much smaller mass than one mole of lead atoms, even though both samples contain $6.022\times10^{23}$ particles.
AP skill focus: Mathematical Routines
For 1.1 Moles and Molar Mass, the key mathematical routine is selecting an appropriate relationship and applying it with units. The relevant course-framework pairing is 1.B Identify an appropriate theory, definition, or mathematical relationship to solve a problem; the topic page also identifies Mathematical Routines (5.B) with the same mathematical emphasis.
A strong solution identifies the target quantity, writes the relationship before substituting values, carries units through every step, and reports a reasonable number of significant figures.
Mass spectra: counting isotopes by mass
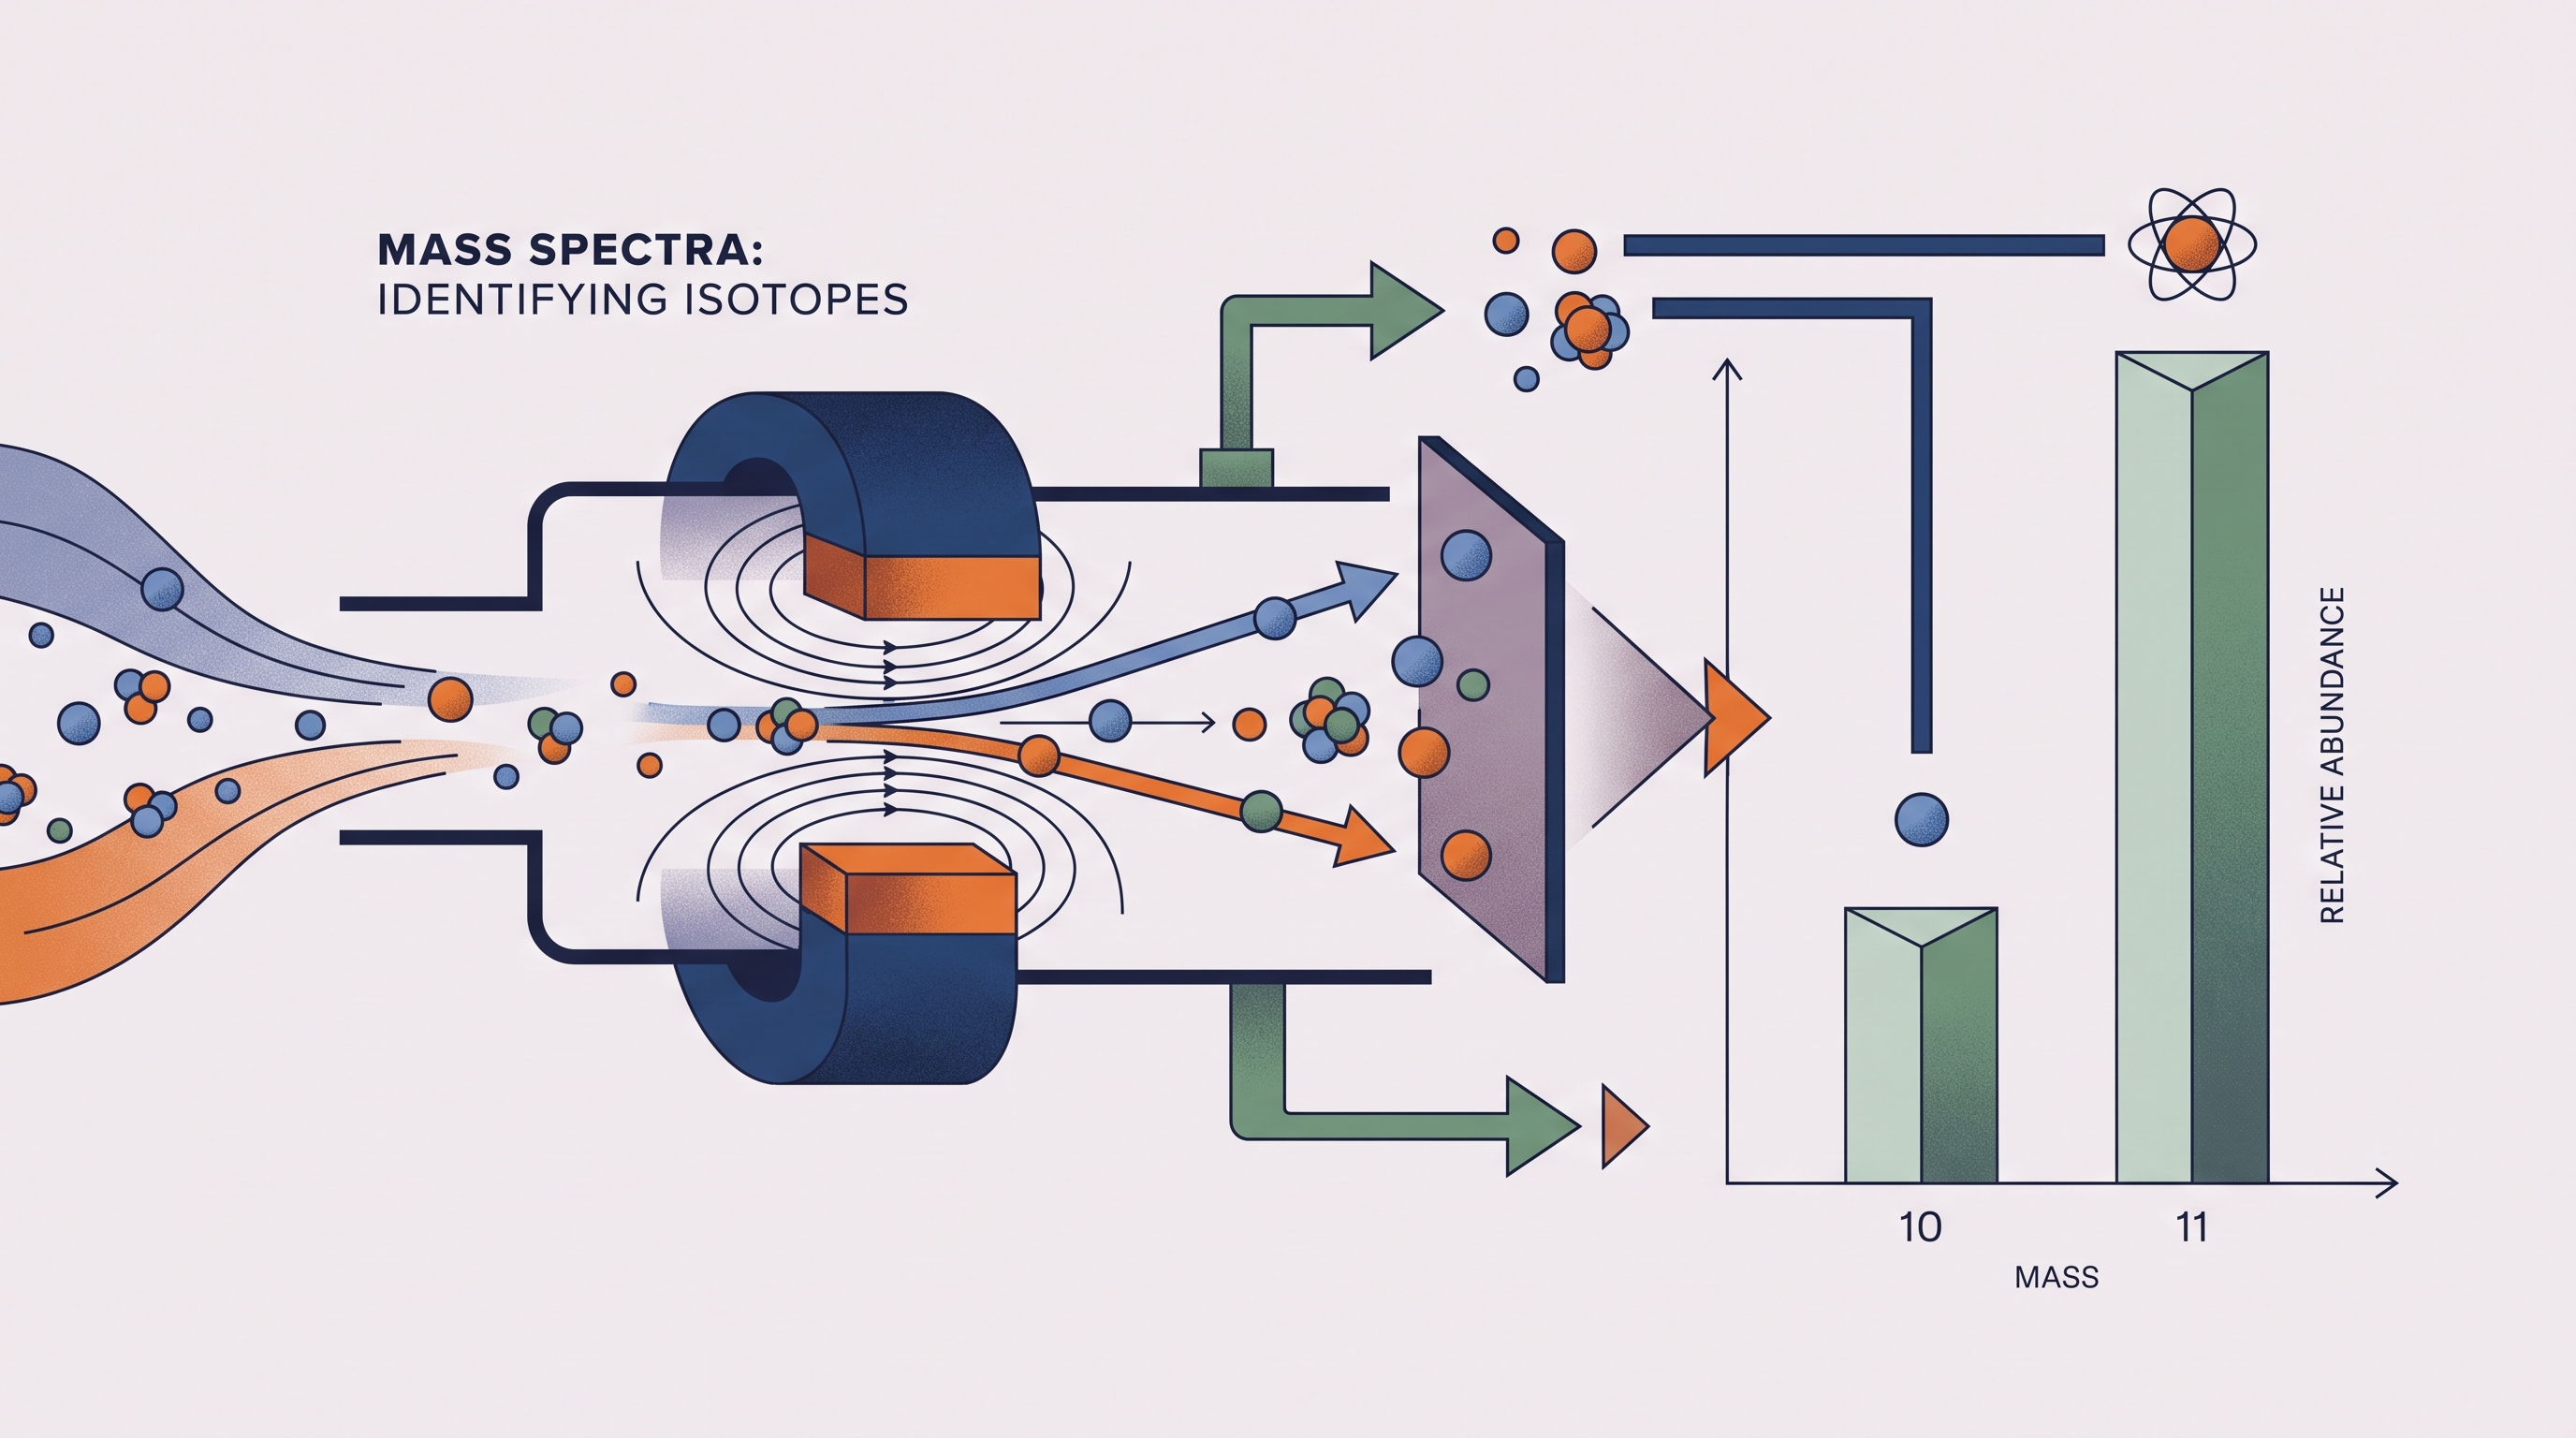
A mass spectrum displays the particles detected from a sample according to their mass-to-charge ratio, commonly written as $m/z$. For singly charged positive ions, $z=1$, so the location of a peak is approximately the isotope’s mass.
Each peak corresponds to particles with a particular mass. The peak’s horizontal position identifies an isotope’s mass, while its relative height or intensity indicates the isotope’s relative abundance in the sample.
Learning Objective 1.2.A: Explain the quantitative relationship between the mass spectrum of an element and the masses of the element’s isotopes.
Essential Knowledge 1.2.A.1: The mass spectrum of a sample containing a single element can be used to determine the identity of the isotopes of that element and the relative abundance of each isotope in nature.
Worked interpretation: two isotope peaks
Imagine an element whose spectrum has two peaks:
| Peak position | Relative abundance |
|---|---|
| $35$ | $75%$ |
| $37$ | $25%$ |
The element contains two isotopes, one with mass approximately $35$ and one with mass approximately $37$. The taller peak means the mass-$35$ isotope is more abundant; it does not mean each individual atom is lighter because it is more abundant.
The abundance-weighted average mass is
$$ \overline{m}
(0.75)(35)+(0.25)(37)
35.5 $$
Thus, the periodic-table atomic mass would lie between the isotope masses and closer to $35$ because that isotope is more common.
AP skill focus: reading graphical evidence
For 1.2 Mass Spectra of Elements, the suggested skill is 1.C Identify information presented graphically to solve a problem. Read the spectrum in two directions: use the $m/z$ values to identify particle masses, then use peak intensities to compare relative abundances. Do not confuse a peak’s position with its height.
Retrieval check: A spectrum has peaks at $10$ and $11$, with the $11$ peak three times as tall as the $10$ peak. Which isotope is more abundant, and which feature of the graph supports your answer?
Answer: The mass-$11$ isotope is more abundant; the taller peak represents its greater relative abundance. The horizontal positions identify masses, while vertical intensity compares abundance.
Source Materials
- AP Chemistry Course and Exam Description
- AP Chemistry Course and Exam Description Clarifications and Corrections
- AP Chemistry Course Overview
- AP Chemistry Course at a Glance
- AP Chemistry Course at a Glance Poster
- Adopt AP Chemistry
- AP Chemistry
- AP Chemistry
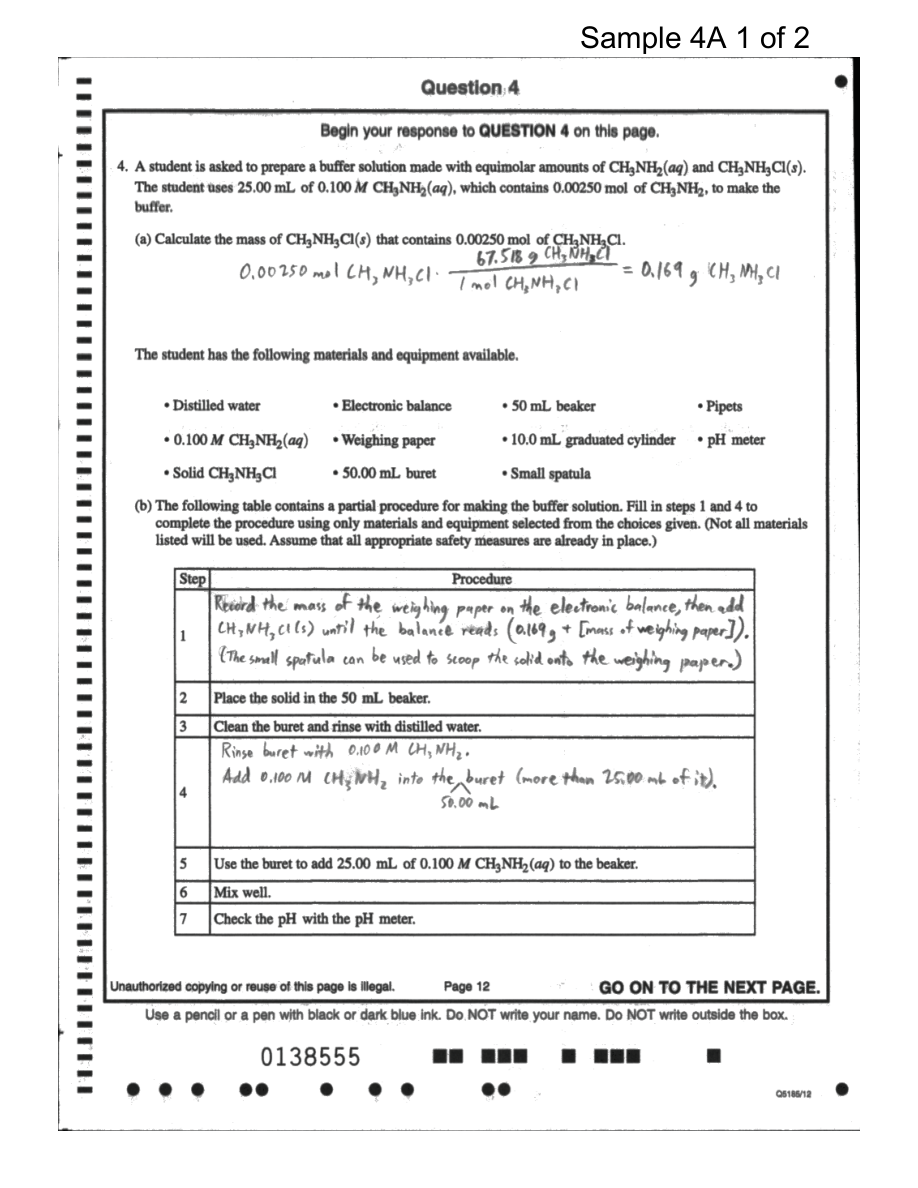
- Figure — Sample Responses Q4 (p. 3)
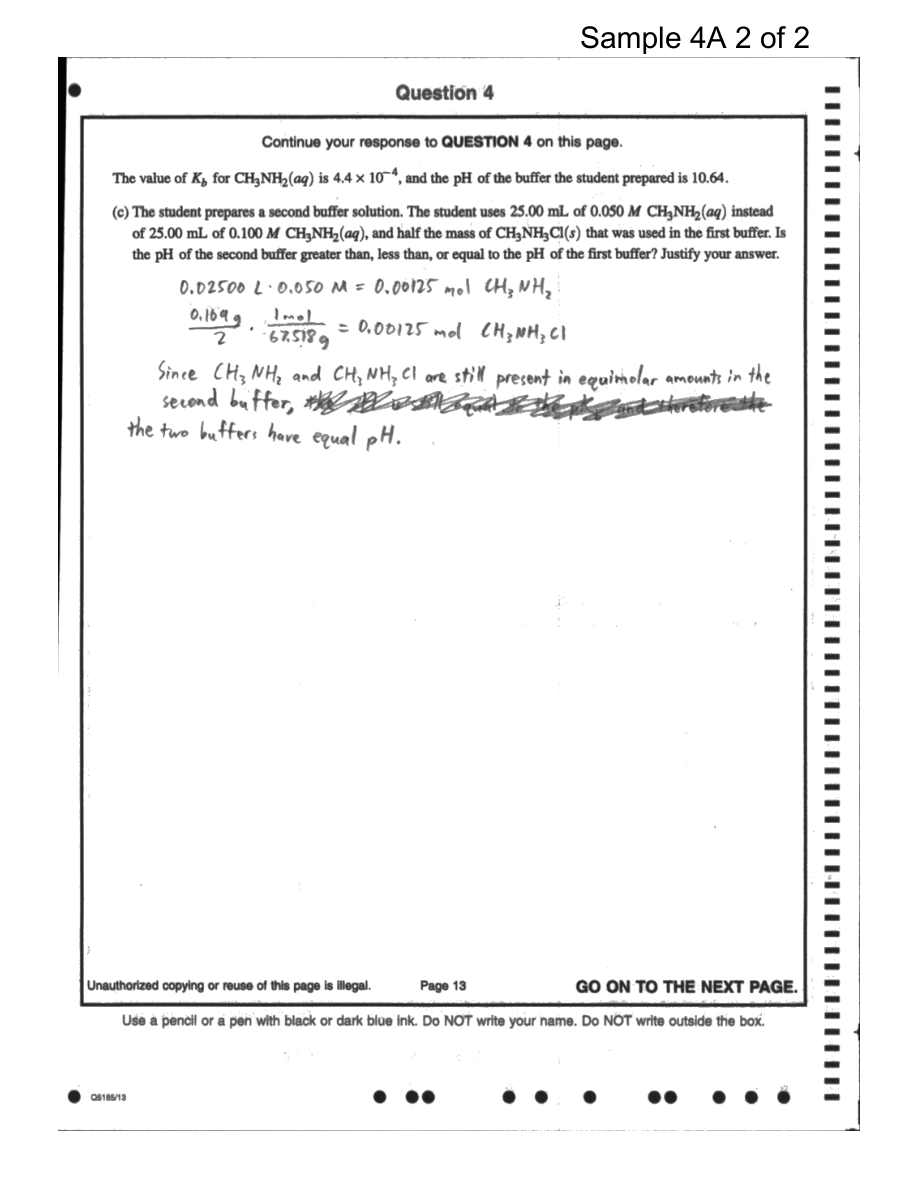
- Figure — Sample Responses Q4 (p. 4)
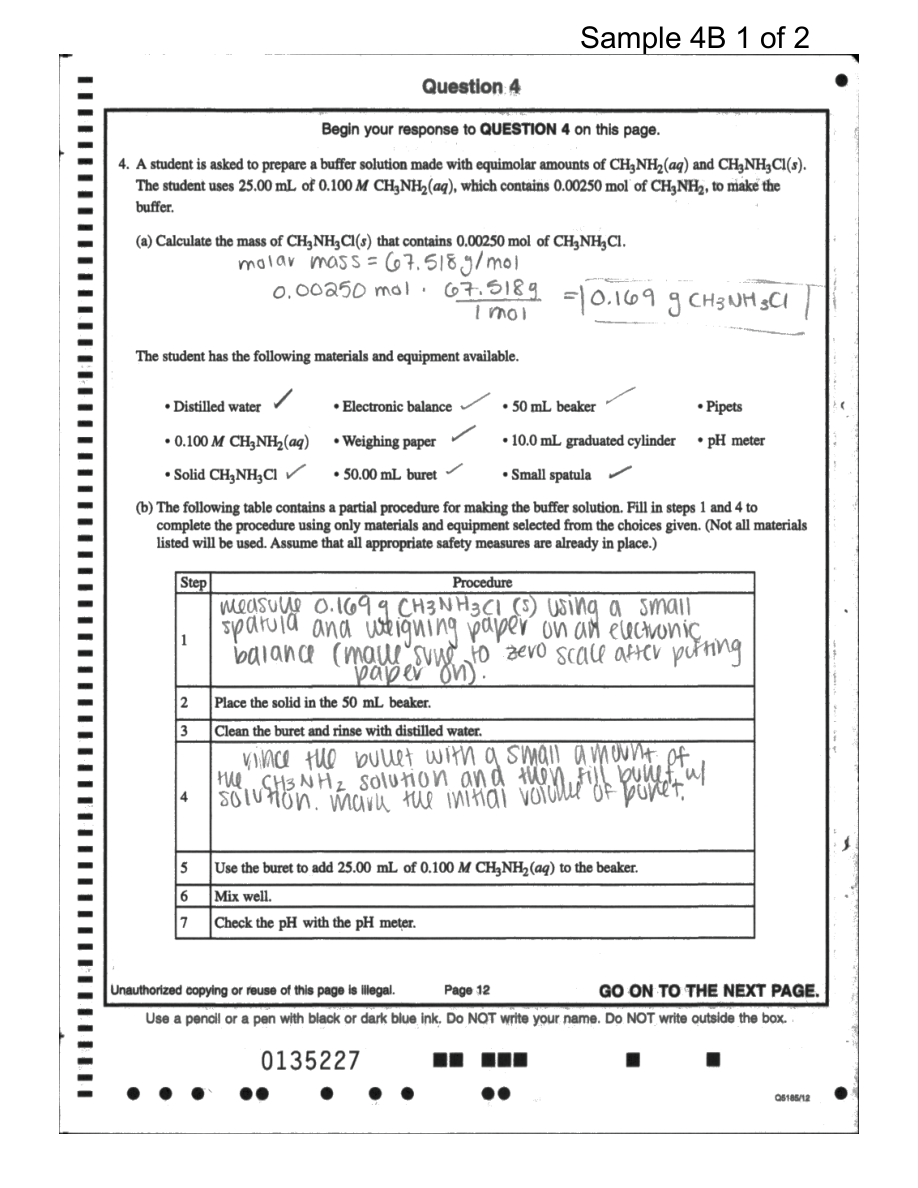
- Figure — Sample Responses Q4 (p. 5)
- Figure — Sample Responses Q4 (p. 6)