From the free course AP Chemistry on Lykke
3.13 Beer-Lambert Law
Key concepts: Beer-Lambert Law · Linear relationship between absorbance and concentration · Effect of concentration on light absorption · Effect of path length on light absorption · Molar absorptivity · Calibration curves · Dilution calculations · Determining concentration from absorbance · Experimental error in absorbance measurements · V²⁺(aq) solution analysis
A solution looks transparent because some light passes through it—but even a faintly colored solution removes a measurable fraction of the light beam. The Beer-Lambert law connects that absorbed light to the number of absorbing particles in the beam, the distance the light travels through the solution, and the…
3.13 Beer-Lambert Law
A solution looks transparent because some light passes through it—but even a faintly colored solution removes a measurable fraction of the light beam. The Beer-Lambert law connects that absorbed light to the number of absorbing particles in the beam, the distance the light travels through the solution, and the species’ ability to absorb a particular wavelength.
Learning Objective 3.13.A: Explain the amount of light absorbed by a solution of molecules or ions in relationship to the concentration, path length, and molar absorptivity.
The central relationship
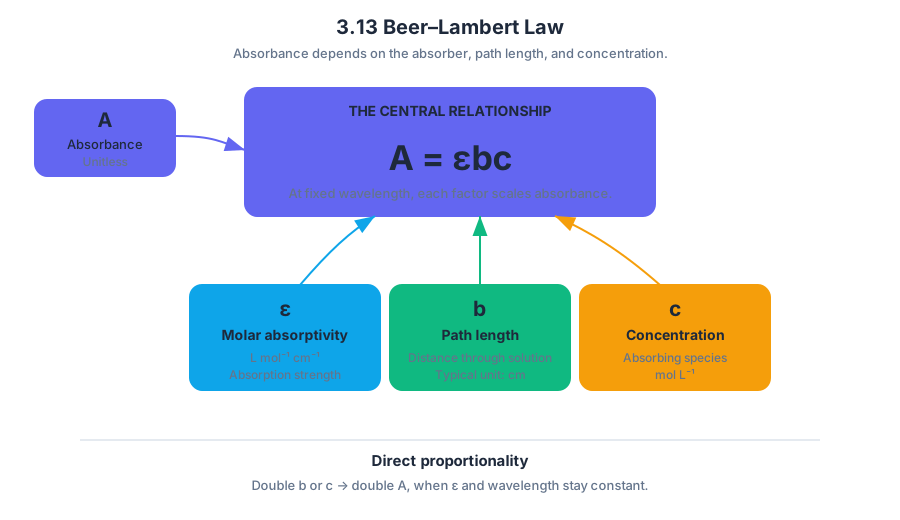
Absorbance, $A$, is a unitless measure of how strongly a solution reduces the intensity of transmitted light. The Beer-Lambert law is
$$ A=\varepsilon bc $$
where:
| Symbol | Meaning | Typical units |
|---|---|---|
| $A$ | Absorbance | Unitless |
| $\varepsilon$ | Molar absorptivity, the intensity with which a species absorbs light at a particular wavelength | $\mathrm{L,mol^{-1},cm^{-1}}$ |
| $b$ | Path length, or distance traveled by light through the solution | $\mathrm{cm}$ |
| $c$ | Concentration of the absorbing species | $\mathrm{mol,L^{-1}}$ |
The law says that absorbance increases directly with both concentration and path length when $\varepsilon$ and the wavelength remain constant. A solution with twice as many absorbing particles in the light path absorbs twice as much light; a cuvette twice as wide in the direction of the beam also produces twice the absorbance.
Why concentration and path length matter
Imagine shining a flashlight through a hallway containing colored balloons. Adding more balloons increases the chance that light encounters one. Keeping the same number of balloons but making the hallway longer also increases the number of balloons along the beam’s route. In a solution, the “balloons” are absorbing molecules or ions.
The molar absorptivity, $\varepsilon$, distinguishes substances and wavelengths. Two solutions with the same concentration and path length can have different absorbances because one chemical species may absorb that wavelength much more intensely than the other. Therefore, comparisons require the same wavelength and a known or constant path length.
Essential Knowledge 3.13.A.1: The Beer-Lambert law relates light absorption to molar absorptivity, path length, and concentration: $A=\varepsilon bc$. The path length, $b$, and concentration, $c$, are proportional to the number of light-absorbing particles in the light path.
Calibration curves: turning absorbance into concentration
A calibration curve is a graph of absorbance versus concentration for solutions whose concentrations are known. Under conditions where the Beer-Lambert law applies, the graph is linear:
$$ A=(\varepsilon b)c $$
Thus, the slope of a graph of $A$ versus $c$ is $\varepsilon b$, and an unknown concentration can be found by measuring its absorbance and locating the matching concentration on the line.
For example, suppose four equal amounts of absorbing ions produce an absorbance of $0.08$. The response is therefore $0.02$ absorbance per ion, or per corresponding concentration unit:
$$ \frac{0.08}{4}=0.020 $$
If an unknown solution gives $A=0.22$, then
$$ \text{concentration}=\frac{0.22}{0.020}=11 $$
in those calibration concentration units.
Worked laboratory example: $V^{2+}(aq)$
A calibration curve for $V^{2+}(aq)$ has slope $0.020\ \mathrm{L,mmol^{-1}}$ when measured in a $1.00\ \mathrm{cm}$ cuvette. A diluted vanadium solution has absorbance $0.22$.
Using $A=mc$, where $m$ is the calibration-curve slope,
$$ c_{\text{diluted}} =\frac{A}{m} =\frac{0.22}{0.020\ \mathrm{L,mmol^{-1}}} =11\ \mathrm{mmol,L^{-1}} $$
Therefore,
$$ c_{\text{diluted}}=0.011\ \mathrm{mol,L^{-1}} $$
If the sample was diluted by a factor of $10$, conservation of solute gives
$$ c_{\text{original}} =(10)(0.011\ \mathrm{mol,L^{-1}}) =0.11\ \mathrm{mol,L^{-1}} $$
The absorbance determines the concentration of the diluted sample first; the dilution factor must then be applied to recover the original molarity.
Misconception and experimental error
Misconception check: “A darker-looking solution always has a larger absorbance.” Not necessarily. Absorbance depends on wavelength, molar absorptivity, concentration, and path length. A pale solution measured at a strongly absorbed wavelength may have greater absorbance than a darker solution measured at a poorly absorbed wavelength.
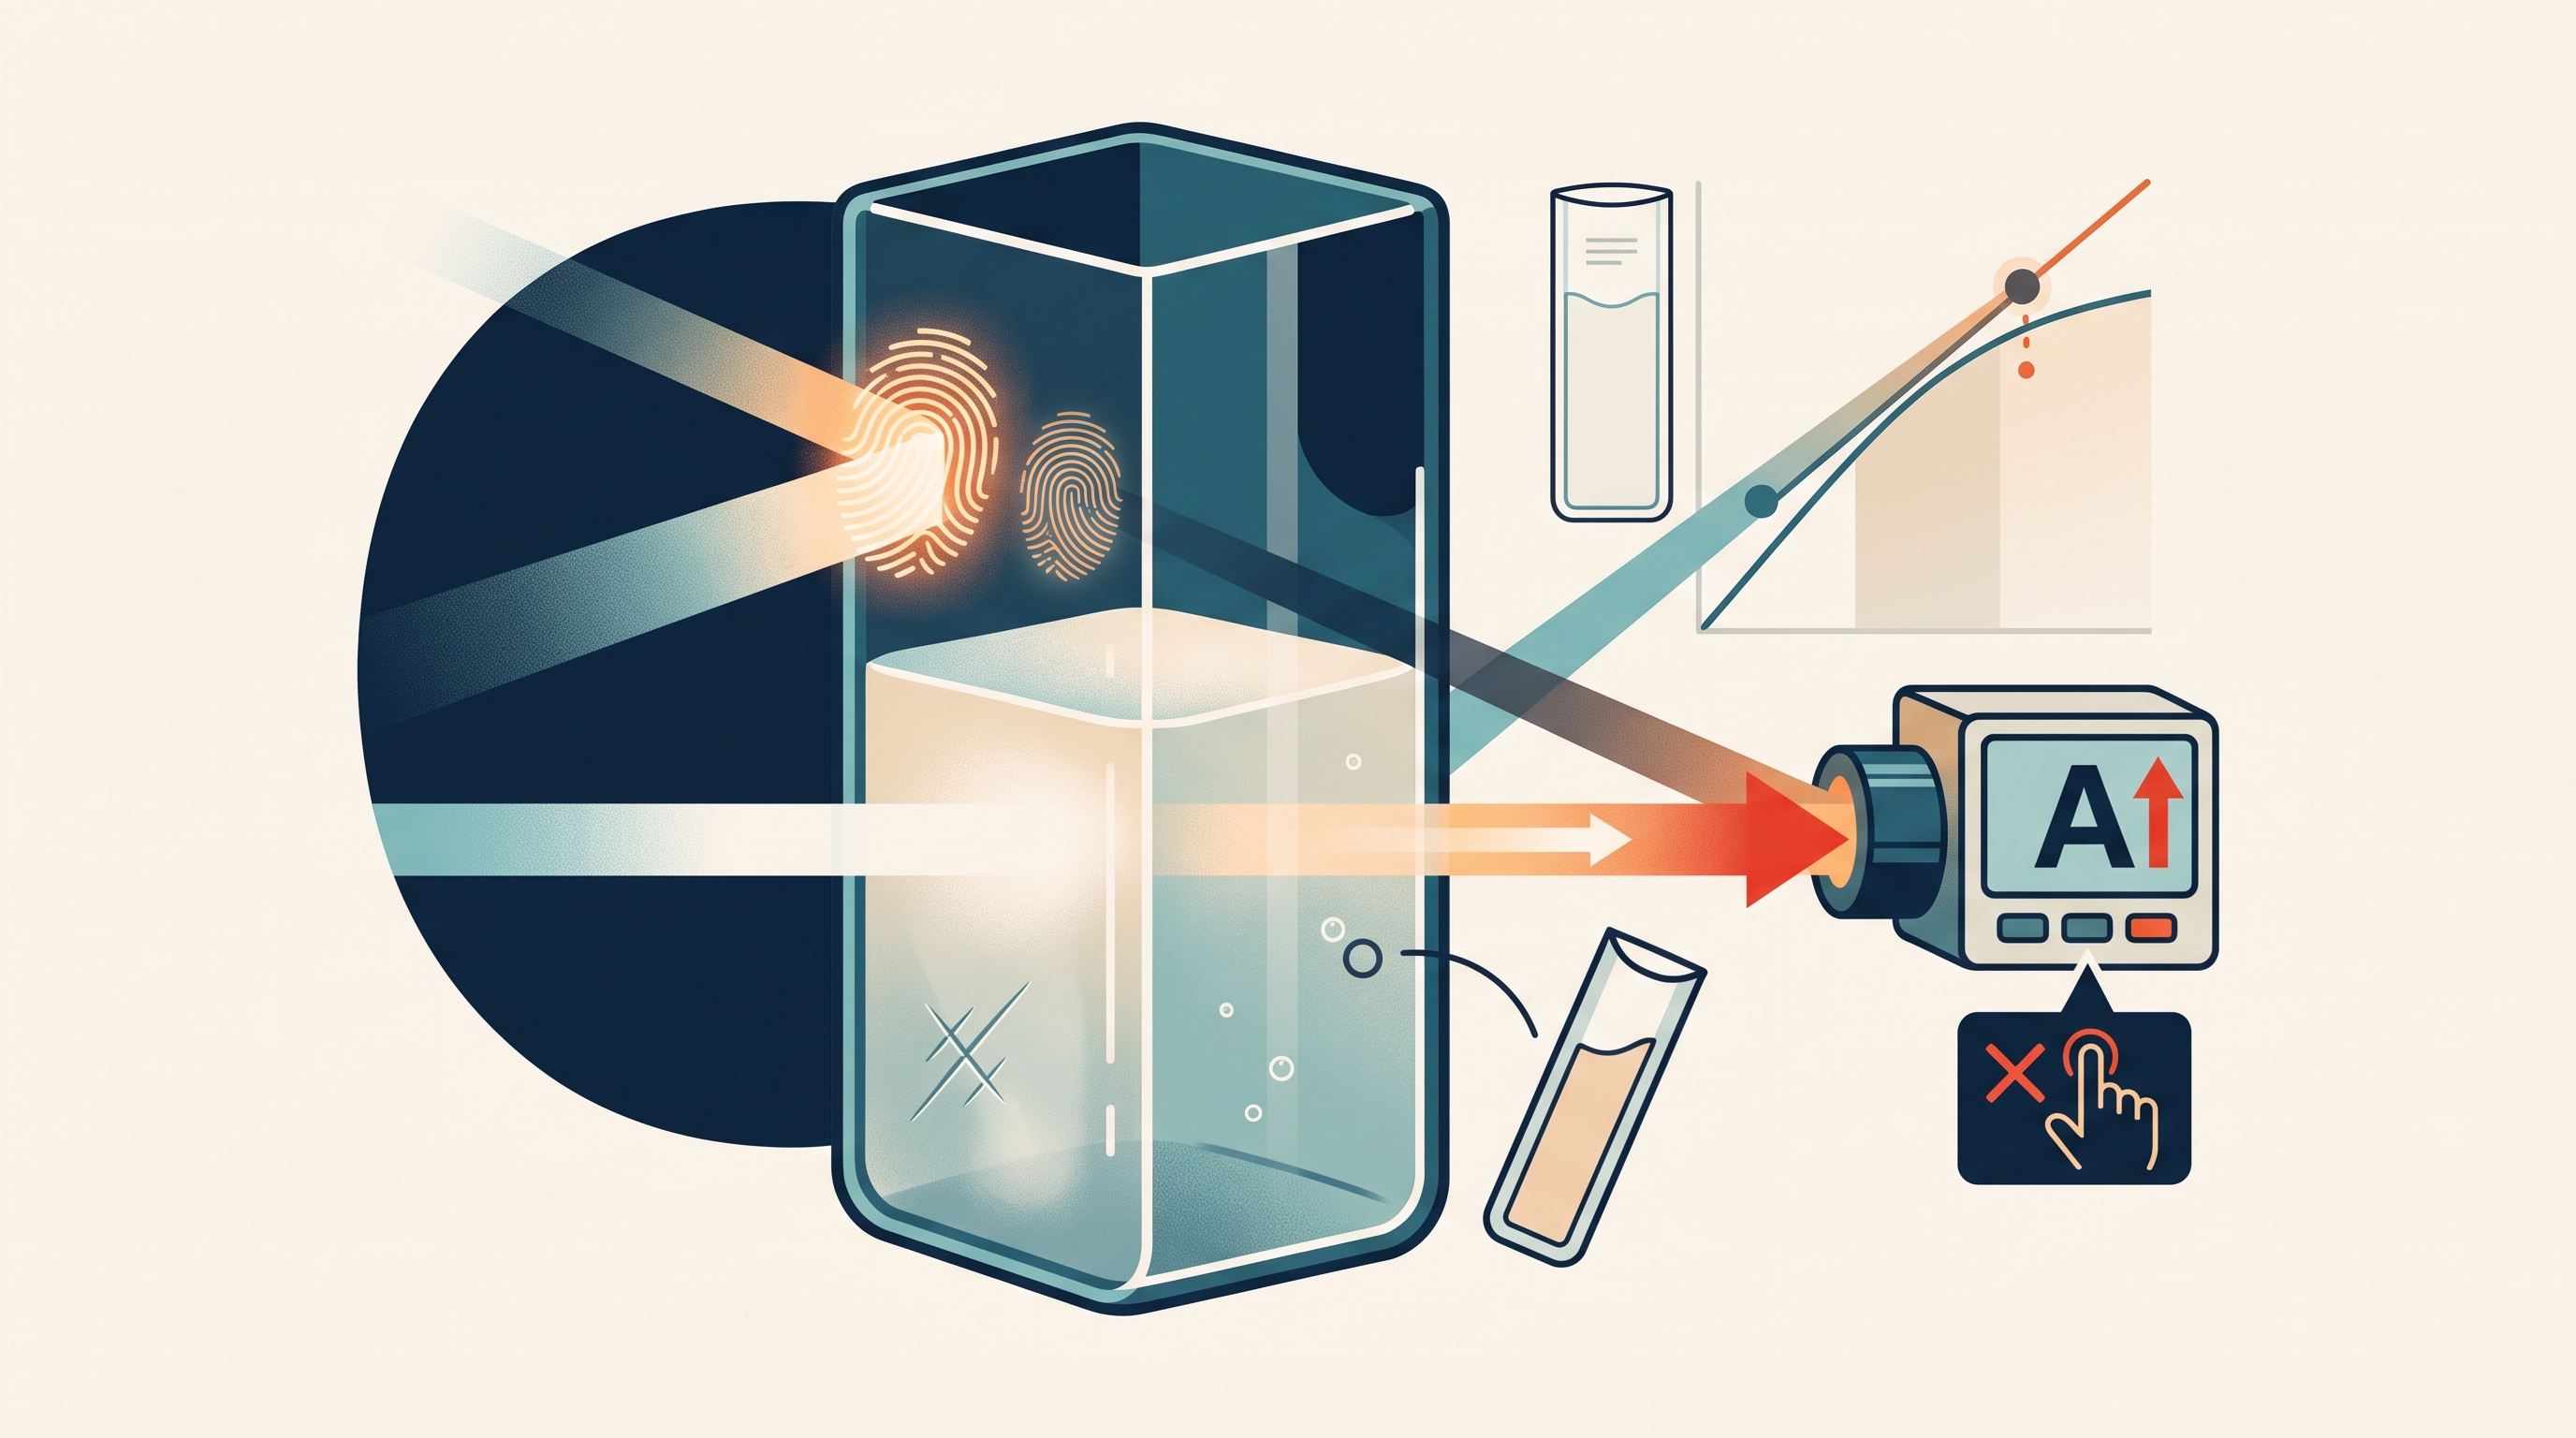
For Suggested Skill 2.E — Question and Method: Identify or describe potential sources of experimental error, consider a dirty or scratched cuvette, fingerprints blocking the light path, bubbles, an incorrect blank, an inconsistent path length, or measuring at different wavelengths. These errors can shift the calibration curve or make individual absorbance measurements unreliable. A cuvette should be clean, oriented consistently, filled without bubbles, and compared with an appropriate blank.
Retrieval check: If concentration doubles while $\varepsilon$ and $b$ remain constant, what happens to $A$? If the path length is accidentally doubled, what happens to the calculated concentration when the original path length is incorrectly used? The first absorbance doubles; the second calculation overestimates concentration by a factor of $2$.