From the free course AP Macroeconomics on Lykke
6.5 Changes in the Foreign Exchange Market and Net Exports
Key concepts: Foreign exchange market · Exchange rate · Demand for currency · Supply of currency · Equilibrium exchange rate · Currency appreciation · Currency depreciation · Exports and net exports · Aggregate demand · Foreign trade and current account
An exchange rate is the price of one currency stated in terms of another currency: for example, $0.20 per rand means that one South African rand exchanges for $0.20.
6.5 Changes in the Foreign Exchange Market and Net Exports
An exchange rate is the price of one currency stated in terms of another currency: for example, $0.20 per rand means that one South African rand exchanges for $0.20. In a flexible foreign exchange market, that price changes when the demand for or supply of a currency changes.
MKT-5.E — Currency-market mechanism: Equilibrium occurs where the quantity of a currency demanded equals the quantity supplied, determining the equilibrium exchange rate.
Reading the foreign exchange market
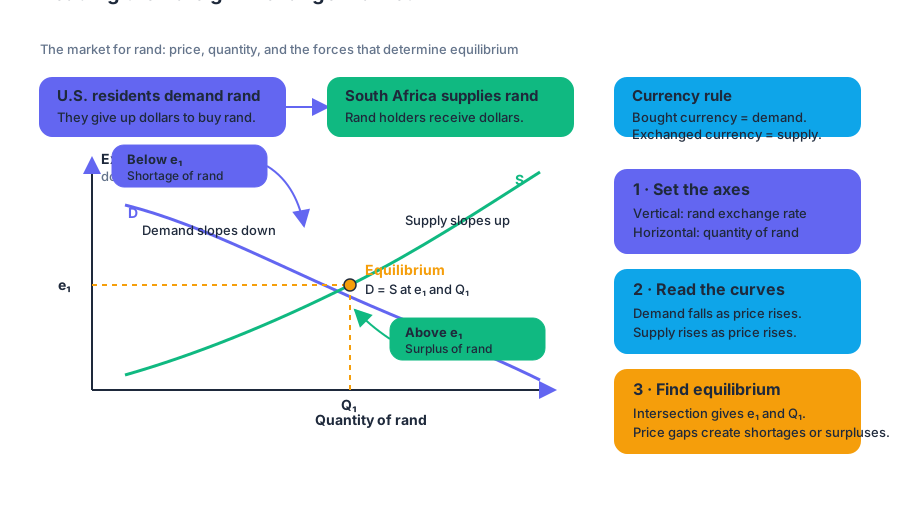
A foreign exchange market is a market in which one nation’s currency is exchanged for another. If residents of the United States demand rand, they give up dollars to obtain rand; simultaneously, South Africa supplies rand in exchange for those dollars. The currency being purchased is represented by the market’s demand curve, while the currency being exchanged away is represented by its supply curve.
For a graph of the market for rand, place the exchange rate of the rand in dollars on the vertical axis and the quantity of rand on the horizontal axis. The demand curve slopes downward: a lower dollar price makes rand less expensive to obtain. The supply curve slopes upward: a higher dollar price gives holders of rand a greater incentive to exchange them for dollars.
The intersection of demand and supply gives the equilibrium exchange rate, $e_1$, and equilibrium quantity, $Q_1$. At that point, the quantity of rand demanded equals the quantity supplied. A price above $e_1$ creates a surplus of rand; a price below $e_1$ creates a shortage.
How shifts change a currency’s value
Changes in market conditions shift a currency’s demand or supply curve. A rightward shift in demand raises both the equilibrium exchange rate and the equilibrium quantity. The currency appreciates, meaning its value increases relative to the other currency.
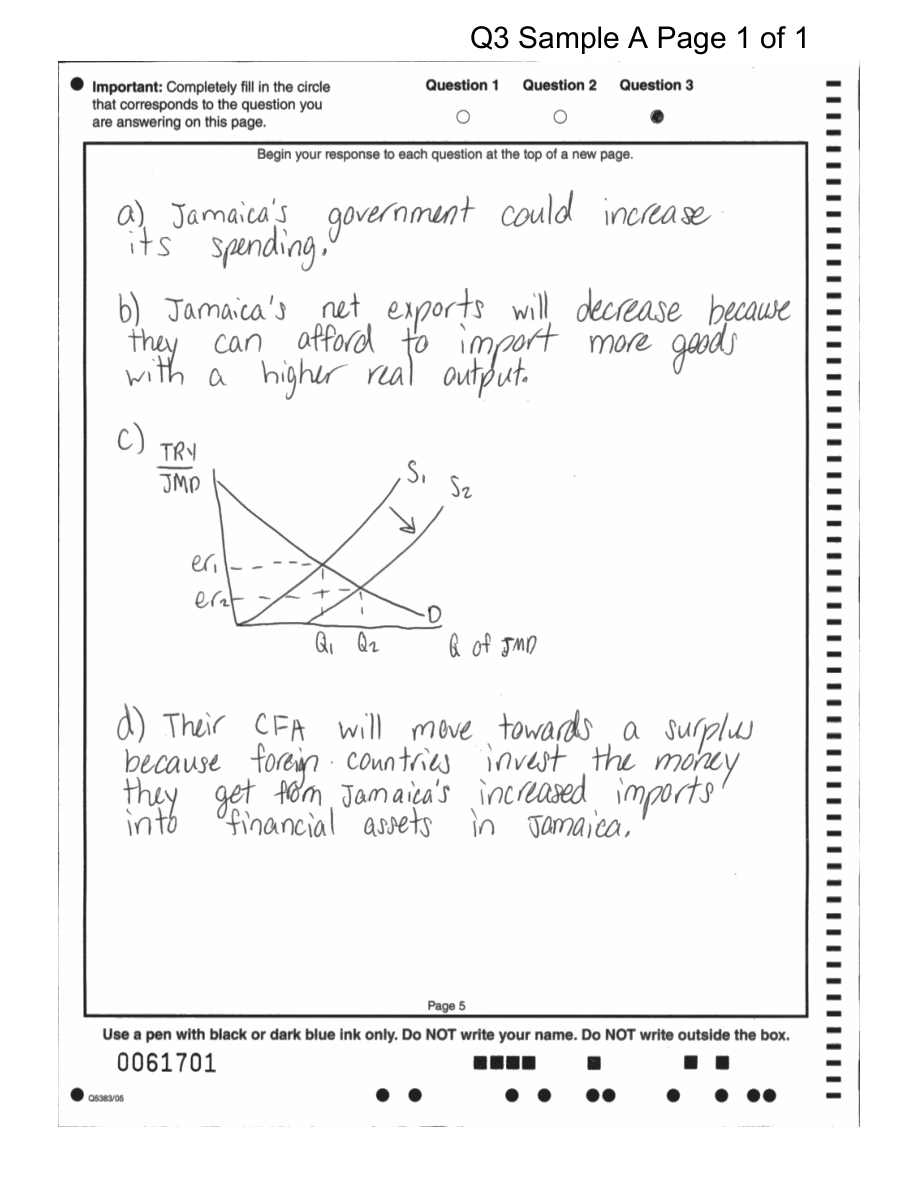
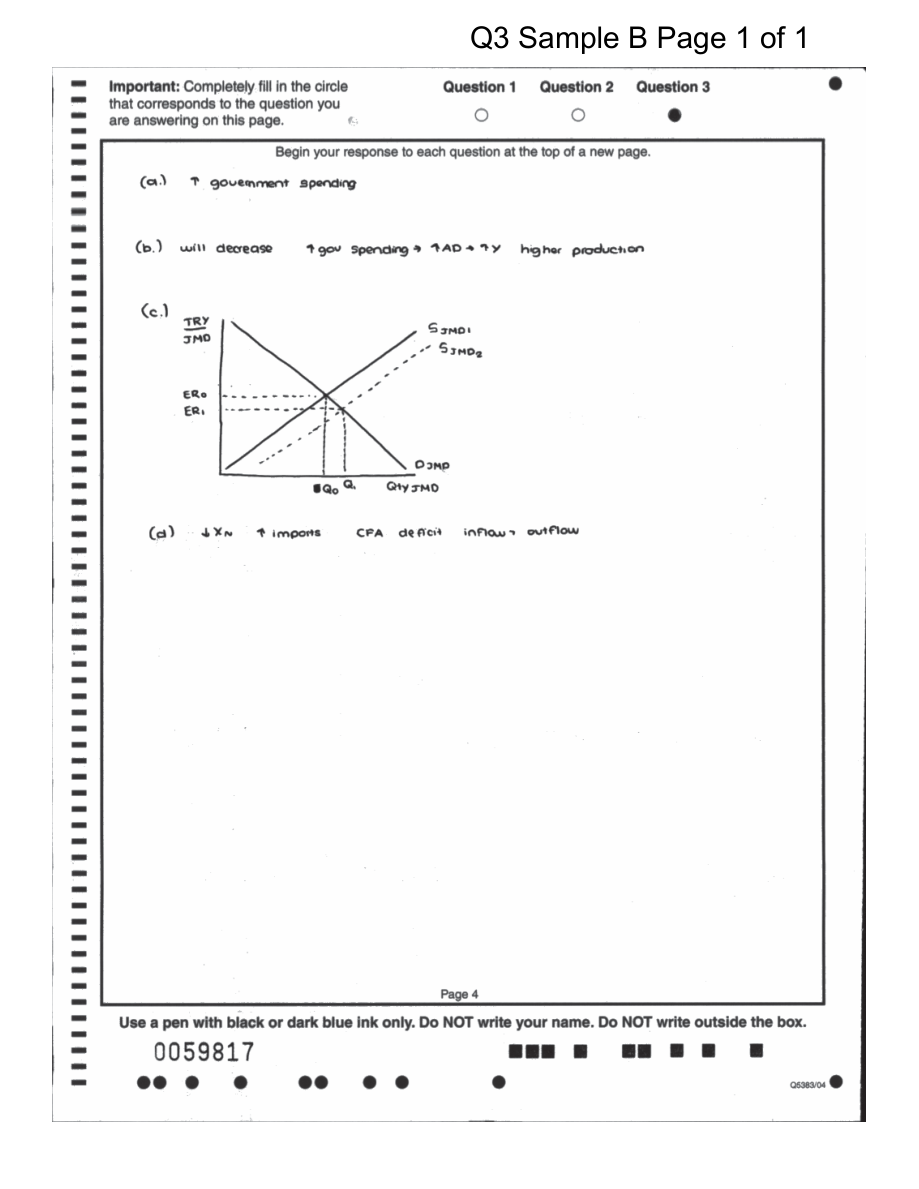
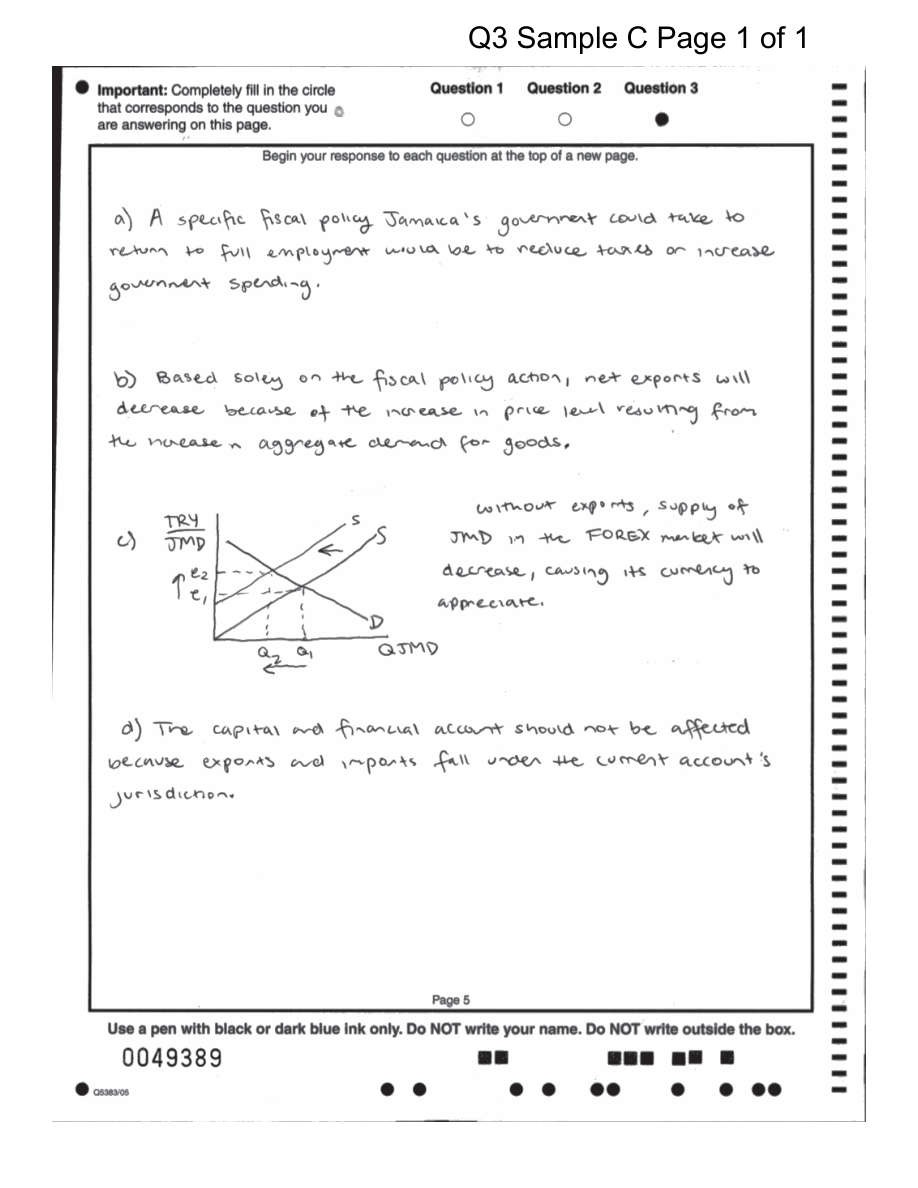
A leftward shift in supply also raises the currency’s equilibrium exchange rate but reduces the equilibrium quantity. For example, if fewer rand enter the foreign exchange market because South Africa exports fewer goods, the supply of rand shifts left. The rand appreciates: each rand now buys more dollars.
Graphing rule: To show appreciation of the currency on the vertical axis, move the equilibrium exchange rate upward from $e_1$ to $e_2$. To show depreciation, move it downward. Always label both original and new curves, equilibria, exchange rates, and quantities.
A currency depreciation is the opposite change: the currency loses relative value. A rightward supply shift or a leftward demand shift lowers its equilibrium exchange rate. In a correctly labeled graph, the new equilibrium exchange rate is below the original one.
Exchange rates and net exports
A country’s net exports are its exports minus its imports:
$$NX = X - M$$
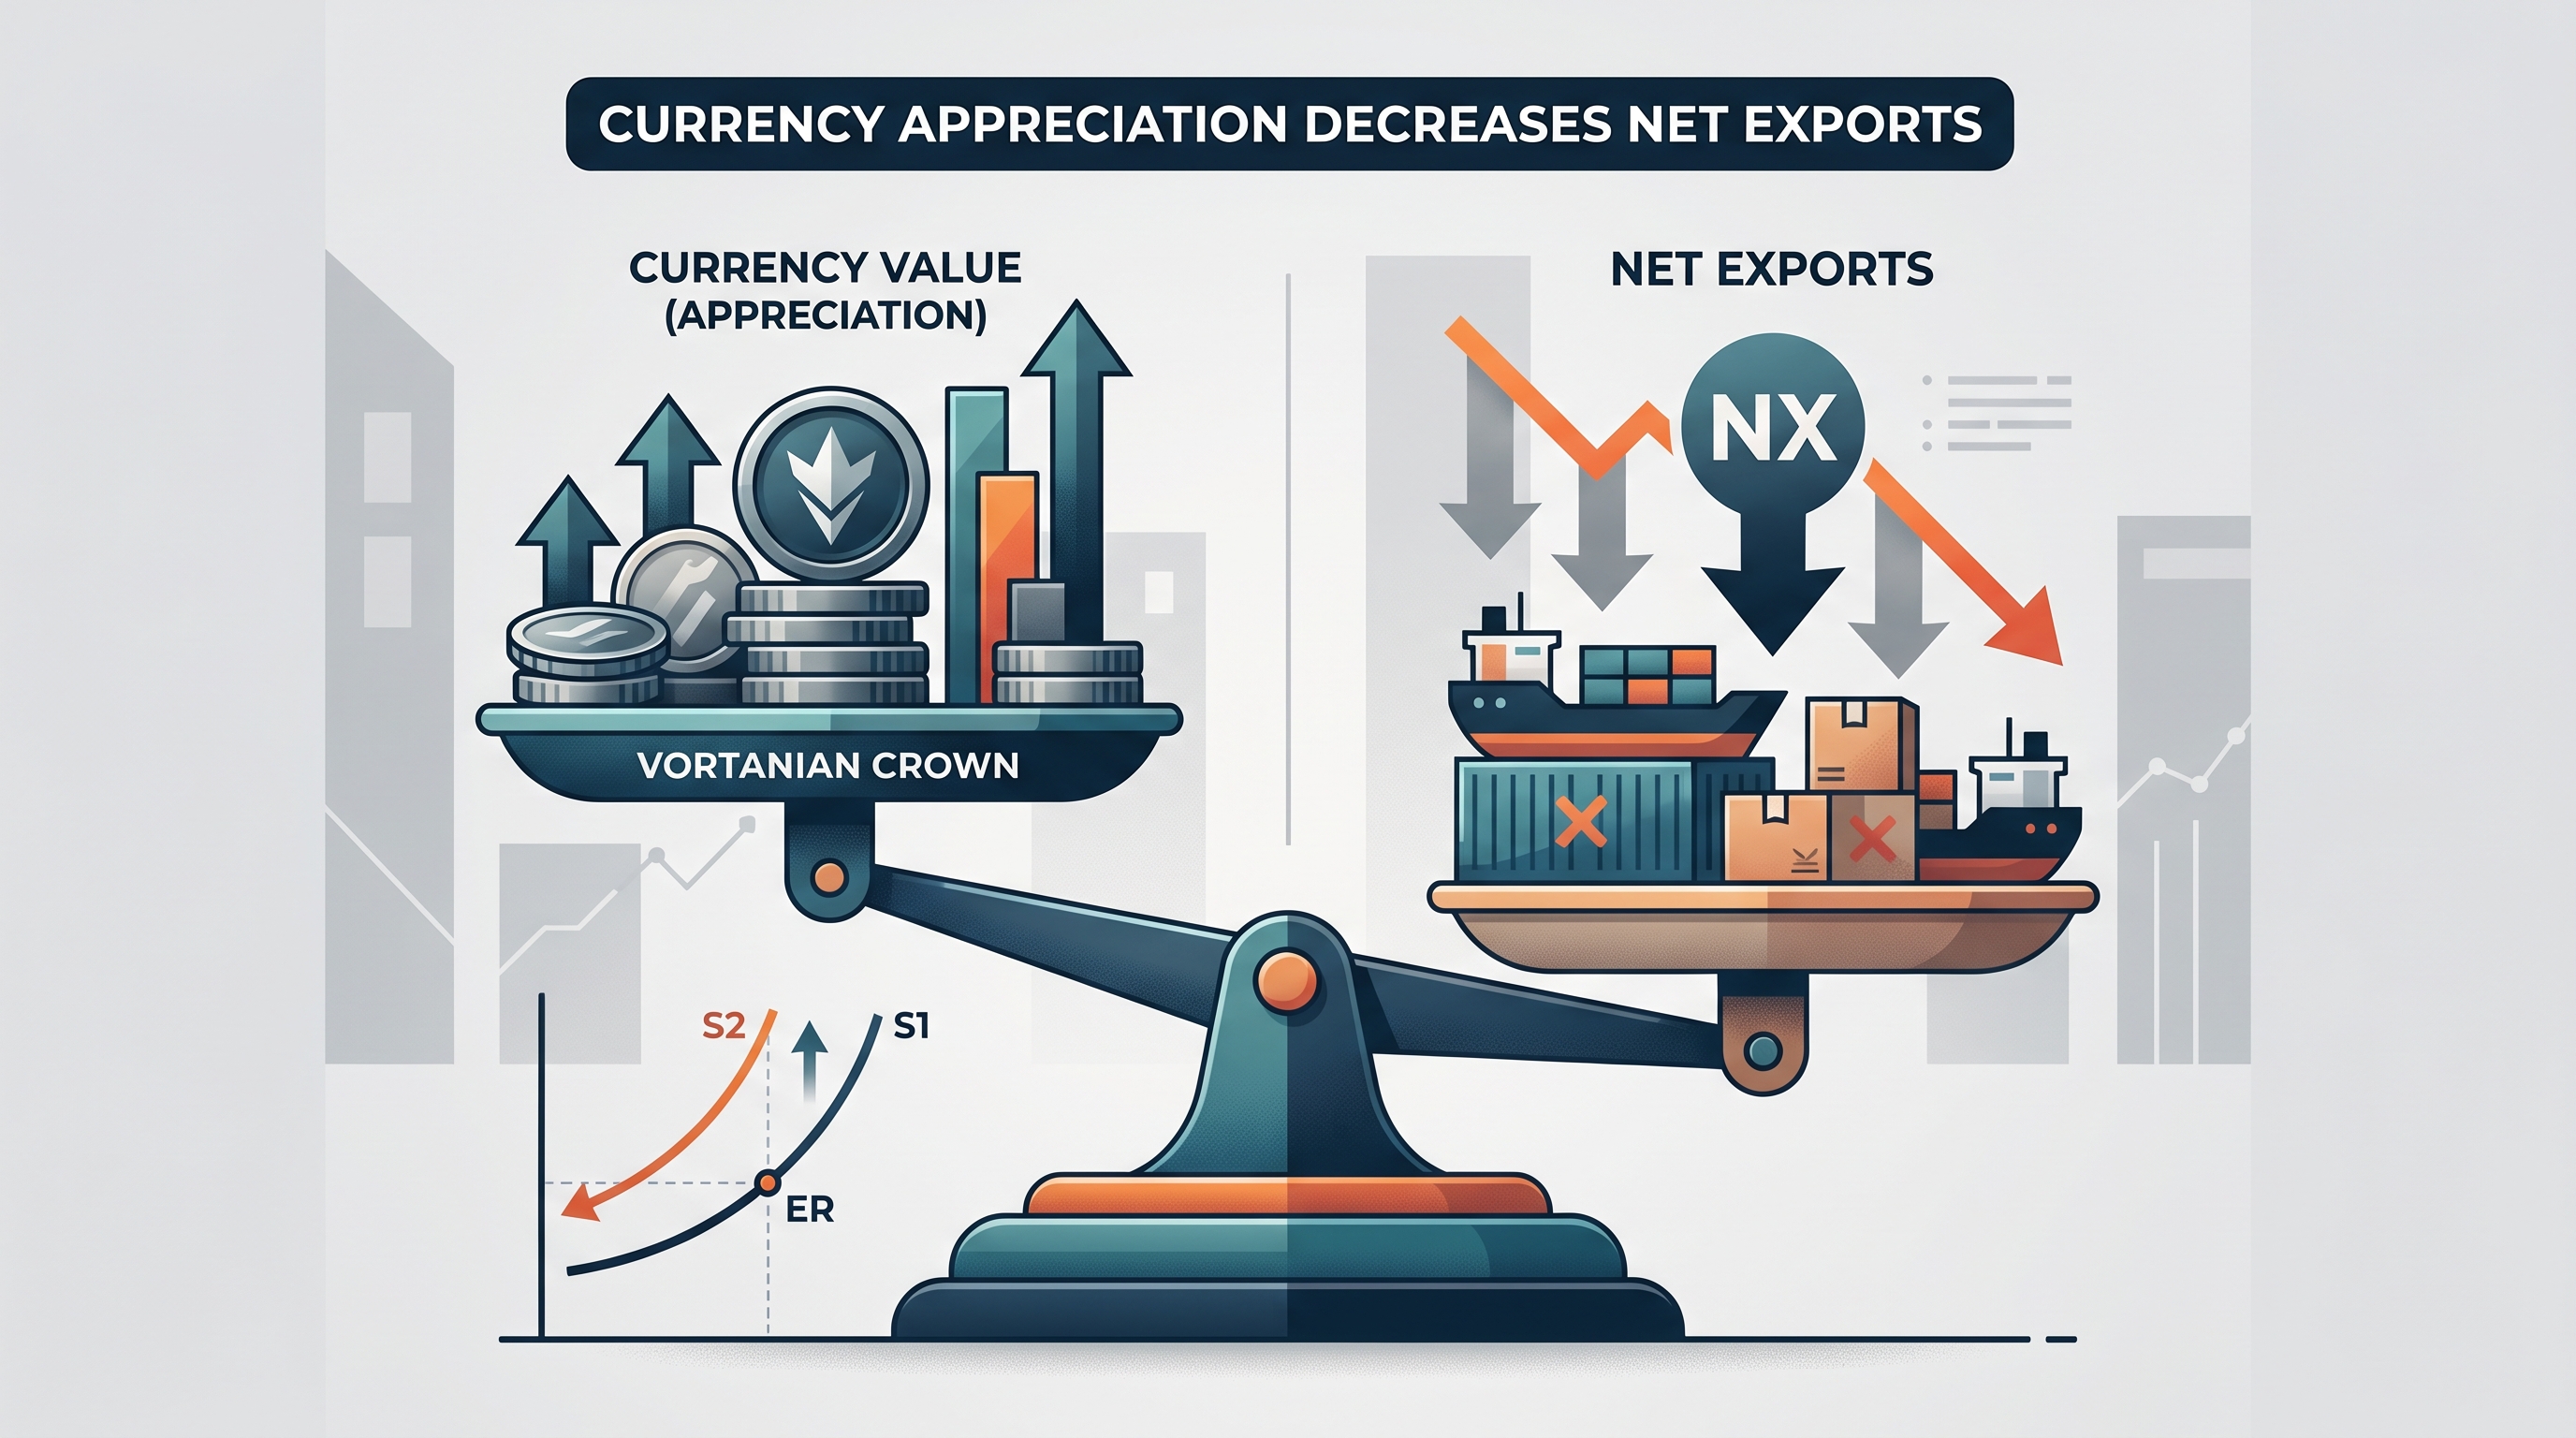
When a country’s currency appreciates, its goods become more expensive to foreign buyers, so exports tend to decrease. At the same time, foreign goods become less expensive to domestic buyers, so imports tend to increase. Therefore, an appreciation decreases net exports.
When a country’s currency depreciates, domestic goods become less expensive to foreigners and imported goods become more expensive to domestic residents. Exports tend to rise, imports tend to fall, and net exports increase.
MKT-5.F — Net exports and aggregate demand: Because net exports are a component of aggregate demand,
$$AD = C + I + G + NX$$
an increase in net exports shifts aggregate demand right, while a decrease in net exports shifts aggregate demand left.
Worked example: an appreciating rand
Suppose the equilibrium exchange rate initially is $0.20 per rand. Stronger foreign demand for South African products increases demand for rand, shifting the rand-demand curve right. The new exchange rate rises to $0.25 per rand: the rand has appreciated.
At $0.25 per rand, a South African product priced at $100 costs a foreign buyer:
$$\frac{$100}{$0.25\text{ per rand}} = 400\text{ rand}$$
Before appreciation, the same product cost:
$$\frac{$100}{$0.20\text{ per rand}} = 500\text{ rand}$$
The product is now cheaper in rand terms, but from the perspective of a foreign buyer using dollars, South African goods require more dollars per rand. More generally, the appreciation makes domestic goods relatively more expensive to foreigners and imports relatively cheaper to domestic residents. The expected result is lower exports, higher imports, lower net exports, and a leftward shift of aggregate demand.
Common misconception check
Misconception: “A stronger currency always improves the trade balance.” A higher currency value makes imported goods cheaper, but it also makes the country’s exports more expensive to foreigners. In the standard AP macroeconomic model, appreciation decreases net exports; depreciation increases net exports.
Retrieval check: In the market for the Vortanian crown, the supply curve shifts left. What happens to the equilibrium exchange rate, the value of the crown, and Vortania’s net exports?
Answer: The equilibrium exchange rate rises, so the crown appreciates. Vortanian exports become relatively more expensive and imports relatively cheaper, causing net exports to decrease. Net exports are recorded in the current account of foreign-trade accounting; detailed financial-capital flows belong with the separate analysis of international capital movements.
Source Materials
- AP Macroeconomics Course and Exam Description
- AP Macroeconomics Course and Exam Description Clarifications and Corrections
- AP Macroeconomics Course Overview
- AP Macroeconomics Course at a Glance
- AP Macroeconomics Course at a Glance Poster
- AP Macroeconomics
- AP Macroeconomics
- AP Macroeconomics Sample Syllabus 1
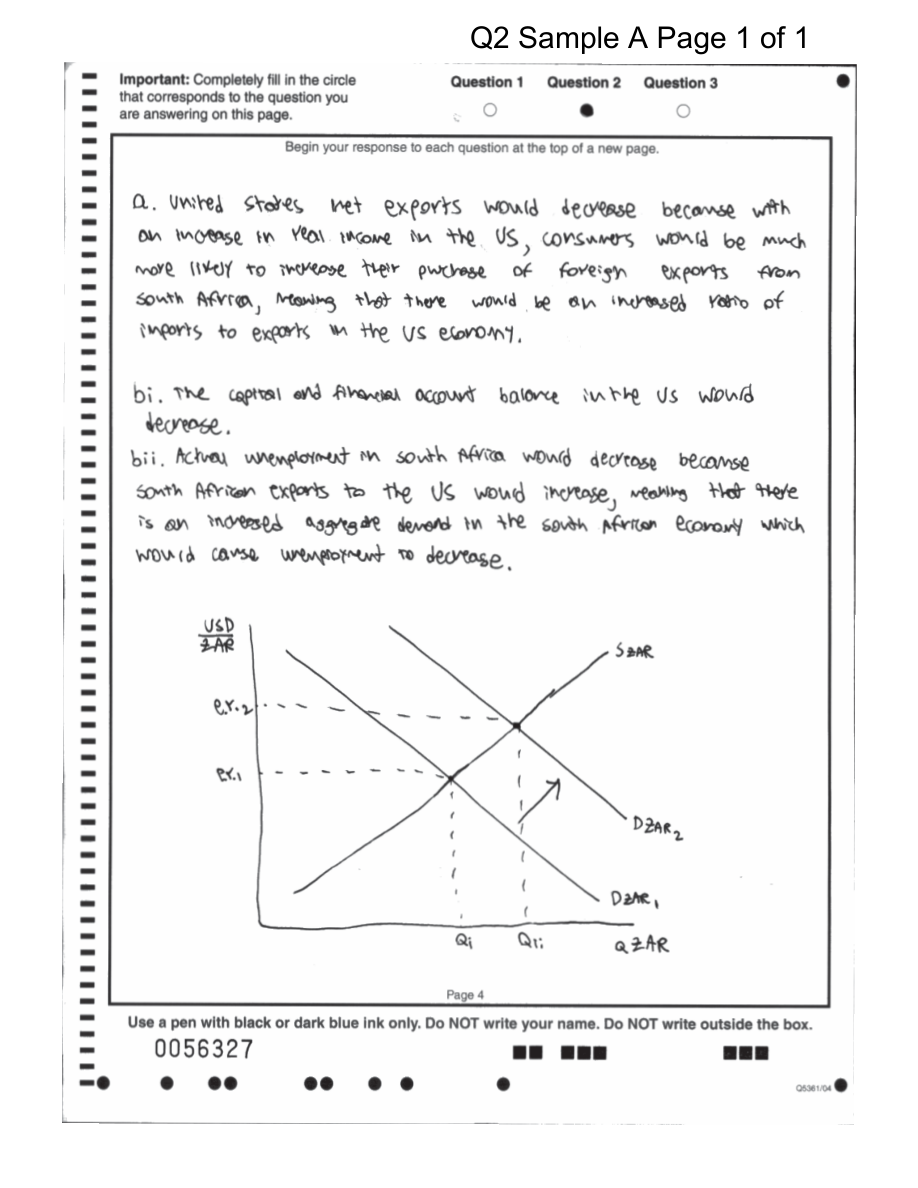
- Figure — Sample Responses Q2 - Set 2 (p. 3)
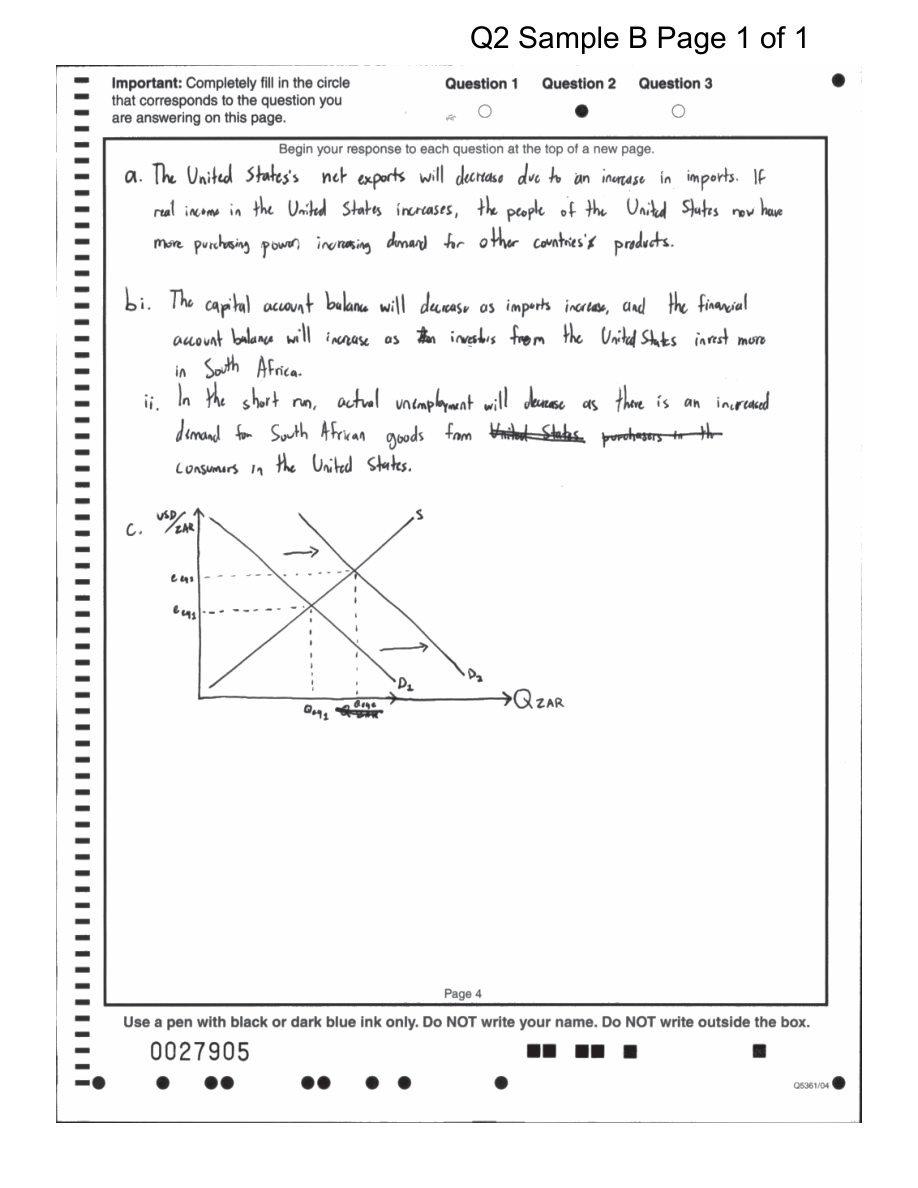
- Figure — Sample Responses Q2 - Set 2 (p. 4)
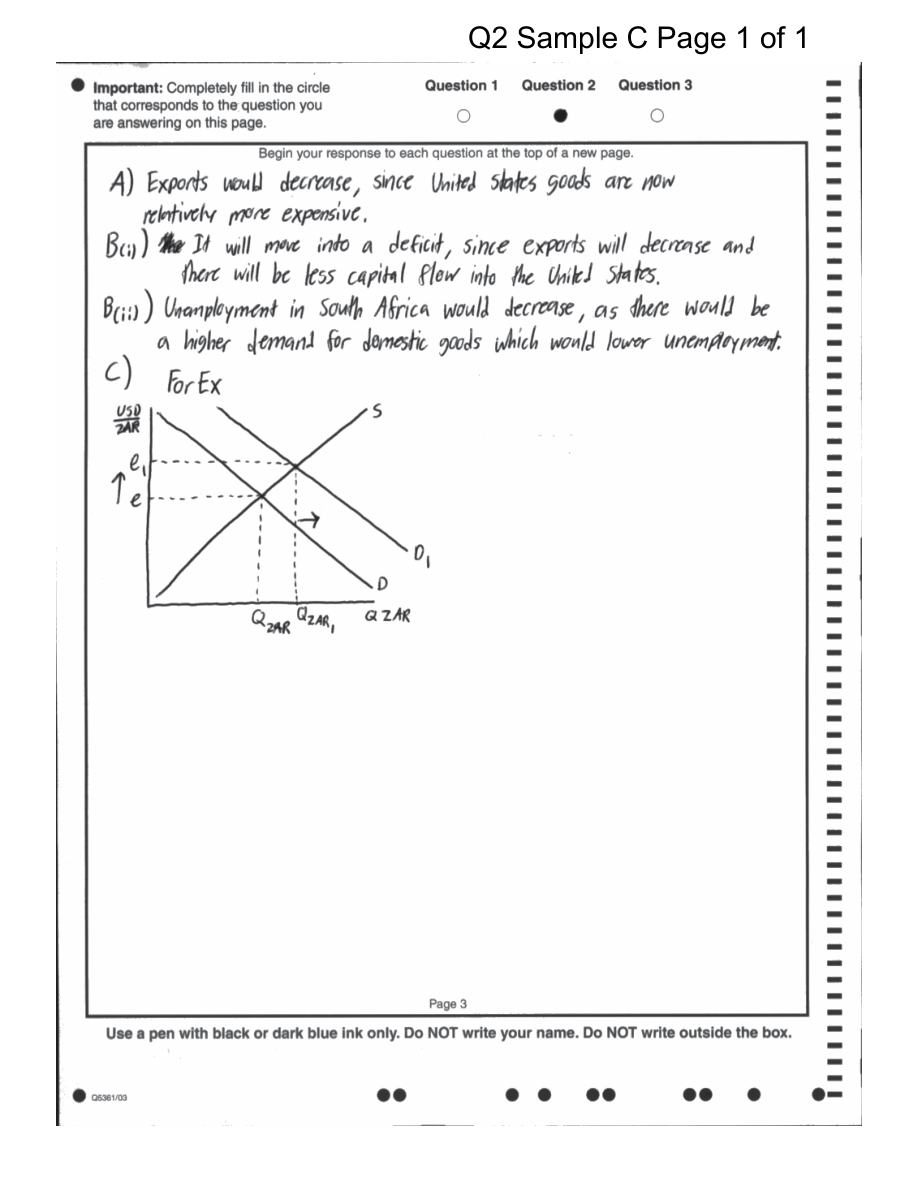
- Figure — Sample Responses Q2 - Set 2 (p. 5)
- Figure — Sample Responses Q3 - Set 2 (p. 3)