From the free course AP Macroeconomics on Lykke
5.5 Crowding Out
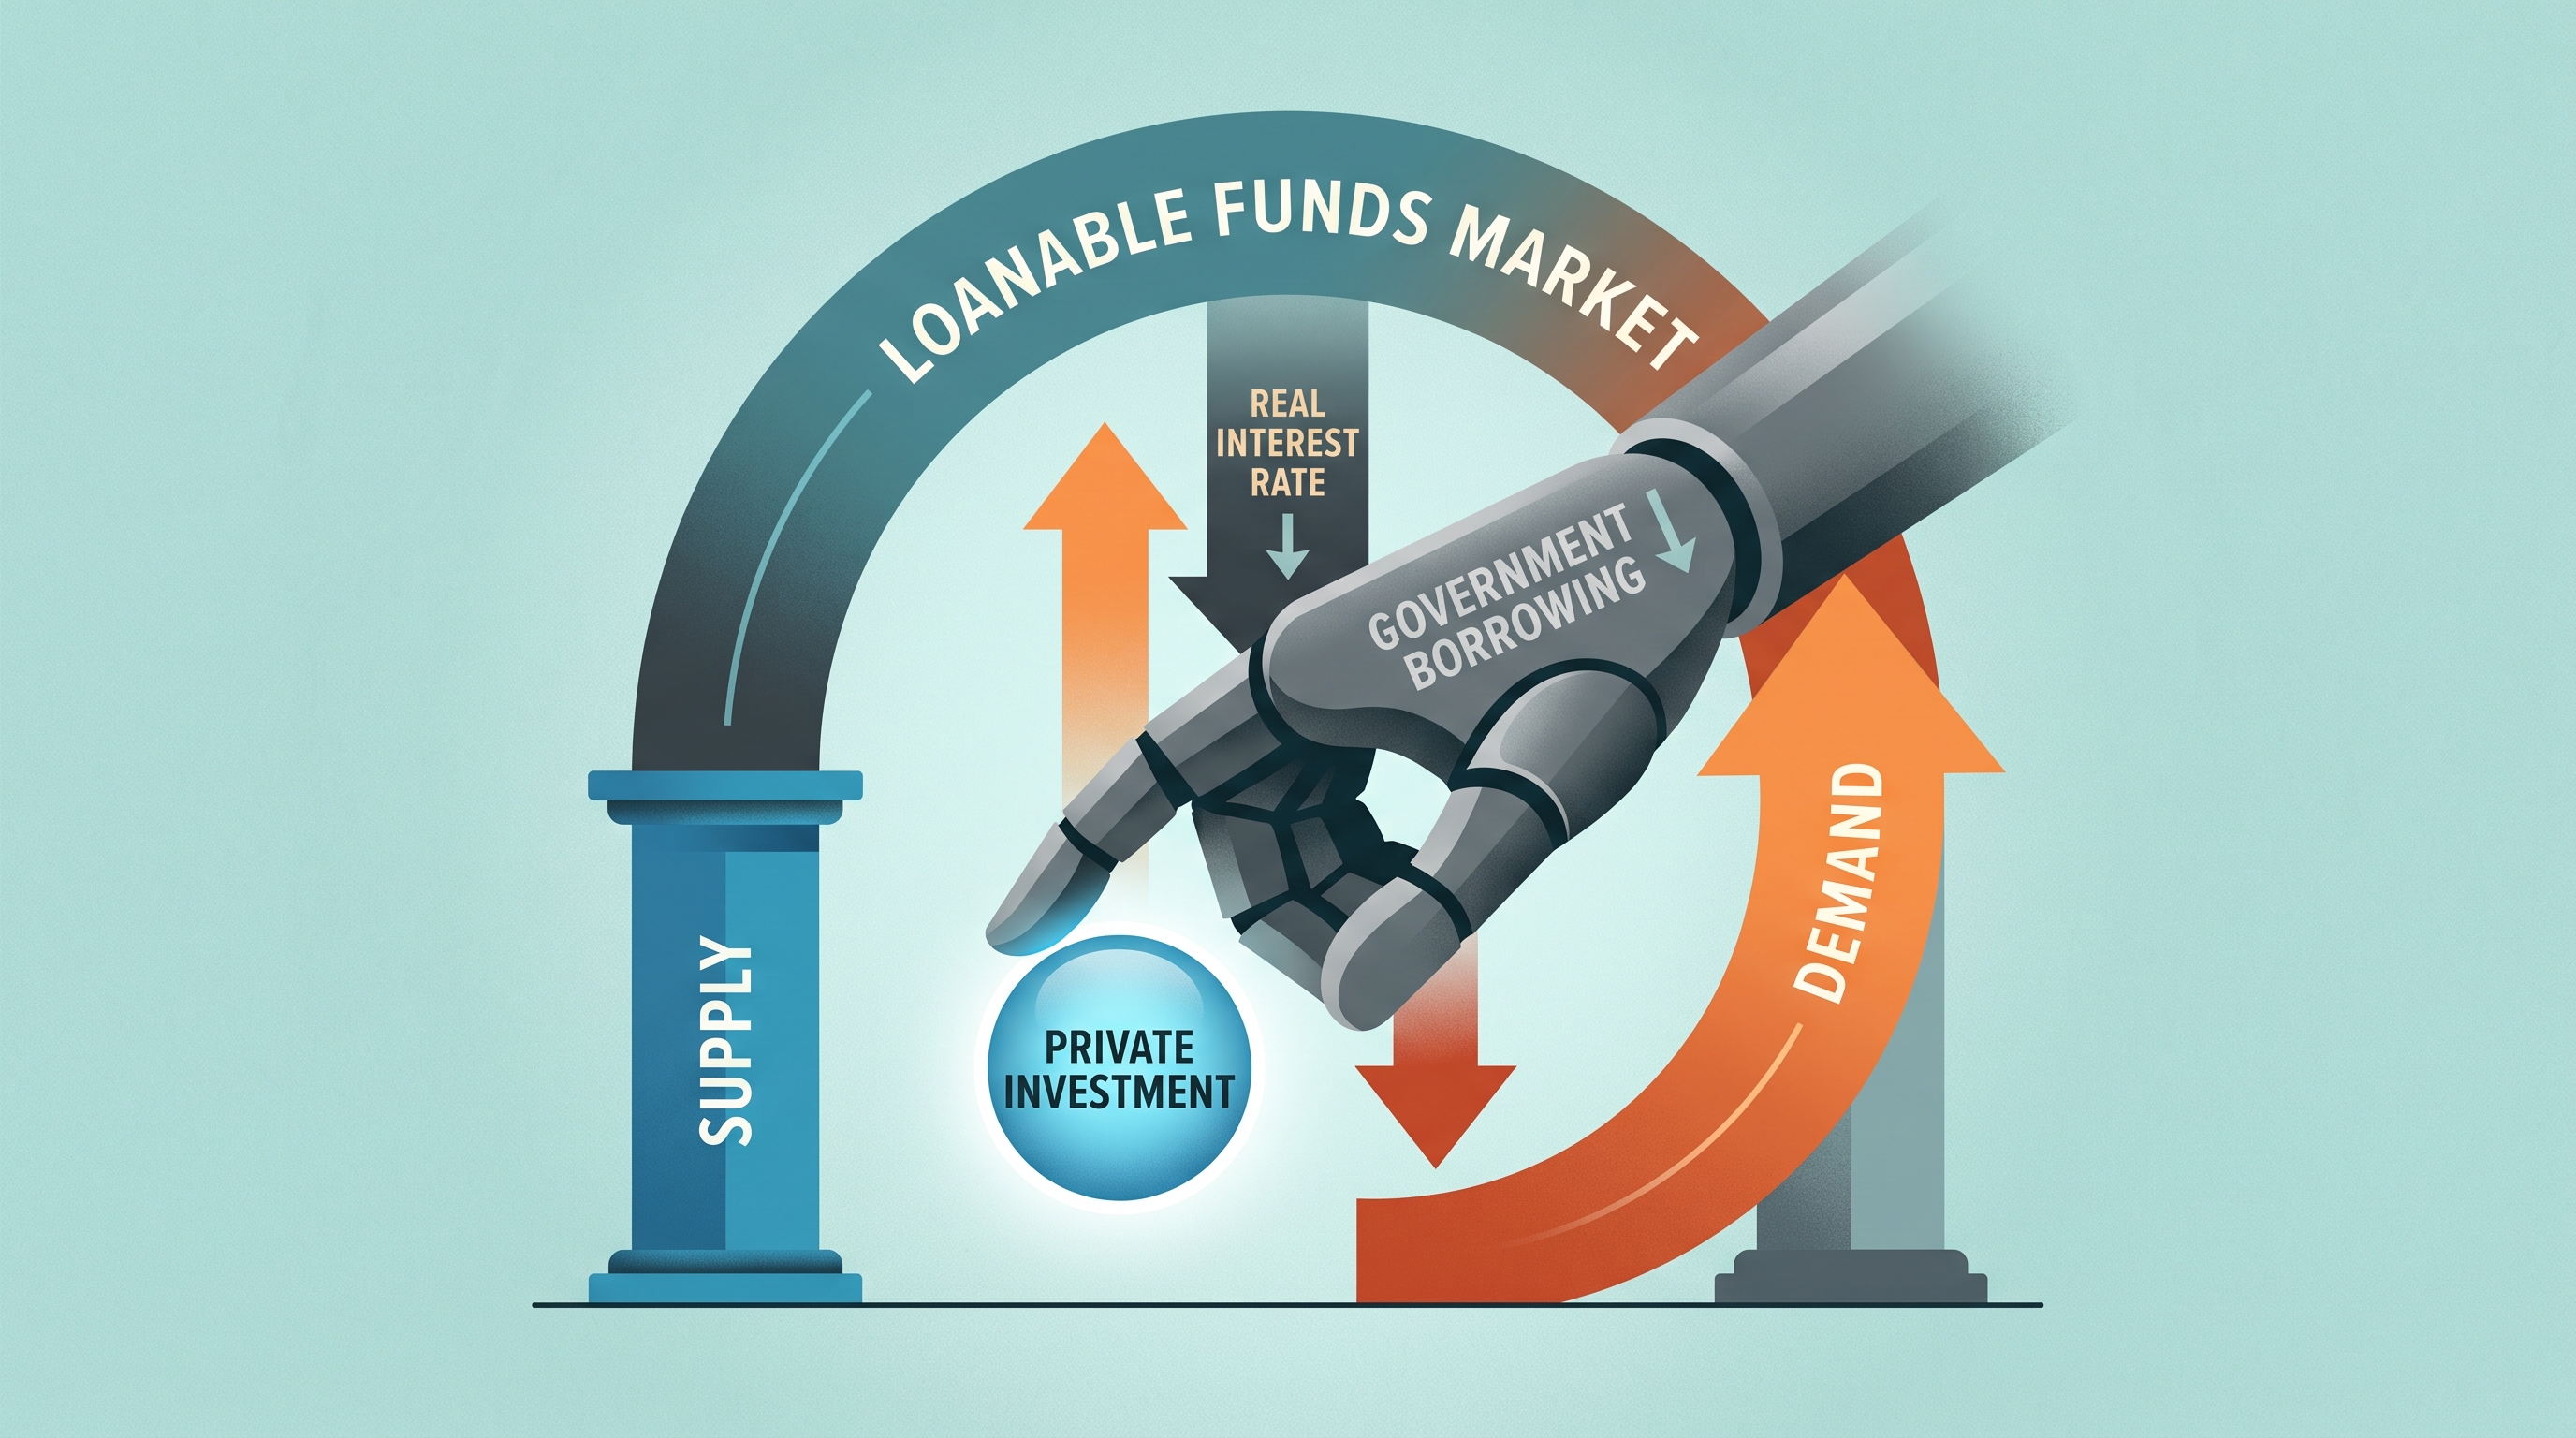
When the government finances a budget deficit by selling bonds, its additional borrowing increases demand for loanable funds. If the supply of saving does not increase enough to match that demand, the real interest rate rises and some private investment is displaced—a process called crowding out.
Crowding out is the reduction in private investment caused by higher real interest rates when government borrowing increases demand in the loanable-funds market.
The loanable-funds mechanism
The loanable-funds market connects savers who supply funds with borrowers who demand funds. The market’s price is the real interest rate, because borrowers and lenders care about the purchasing power of repayment rather than merely the number of dollars repaid.
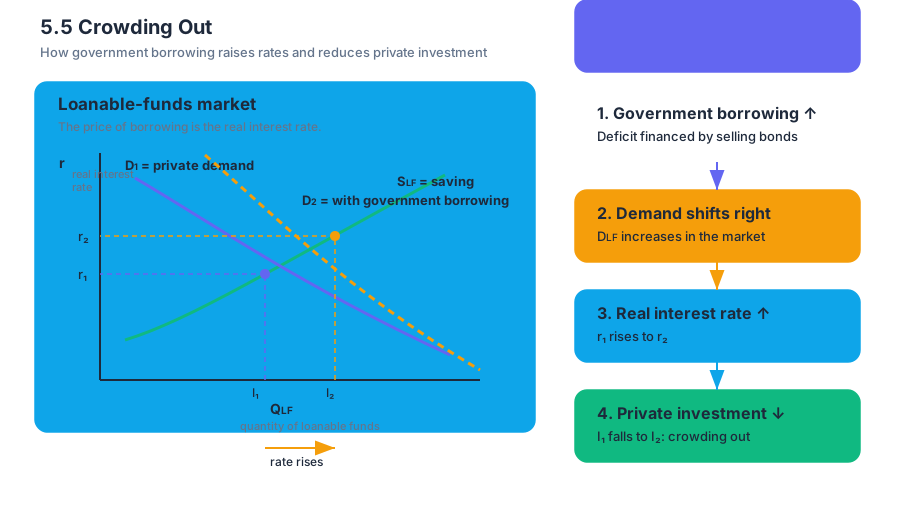
In the standard graph, the vertical axis measures the real interest rate, $r$, and the horizontal axis measures the quantity of loanable funds, $Q_{LF}$. The supply curve represents saving; the demand curve represents borrowing for private investment and government deficits.
When the government finances that gap by selling bonds, its additional borrowing shifts the demand for loanable funds to the right. The equilibrium real interest rate rises from $r_1$ to $r_2$. At the higher interest rate, private firms borrow less for factories, equipment, research, or new buildings, so private investment falls from $I_1$ to $I_2$.
$$ \text{Government borrowing} \uparrow ;\Rightarrow; D_{LF} \text{ shifts right} ;\Rightarrow; r \uparrow ;\Rightarrow; \text{private investment} \downarrow $$
Worked example: tracing the displacement
Suppose the initial loanable-funds equilibrium has a real interest rate of $3%$. Firms plan to borrow $500$ billion for private investment, while households and other institutions supply that amount through saving. The government then borrows an additional $100$ billion by selling bonds.
The government’s borrowing shifts the demand curve rightward. Assume the new equilibrium real interest rate is $5%$. At $5%$, firms now find only $450$ billion of investment projects profitable enough to undertake.
The outcome is:
$$ \Delta I = I_2-I_1 $$
$$ \Delta I = $450\text{ billion}-$500\text{ billion} = -$50\text{ billion} $$
Private investment has fallen by $50$ billion. That $50$ billion is the amount of crowding out in this example—not the entire $100$ billion borrowed by the government. Government borrowing increased total demand for loanable funds, but the higher real interest rate prevented some private borrowers from obtaining funds on acceptable terms.
Why crowding out matters for aggregate demand
In the short run, expansionary fiscal policy can increase aggregate demand because higher government spending raises one component of planned expenditure. However, if the resulting government borrowing raises real interest rates, lower private investment offsets part of that increase.
$$ AD = C + I + G + NX $$
If $G$ rises while $I$ falls, aggregate demand still may increase, but by less than it would have increased without crowding out. This is why crowding out reduces the size of fiscal policy’s effect rather than automatically reversing it.
Crowding out can be stronger when the supply of loanable funds is relatively unresponsive to the interest rate. It can be weaker when households save more, foreign lenders supply funds, or the economy has substantial unused saving capacity.
Common misconception: “All government borrowing crowds out investment completely”
Correction: Crowding out is usually partial in the basic model. Government borrowing raises the real interest rate and reduces private investment, but it does not necessarily reduce private investment dollar-for-dollar. The final effect depends on the slopes and positions of the loanable-funds curves.
A second misconception is that a higher nominal interest rate proves crowding out. The loanable-funds model focuses on the real interest rate:
$$ r \approx i-\pi^e $$
where $i$ is the nominal interest rate and $\pi^e$ is expected inflation. A change in the nominal rate does not by itself establish that borrowing has become more expensive in real terms.
AP reasoning and graphing
This topic directly exercises Skill Category 3: Manipulation, especially 3.A, applying economic models to determine how a change shifts a curve or changes an equilibrium. On a loanable-funds graph, a strong response identifies the rightward shift of demand, the higher equilibrium real interest rate, and the lower quantity of private investment.
It also uses 3.B, explaining an economic chain in words and symbols: government borrowing increases demand for loanable funds; the real interest rate rises; private investment decreases. A complete graph must label the axes, identify the original and new equilibrium, show the demand shift, and mark the change in the real interest rate.
Retrieval check
A government begins borrowing more while the supply of loanable funds remains unchanged. Predict the effects on the loanable-funds graph and private investment.
Answer: Demand for loanable funds shifts right, the equilibrium real interest rate rises, and private investment falls. The fall in private investment is crowding out.
Source Materials
- AP Macroeconomics Course and Exam Description
- AP Macroeconomics Course and Exam Description Clarifications and Corrections
- AP Macroeconomics Course Overview
- AP Macroeconomics Course at a Glance
- AP Macroeconomics Course at a Glance Poster
- AP Macroeconomics
- AP Macroeconomics
- AP Macroeconomics Sample Syllabus 1