From the free course AP Macroeconomics on Lykke
1.2 Opportunity Cost and the Production Possibilities Curve (PPC)
Key concepts: Scarcity and choice · Opportunity cost · Production possibilities curve (PPC) · Efficiency and underutilized resources · Economic growth and contraction · PPC shifts · Opportunity-cost patterns and PPC shape · Full and efficient use of resources
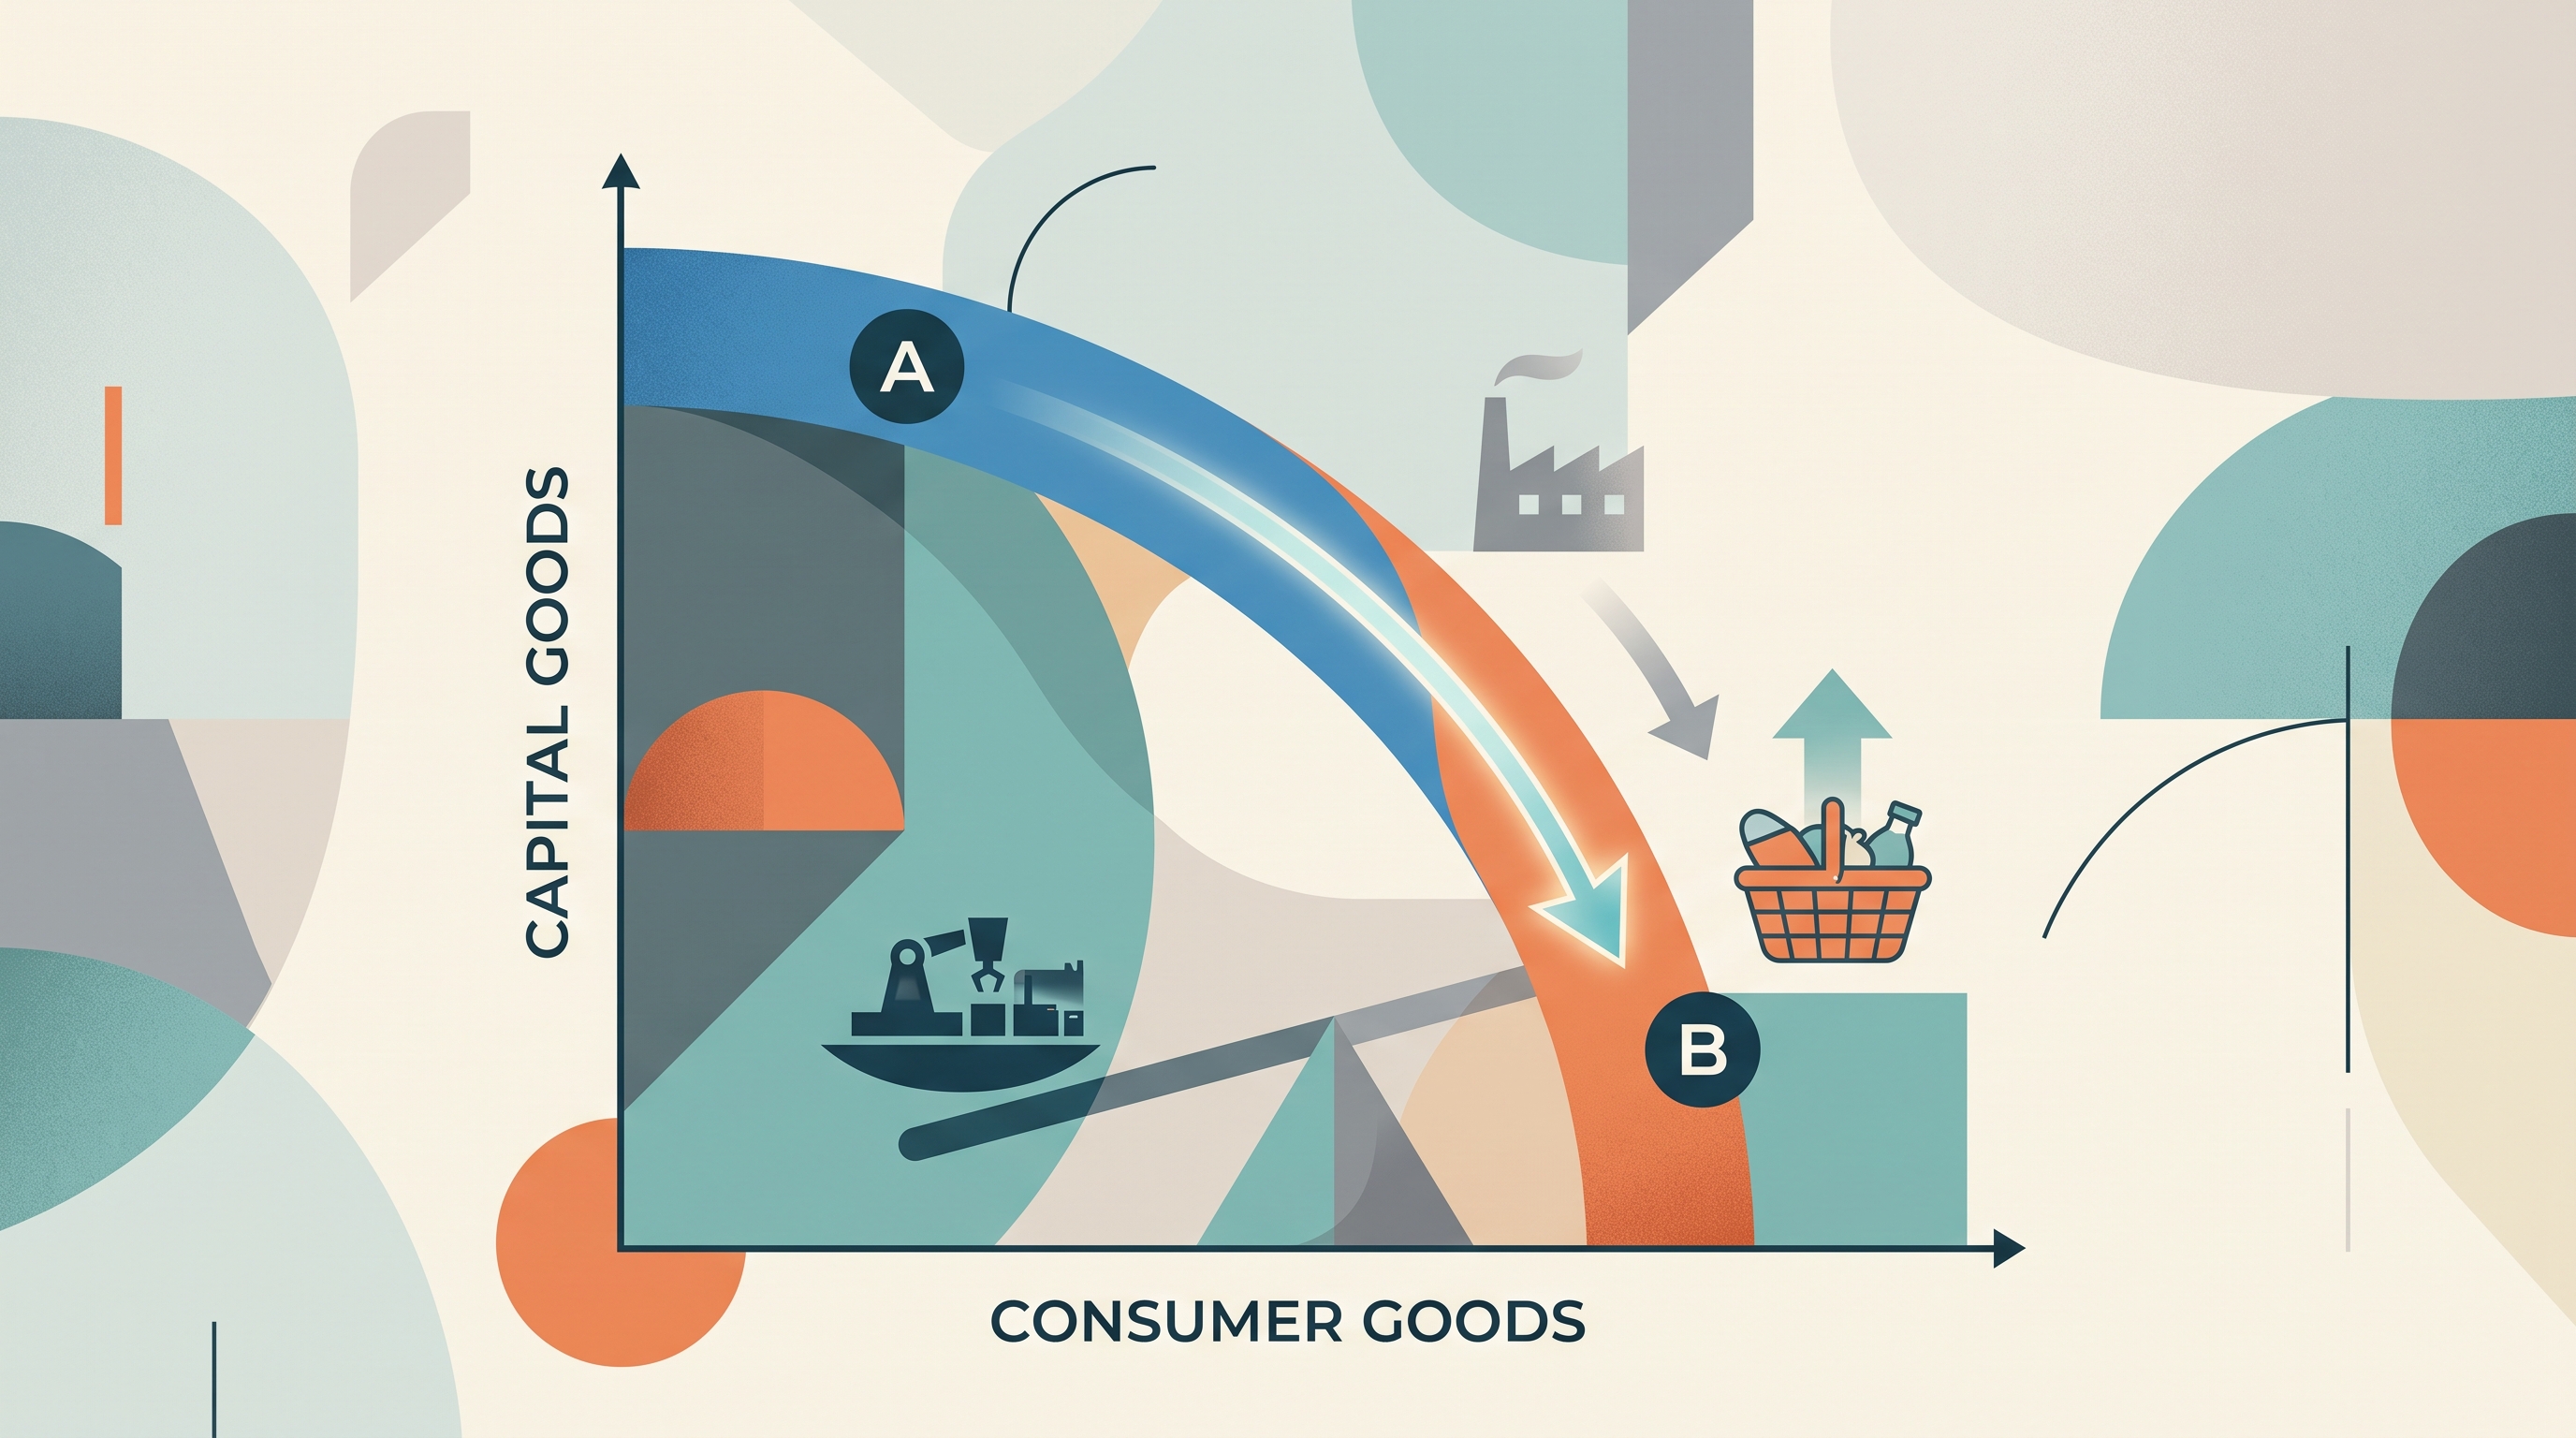
A production possibilities curve (PPC) shows the maximum combinations of two goods or activities that an economy can produce with its available resources and technology.
1.2 Opportunity Cost and the Production Possibilities Curve (PPC)
A production possibilities curve (PPC) shows the maximum combinations of two goods or activities that an economy can produce with its available resources and technology. Its central question is simple: If more of one activity is chosen, what must be given up?
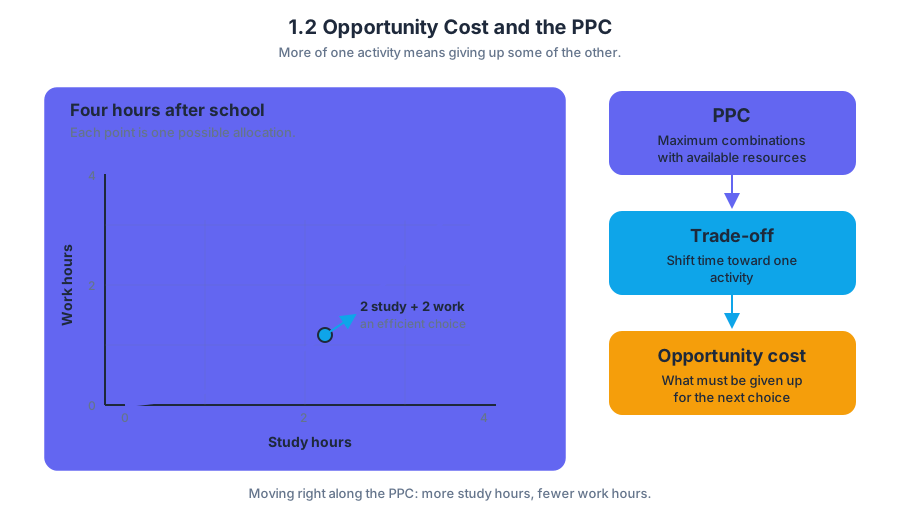
Imagine that you have four hours after school and must divide them between studying and working at a café. Every hour shifted toward one activity is an hour unavailable for the other. The PPC turns that everyday trade-off into a graph: one axis measures study hours, the other measures work hours, and each point represents one possible allocation.
Reading a PPC: trade-offs, efficiency, and feasibility
The PPC model demonstrates the trade-offs associated with allocating scarce resources. A trade-off is the act of giving up one option to obtain another. Opportunity cost is the value of the next-best alternative forgone; on a PPC, it is the amount of one good sacrificed to produce more of the other.
A point on the curve represents productive efficiency: resources are being used fully and appropriately given current technology. A point inside the curve is feasible but inefficient because some resources are unemployed, underutilized, or poorly allocated. A point outside the curve is unattainable with the economy’s current resources and technology.
Scenario check: An economy’s PPC connects a maximum of $40$ medical devices and $0$ tons of food with a maximum of $0$ medical devices and $100$ tons of food. Classify a combination of $20$ medical devices and $50$ tons of food if it lies below the curve, a combination lying exactly on the curve, and a combination above the curve. The first is feasible but inefficient, the second is productively efficient, and the third is currently unattainable—not automatically “better.”
Worked example: calculating opportunity cost
Suppose four hours can be allocated between studying and working. The available combinations are:
| Study hours | Work hours |
|---|---|
| $0$ | $4$ |
| $1$ | $3$ |
| $2$ | $2$ |
| $3$ | $1$ |
| $4$ | $0$ |
Moving from $1$ hour of studying to $2$ hours increases study time by $1$ hour but reduces work time from $3$ hours to $2$ hours. Therefore, the opportunity cost of that additional hour of studying is $1$ hour of work. Moving from $0$ to $4$ study hours gives up all $4$ work hours, so the total opportunity cost of $4$ study hours is $4$ work hours.
If every additional study hour always costs exactly $1$ work hour, the PPC is a straight line and opportunity cost is constant. If the work sacrificed rises as more study is produced, the PPC is bowed outward and opportunity cost is increasing. If the sacrificed work falls as more study is produced, opportunity cost is decreasing, producing a bowed-inward curve.
Movements along the curve versus shifts
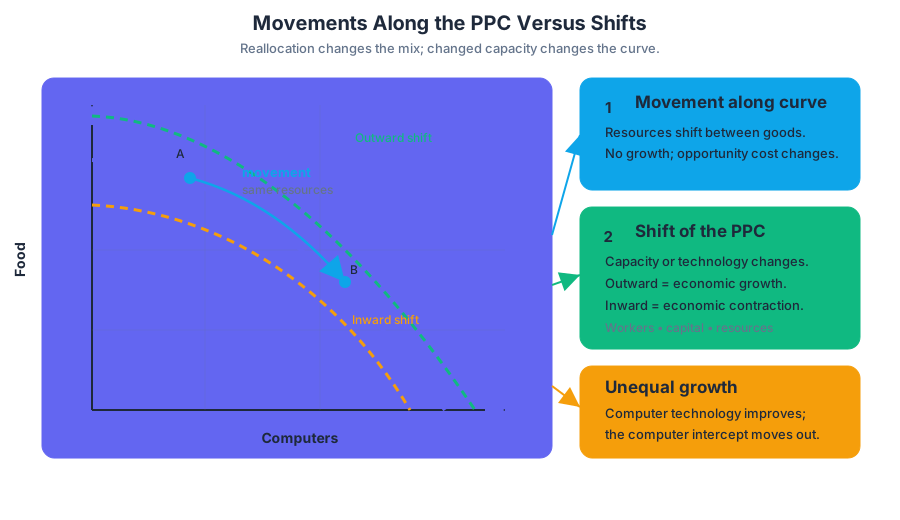
A movement along a PPC occurs when resources are reallocated between the two goods while the economy’s resources and technology remain unchanged. It does not represent economic growth; it represents a different efficient combination and therefore a different opportunity cost.
A shift changes the economy’s production possibilities. More workers, additional capital, improved natural resources, or better productivity and technology can shift the PPC outward. An outward shift represents economic growth, because more of at least one good—and usually more of both—can be produced. Destruction of factories, loss of workers, reduced resources, or technological damage can shift the PPC inward and represent economic contraction.
Growth need not expand both axes equally. A technological improvement used only to produce computers may move the computer intercept outward while leaving the maximum possible food output unchanged. The correct graph therefore depends on which resource or technology changed.
Misconception check
Misconception: “Every point inside the PPC is impossible.” It is the opposite: an interior point is attainable, but it does not use available resources efficiently. Misconception: “A point outside the PPC proves the economy is inefficient.” An outside point cannot currently be produced; inefficiency is shown by an attainable point inside the curve. Misconception: “More of one good means the PPC shifted.” More production caused by reallocating existing resources is a movement along the curve; a shift requires changed resources, technology, or productivity.
AP traceability in action
The required work appears in Learning Objective MOD-1.B.a, “Define (using graphs as appropriate) the PPC and related terms,” MOD-1.B.b, which asks students to explain how the PPC illustrates opportunity costs, trade-offs, inefficiency, efficiency, and economic growth or contraction, and MOD-1.B.c, which asks students to calculate opportunity cost using PPC or table data. These objectives are grounded in MOD-1.B.1 through MOD-1.B.5: trade-offs, the PPC’s applications, its shape, its shifts, and outward movement from economic growth.
The associated skill is Skill Category 4: Graphing and Visuals, especially 4.A, “Draw an accurately labeled graph or visual.” On an exam, label both axes, identify the curve, mark relevant points, and show a shift with a new curve rather than an arrow alone. For calculations, write the change in the sacrificed good over the change in the chosen good: $\text{opportunity cost}=\frac{\Delta\text{good forgone}}{\Delta\text{good gained}}$.
Retrieval check
A country moves from one point on an unchanged PPC to another point with more consumer goods and fewer capital goods. Is this a shift or a movement, and what happens to the opportunity cost of the consumer goods? Answer: It is a movement along the PPC; calculate the capital goods forgone per additional consumer good to determine the opportunity cost. A shift would require a change in resources, technology, or productivity.

Source Materials
- AP Macroeconomics Course and Exam Description
- AP Macroeconomics Course and Exam Description Clarifications and Corrections
- AP Macroeconomics Course Overview
- AP Macroeconomics Course at a Glance
- AP Macroeconomics Course at a Glance Poster
- AP Macroeconomics
- AP Macroeconomics
- AP Macroeconomics Sample Syllabus 1
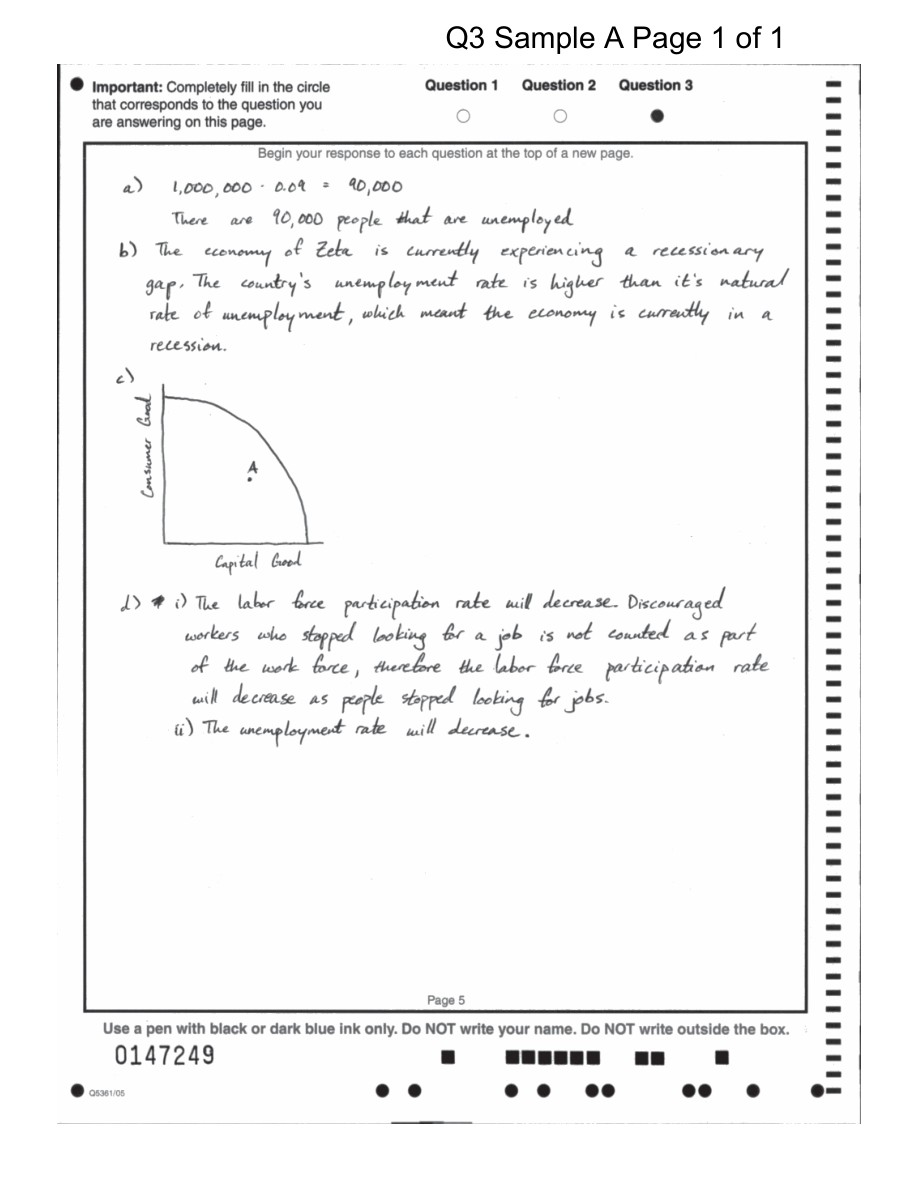
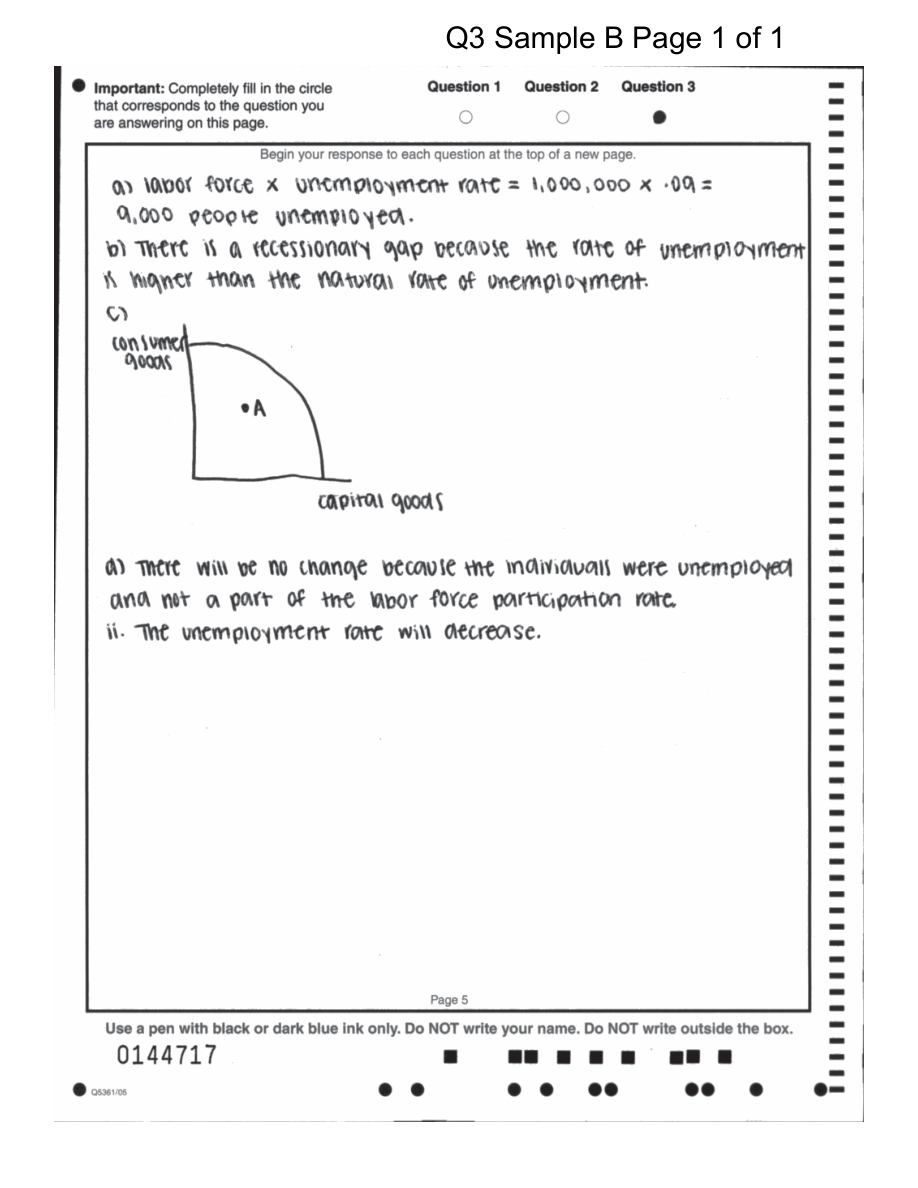
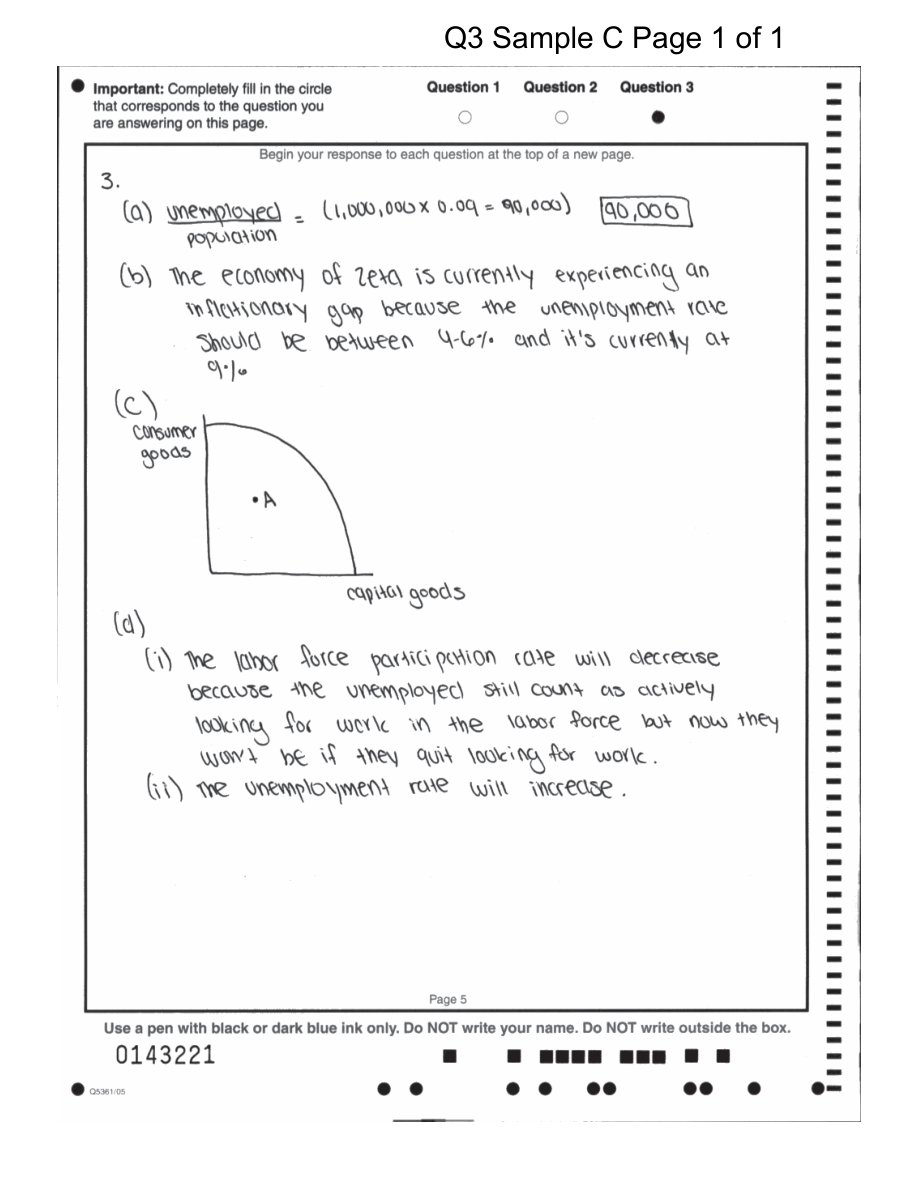
- Figure — Sample Responses Q3 - Set 1 (p. 3)
- Figure — Sample Responses Q3 - Set 1 (p. 4)
- Figure — Sample Responses Q3 - Set 1 (p. 5)
- Figure — Chief Reader Report – Set 1 (p. 1)