From the free course AP Macroeconomics on Lykke
5.6 Economic Growth
Economic growth is an increase in an economy’s ability to produce goods and services over time. The key question is not merely whether a country produces more dollars of output, but whether it can produce more real output per person without mistaking higher prices for greater production.
CED alignment: Topic 5.6 Economic Growth; Learning Objective 5.6.A Explain how economic growth is measured; Learning Objective 5.6.B Explain the determinants of economic growth; Big Idea MEA: Economic Measurements; Skill Category 1: Principles and Models, 2: Interpretation, 3: Manipulation, and 4: Graphing and Visuals.
Measuring growth: real output, not inflated prices
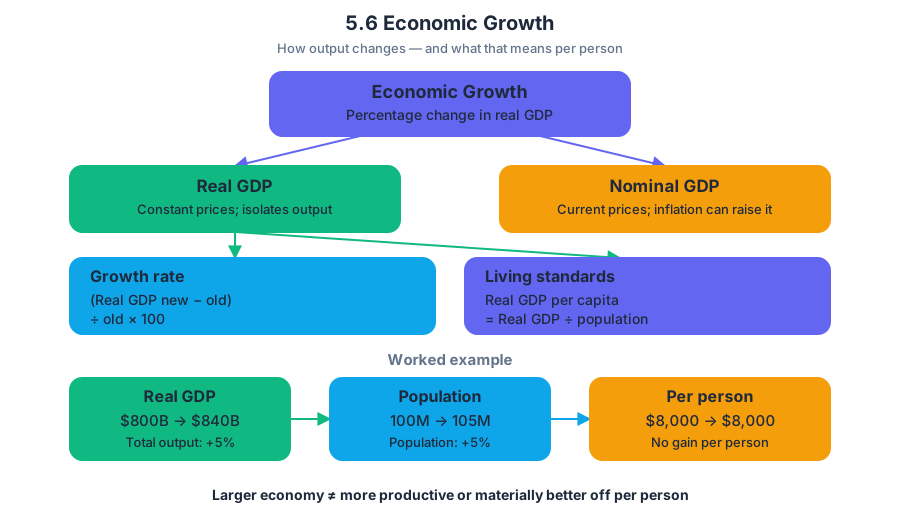
The standard measure of economic growth is the percentage change in real GDP, which values current production using constant prices. Real GDP is essential because nominal GDP can rise even when an economy produces the same quantity of goods and services at higher prices.
$$ \text{Economic growth rate}
\frac{\text{Real GDP}{\text{new}}-\text{Real GDP}{\text{old}}} {\text{Real GDP}_{\text{old}}} \times 100 $$
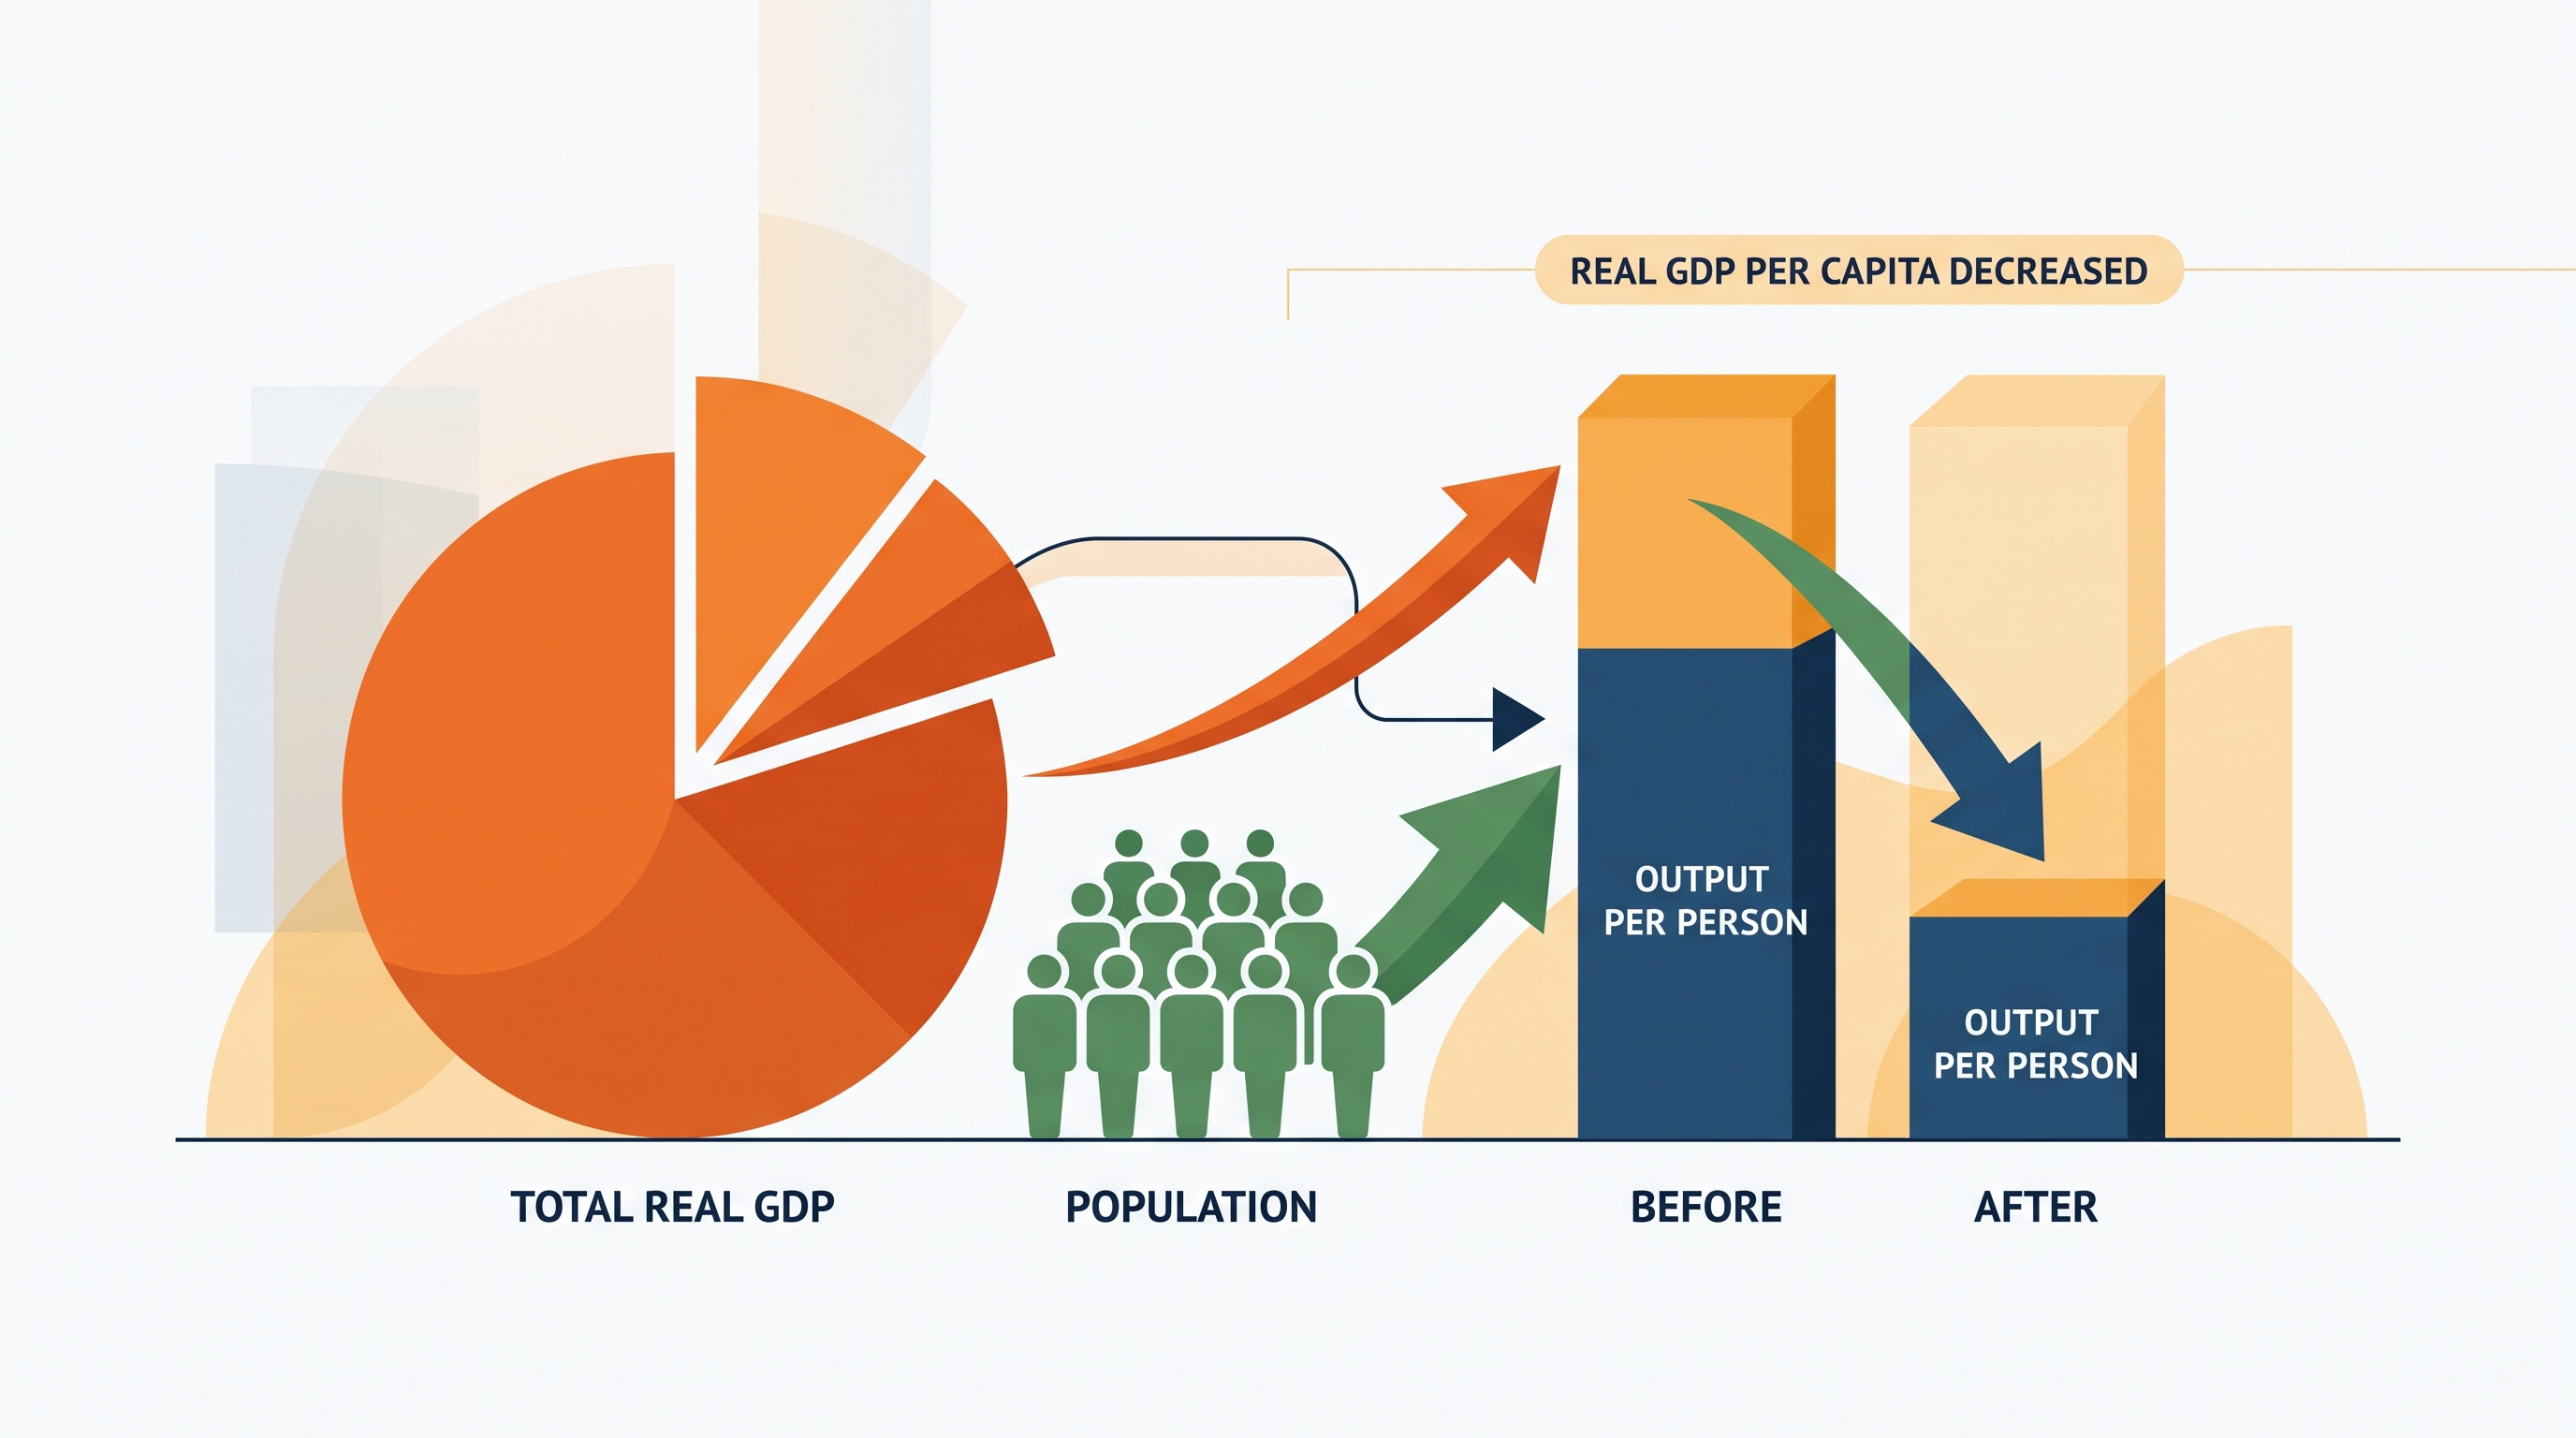
For living standards, economists usually examine real GDP per capita—real GDP divided by the population. Total real GDP may increase while real GDP per capita falls if population growth is faster than output growth.
$$ \text{Real GDP per capita}
\frac{\text{Real GDP}}{\text{Population}} $$
Worked example. Suppose an economy’s real GDP rises from $$800$ billion to $$840$ billion while its population rises from $100$ million to $105$ million.
$$ \text{Real GDP growth}
\frac{840-800}{800}\times 100
5% $$
$$ \text{Old real GDP per capita}
\frac{$800\text{ billion}}{100\text{ million}}
$8{,}000 $$
$$ \text{New real GDP per capita}
\frac{$840\text{ billion}}{105\text{ million}}
$8{,}000 $$
Total real GDP grew by $5%$, but real GDP per capita did not change. The economy became larger, not more productive per person. This distinction is why economic growth and improvements in average material living standards are related but not identical.
What produces economic growth?
Under CED Essential Knowledge 5.6.B.1, long-run economic growth results when an economy’s productive capacity expands. In the production possibilities model, growth appears as an outward shift of the production possibilities curve (PPC). In the AD–AS model, sustained growth is represented by a rightward shift of long-run aggregate supply (LRAS).
The principal determinants of growth are:
- Physical capital: tools, factories, machines, infrastructure, and equipment used to produce output.
- Human capital: workers’ education, training, skills, and health.
- Natural resources: land, minerals, energy, and other inputs supplied by nature.
- Technology: knowledge and methods that allow existing resources to produce more output or produce it at lower cost.
Investment in physical and human capital can raise productivity, meaning output produced per worker or per hour. Technological progress is especially powerful because it can improve the efficiency of many workers and machines simultaneously.
Worked contextual example. A country builds a modern port, trains logistics workers, and adopts software that coordinates shipments. The port is physical capital; worker training creates human capital; the software is a technological improvement. Together, these changes allow the economy to produce and transport more output at every possible price level, shifting LRAS rightward and expanding the PPC.
Graphing the growth mechanism
On a PPC graph, economic growth is shown by the entire curve shifting outward. A movement from an interior point to the existing curve represents better use of idle resources, not economic growth. Growth requires an increase in the economy’s maximum sustainable output.
On an AD–AS graph, long-run growth shifts LRAS from $LRAS_1$ to $LRAS_2$. If aggregate demand remains unchanged, the price level may fall while real output rises. If aggregate demand also increases, both real output and the price level may rise; the output increase still reflects greater productive capacity.
Misconception check
Misconception: “A higher nominal GDP always means economic growth.” Not necessarily. If prices rise by $8%$ while nominal GDP rises by $8%$, real GDP may be unchanged. Always separate changes in quantities from changes in prices.
Misconception: “Economic growth automatically benefits every person equally.” Real GDP per capita is an average. It does not reveal income distribution, unpaid household production, environmental costs, or whether gains are concentrated among a small group. Those limitations do not make the measure useless; they explain why it must be interpreted carefully.
Skills in action
Topic 5.6 is assessed through 1.A Define economic principles and models, 1.B Explain economic principles, concepts, and models, and 1.C Apply economic concepts, principles, and models when identifying growth and connecting capital or technology to productive capacity. 2.C Use quantitative data to evaluate economic outcomes and 3.C Calculate and interpret economic measures are used when computing real GDP growth or real GDP per capita. 4.A Draw correctly labeled graphs and 4.C Analyze graphical representations are used to show and interpret outward shifts of the PPC or LRAS.
Retrieval check
An economy’s real GDP rises by $4%$, but its population rises by $6%$. Did real GDP per capita increase? No. Because population grew faster than real GDP, real GDP per capita decreased. A complete answer should distinguish total economic growth from growth in output per person.
Source Materials
- AP Macroeconomics Course and Exam Description
- AP Macroeconomics Course and Exam Description Clarifications and Corrections
- AP Macroeconomics Course Overview
- AP Macroeconomics Course at a Glance
- AP Macroeconomics Course at a Glance Poster
- AP Macroeconomics
- AP Macroeconomics
- AP Macroeconomics Sample Syllabus 1