From the free course AP Macroeconomics on Lykke
AP Practice 3
A short free-response question can test several economic skills at once: a student may need to make an assertion, explain a causal chain, calculate a value, and draw a correctly labeled graph—all in a tightly limited response.
AP Practice 3
A short free-response question can test several economic skills at once: a student may need to make an assertion, explain a causal chain, calculate a value, and draw a correctly labeled graph—all in a tightly limited response.
This original, unofficial practice set models the short free-response question (FRQ) task type. It is designed around the exam’s required response behaviors: assertions, explanations, numerical analysis, and graph creation. The economic setting is new; the task structure is not copied from released College Board material.
The task: policy in a recession
Assume an economy is experiencing a recessionary gap. The marginal propensity to consume is $0.75$. The government is considering an increase in government purchases of $40$ billion.
(a) Identify the type of fiscal policy that would reduce the recessionary gap.
(b) Calculate the maximum possible change in real gross domestic product resulting from the $40$ billion increase in government purchases.
(c) On a correctly labeled aggregate demand–aggregate supply graph, show the short-run effect of this policy on the price level and real output.
(d) Explain why the actual change in real output may be smaller than the maximum possible change.
Suggested timing: Spend about $8$ minutes. Reserve roughly $1$ minute to read and plan, $5$ minutes to write the economic reasoning and calculation, and $2$ minutes to draw and inspect the graph.
Step 1: Identify the policy
The economy has a recessionary gap, so real output is below full-employment output. An increase in government purchases is expansionary fiscal policy because it directly increases aggregate demand.
Core assertion: To reduce a recessionary gap, the government should use expansionary fiscal policy, such as increasing government purchases or decreasing taxes.
This response earns the identification point because it names both the policy direction and the policy category. Merely writing “fiscal policy” is incomplete: contractionary fiscal policy would move the economy in the wrong direction.
Step 2: Calculate the spending multiplier
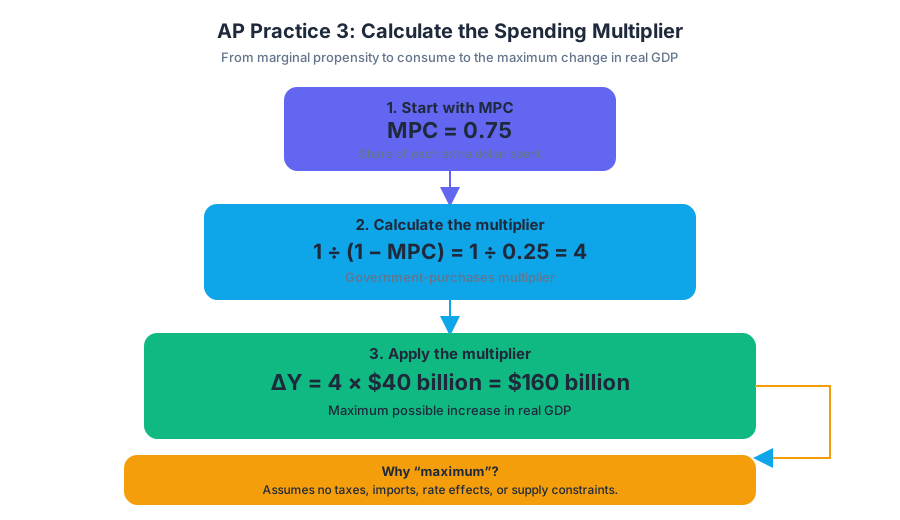
The government-purchases multiplier is
$$ \text{Government-purchases multiplier}=\frac{1}{1-\text{MPC}}. $$
Substitute the given marginal propensity to consume:
$$ \frac{1}{1-0.75}
\frac{1}{0.25}
$$
The maximum possible change in real GDP is therefore
$$ \Delta Y
\text{multiplier}\times\Delta G
4\times $40\text{ billion}
$160\text{ billion}. $$
Answer to (b): Real GDP could increase by a maximum of $$160$ billion.
The word maximum matters. The calculation assumes that each round of additional income creates the full expected consumption response, with no taxes, imports, interest-rate effects, or supply constraints reducing the eventual increase.
Step 3: Draw the AD–AS response
The graph must include a vertical axis labeled Price Level and a horizontal axis labeled Real Output. Draw an upward-sloping Short-Run Aggregate Supply (SRAS) curve, a downward-sloping Aggregate Demand (AD) curve, and an initial equilibrium. Then shift AD rightward from $AD_1$ to $AD_2$.
The new short-run equilibrium has both a higher price level and higher real output. Label the initial equilibrium $(P_1,Y_1)$ and the new equilibrium $(P_2,Y_2)$, with $P_2>P_1$ and $Y_2>Y_1$.
A rightward shift of AD is essential. Moving along the original AD curve would show a change in quantity demanded caused by a price-level change, not the effect of an independent increase in government purchases.
Step 4: Explain why the actual increase may be smaller
The maximum multiplier result assumes that the entire induced increase in consumption continues through every spending round. In reality, some additional income may be saved, taxed, or spent on imports rather than on domestically produced goods and services.
The expansion can also raise the interest rate. Higher interest rates may reduce private investment and interest-sensitive consumption, creating a crowding-out effect that partially offsets the increase in aggregate demand. Therefore, the actual increase in real GDP may be less than $$160$ billion.
Full causal chain: Higher government purchases $\rightarrow$ higher aggregate demand $\rightarrow$ higher real output and price level in the short run; higher income, taxes, saving, imports, or interest rates may weaken the final output increase.
What an examiner rewards
| Task | Strong response | Common incomplete response |
|---|---|---|
| Assertion | Identifies expansionary fiscal policy and connects it to the recessionary gap | Says only “use fiscal policy” |
| Numerical analysis | Uses $\frac{1}{1-\text{MPC}}$ and calculates $$160$ billion | Uses the tax multiplier or forgets to multiply by $$40$ billion |
| Graph creation | Correctly labels axes, shifts AD right, and shows both outcomes | Shifts SRAS or draws movement along AD |
| Explanation | Gives a causal reason the actual result is smaller, such as crowding out or imports | Repeats that the multiplier is “not exact” without explaining why |
Named misconception check
Misconception: “A recession requires contractionary policy because the economy is performing badly.” The direction of policy depends on the problem being corrected. A recessionary gap requires an increase in aggregate demand, while excessive inflationary pressure may call for contractionary policy.
Misconception: “The multiplier result is always the final change in GDP.” The multiplier gives the maximum possible change under simplified assumptions. Leakage into saving, taxes, and imports, along with crowding out, can reduce the actual result.
Error-review routine
After completing the question, classify each error as one of four types: principle, interpretation, manipulation, or graphing and visuals. Rewrite only the missed part, adding the missing causal link, algebraic step, graph label, or directional explanation.
For a second attempt, cover the numerical answer and ask: What policy closes a recessionary gap? Which multiplier applies? Which curve shifts? What happens to the price level and real output? If those four answers are immediate, the response has the structure an examiner can reward.

Source Materials
- AP Macroeconomics Course and Exam Description
- AP Macroeconomics Course and Exam Description Clarifications and Corrections
- AP Macroeconomics Course Overview
- AP Macroeconomics Course at a Glance
- AP Macroeconomics Course at a Glance Poster
- AP Macroeconomics
- AP Macroeconomics
- AP Macroeconomics Sample Syllabus 1
- AP Macroeconomics-AP Students-College Board
- AP Macroeconomics FRQ Practice
- AP/College Macroeconomics-Khan Academy
- AP Macroeconomics Units/Save my Exams