From the free course AP Macroeconomics on Lykke
6.3 The Foreign Exchange Market
Key concepts: Foreign exchange market · Exchange rate · Currency appreciation · Currency depreciation · Equilibrium exchange rate · Supply and demand for currency · Flexible exchange market · International trade and financial capital flows · Balance of payments (BOP) · Currency valuation
The foreign exchange market is where buyers and sellers trade one country’s currency for another. Its central question is simple: when millions of international payments and investments occur, what determines the price of a currency?
6.3 The Foreign Exchange Market
The foreign exchange market is where buyers and sellers trade one country’s currency for another. Its central question is simple: when millions of international payments and investments occur, what determines the price of a currency?
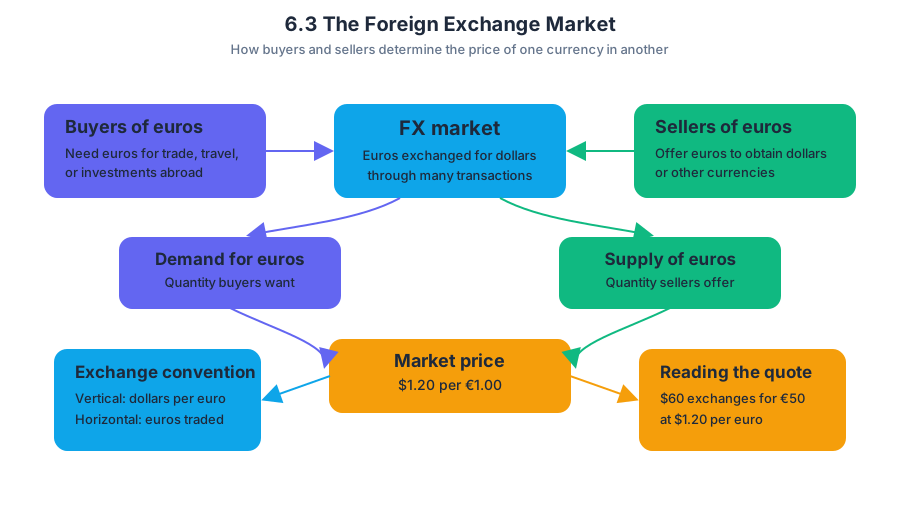
Use the exchange-rate convention established in Topic 6.2. For a market for euros priced in U.S. dollars, the vertical axis records dollars per euro, and the horizontal axis records the quantity of euros traded. A quote of $1.20 per euro means that $60 exchanges for $50 euros; the important point here is how buyers and sellers create that market price.
Currency flows create demand and supply
International trade and international finance send currencies in opposite directions. When U.S. residents buy European goods, services, or financial assets, they need euros. Their purchases create demand for euros. When European residents buy U.S. goods, services, or assets, they need dollars; to obtain those dollars, they supply euros in the foreign exchange market.
The same logic applies to financial capital. If investors purchase foreign stocks, bonds, factories, or other assets, they first exchange their domestic currency for the currency in which the asset is priced. Thus, currency demand can arise from demand for a country’s goods, services, and financial assets, while currency supply arises from making payments in other currencies.
MKT-5.B.1: The demand for a currency in a foreign exchange market arises from the demand for the country’s goods, services, and financial assets and shows the inverse relationship between the exchange rate and the quantity demanded of a currency.
MKT-5.B.2: The supply of a currency in a foreign exchange market arises from making payments in other currencies and shows the positive relationship between the exchange rate and the quantity supplied of a currency.
Reading the foreign exchange graph
In the euro market, the demand curve slopes downward. When the dollar price of a euro rises, European goods, services, and assets become more expensive for U.S. buyers, so the quantity of euros demanded decreases. When the dollar price of a euro falls, those purchases become relatively cheaper, so the quantity of euros demanded increases.
The supply curve for euros slopes upward. A higher dollar price per euro gives euro holders more dollars in exchange for each euro, encouraging them to supply more euros to purchase U.S. goods, services, and assets. Therefore, the exchange rate and the quantity supplied of a currency have a positive relationship.
A correctly labeled graph should identify:
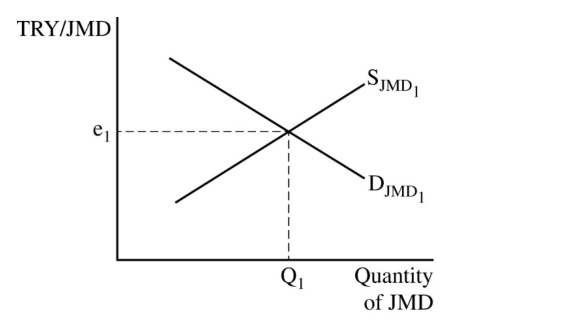
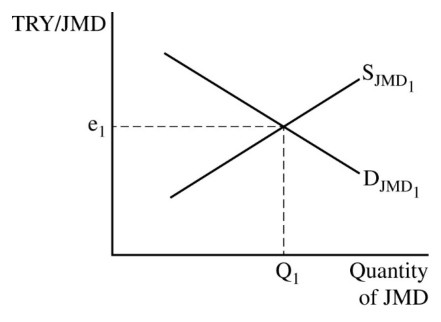
- the vertical axis as the exchange rate, such as dollars per euro;
- the horizontal axis as the quantity of euros;
- a downward-sloping demand curve, $D_{\text{€}}$;
- an upward-sloping supply curve, $S_{\text{€}}$; and
- the equilibrium point where the two curves intersect.
Equilibrium, appreciation, and depreciation
The equilibrium exchange rate is the price at which the quantity of a currency demanded equals the quantity supplied. At this point, currency buyers can complete their desired purchases, and currency sellers can complete their desired sales.
MKT-5.C: The equilibrium exchange rate is determined where the quantity demanded and quantity supplied of a currency are equal.
If demand for euros increases while supply is unchanged, the euro’s dollar price rises. The euro appreciates, meaning its value increases relative to the dollar. If demand for euros decreases, the euro’s dollar price falls and the euro depreciates.
Because currencies are always valued relative to one another, one currency’s appreciation is simultaneously the other currency’s depreciation. If the euro appreciates against the dollar, fewer dollars are needed to purchase a given amount of European goods in euro terms, while European buyers find U.S. goods relatively more expensive in their own currency.
Worked market example
Suppose U.S. households begin purchasing more European streaming subscriptions and European investors purchase more U.S. corporate assets. The first transaction increases demand for euros; the second supplies euros because European investors exchange euros for dollars. On a euro foreign-exchange graph, demand shifts right and supply shifts right. The new equilibrium exchange rate depends on the relative size of the two shifts—not on the fact that “more international activity” automatically raises or lowers the euro’s value.
This market therefore coordinates two-way flows: trade moves currencies because buyers pay for imports and sellers receive payment for exports, while capital moves currencies because investors exchange funds to acquire foreign assets. Changes in the equilibrium exchange rate then alter the relative prices of traded goods, services, and assets across countries.
Misconception check
Misconception: “A country supplies its own currency when it exports.” In the foreign exchange market for euros, a U.S. export to Europe creates demand for dollars and supply of euros by the European buyer. Always identify which currency is on the horizontal axis and ask who needs that currency to complete a purchase.
Retrieval check
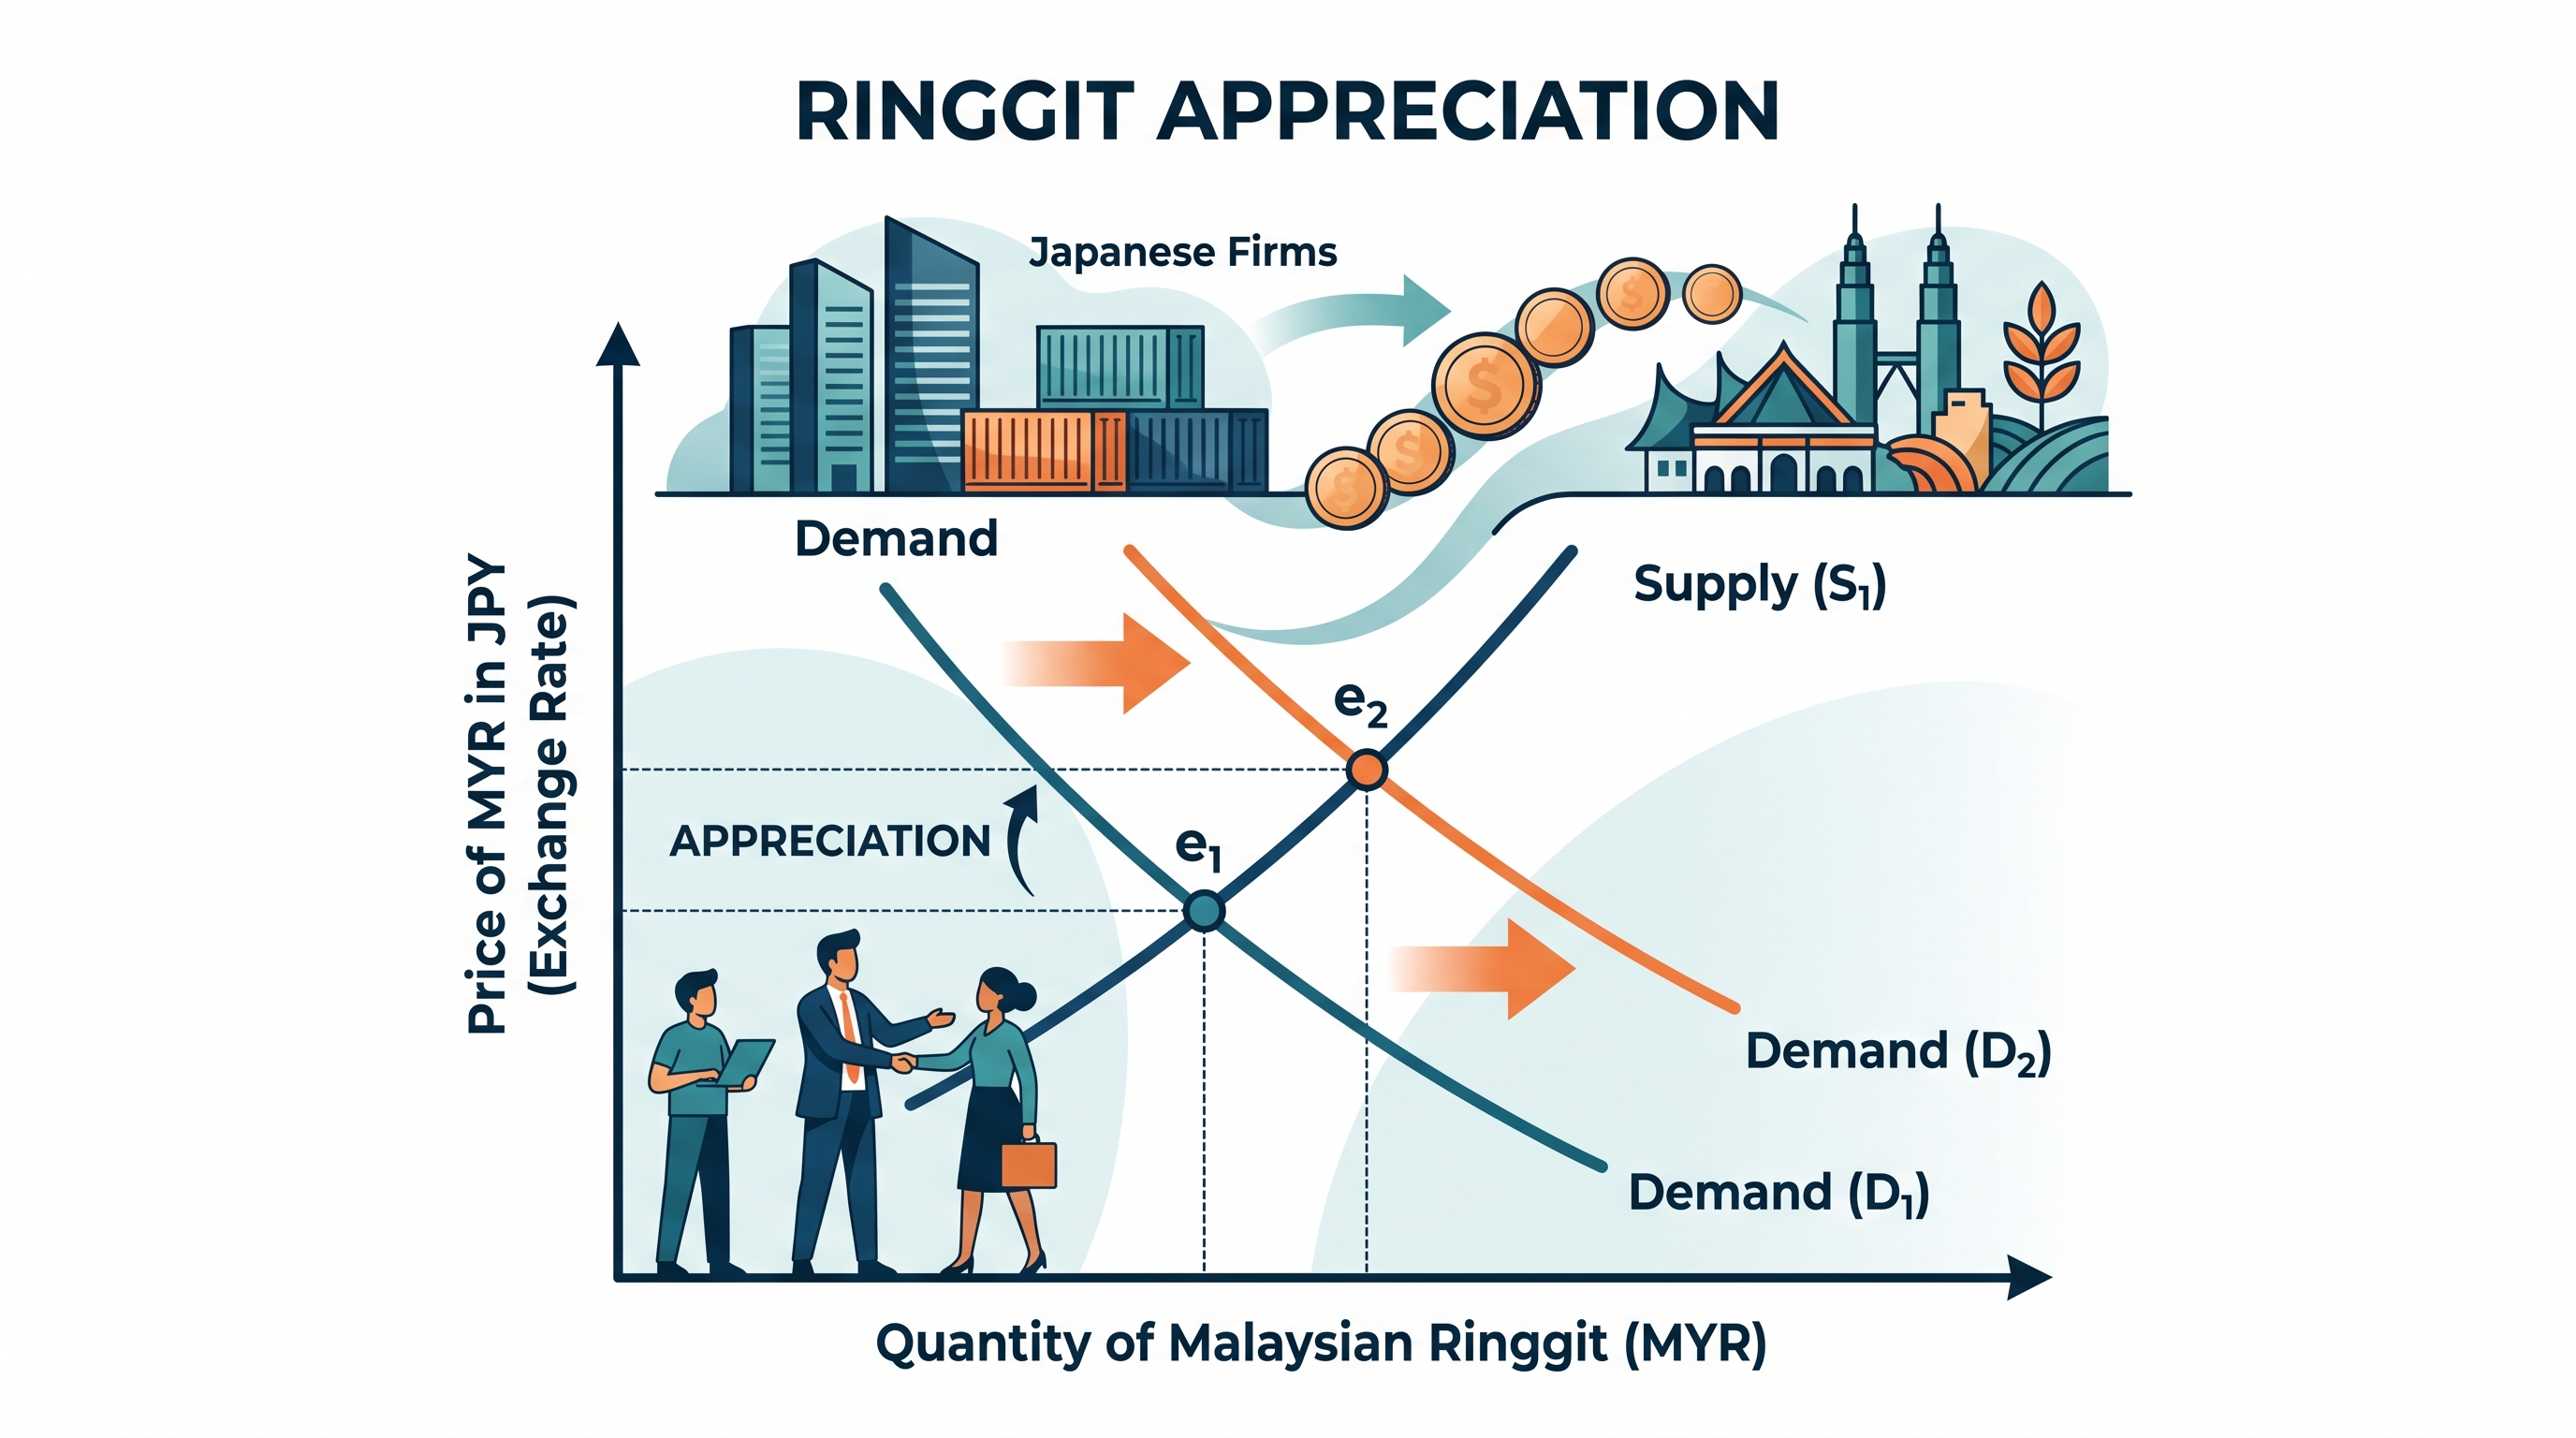
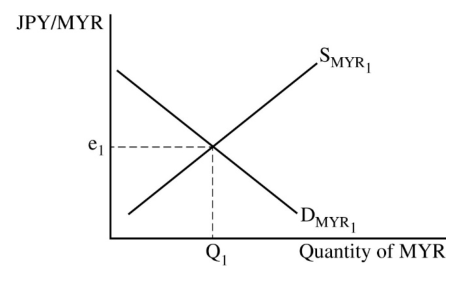
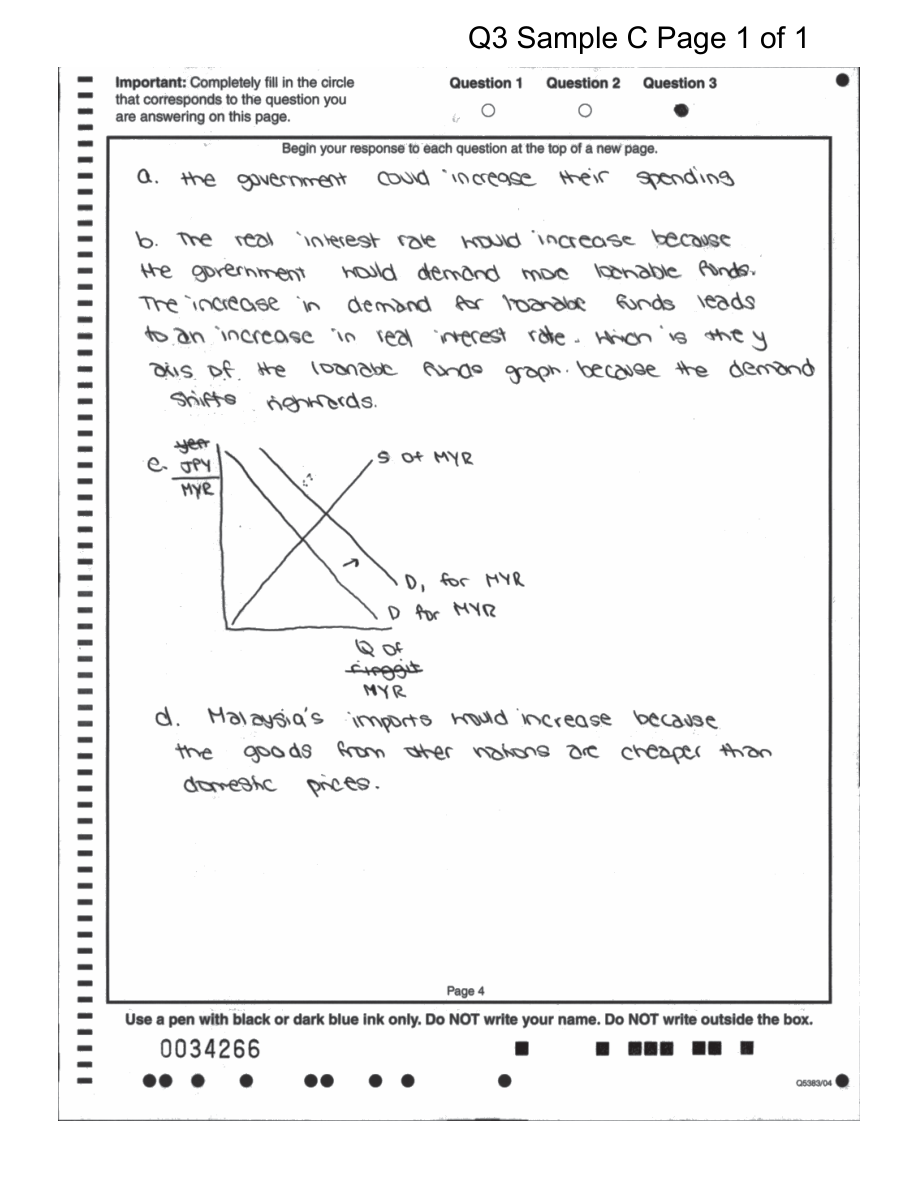
In a market for Malaysian ringgit priced in Japanese yen, Japanese firms purchase more Malaysian services. Which curve shifts, and what happens to the ringgit?
Answer: Demand for ringgit shifts right because Japanese firms need ringgit to pay Malaysian sellers. The equilibrium quantity of ringgit rises, and the ringgit appreciates relative to the yen if supply does not change. This application uses 3.B: Manipulation, determining the effect of a change in one economic market on another, and 4.A: Graphing, representing the foreign exchange market with correctly labeled axes, curves, and equilibrium.
Source Materials
- AP Macroeconomics Course and Exam Description
- AP Macroeconomics Course and Exam Description Clarifications and Corrections
- AP Macroeconomics Course Overview
- AP Macroeconomics Course at a Glance
- AP Macroeconomics Course at a Glance Poster
- AP Macroeconomics
- AP Macroeconomics
- AP Macroeconomics Sample Syllabus 1
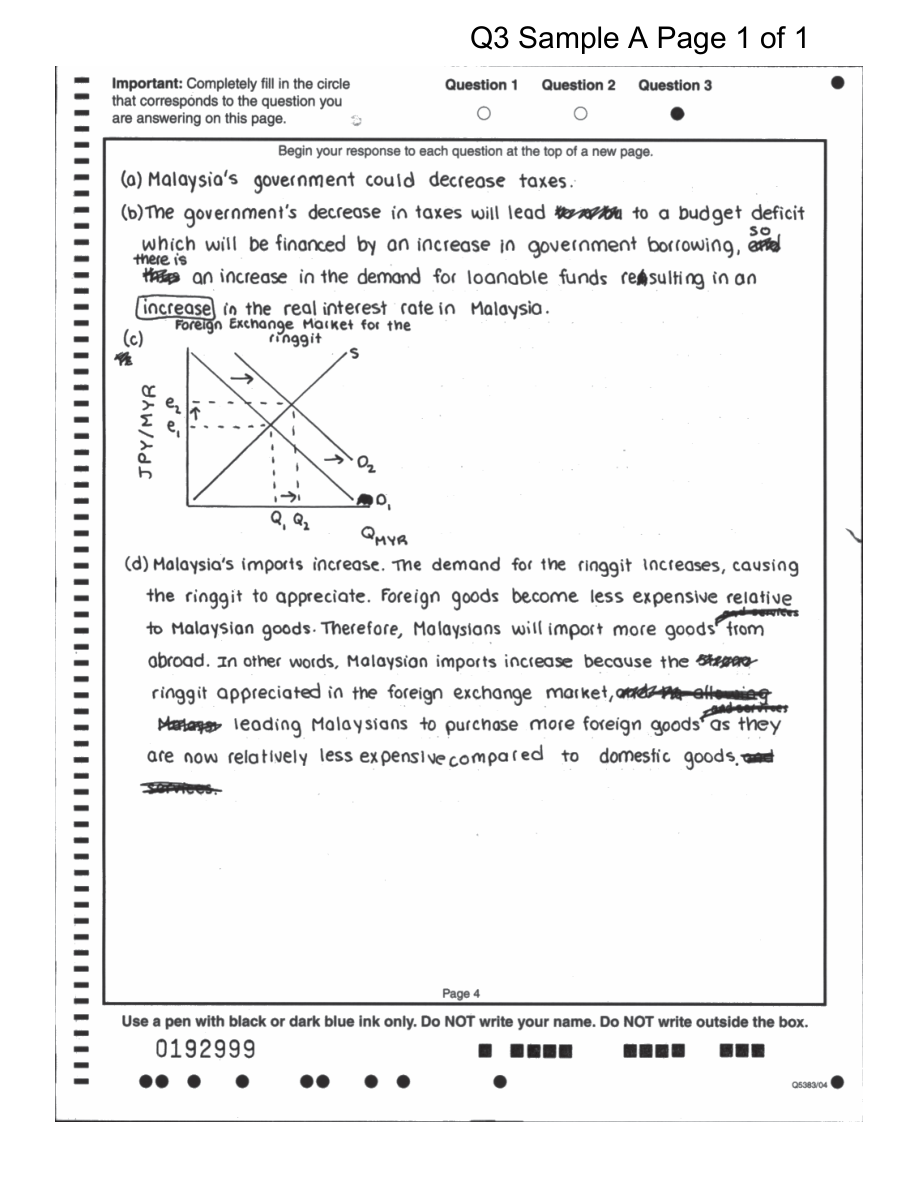
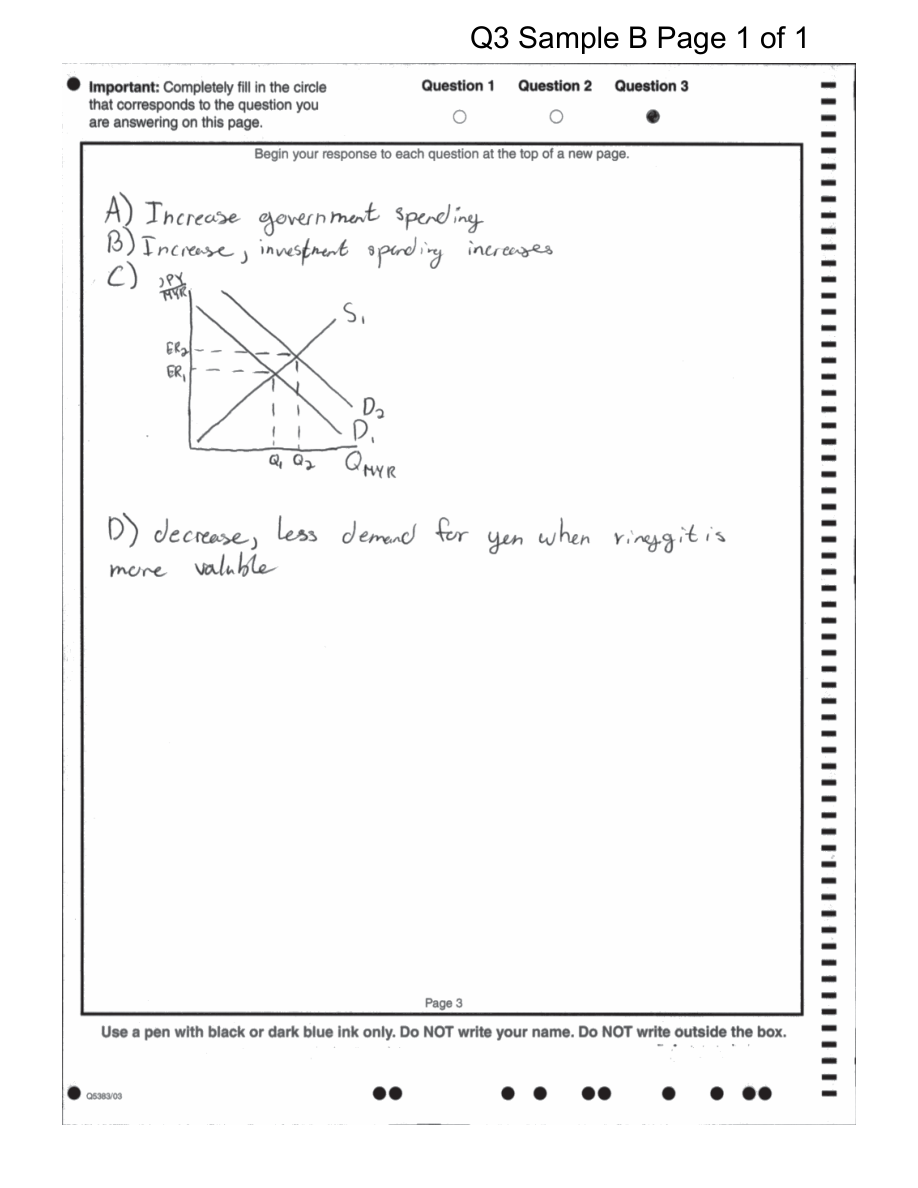
- For the second point, the graph must show an increase in the demand for the ringgit (or a decrease in the supply of the ringgit), resulting in an appreciation of the ringgit.
- Figure — Sample Responses Q3 - Set 1 (p. 3)
- Figure — Sample Responses Q3 - Set 1 (p. 4)
- Figure — Sample Responses Q3 - Set 1 (p. 5)