From the free course AP Macroeconomics on Lykke
AP Practice 4
A strong short free-response answer does more than name a policy: it connects an economic model to a predicted outcome, supports the prediction with a graph or calculation, and explains the causal chain in precise language.
AP Practice 4
A strong short free-response answer does more than name a policy: it connects an economic model to a predicted outcome, supports the prediction with a graph or calculation, and explains the causal chain in precise language.
Task focus: short free-response analysis
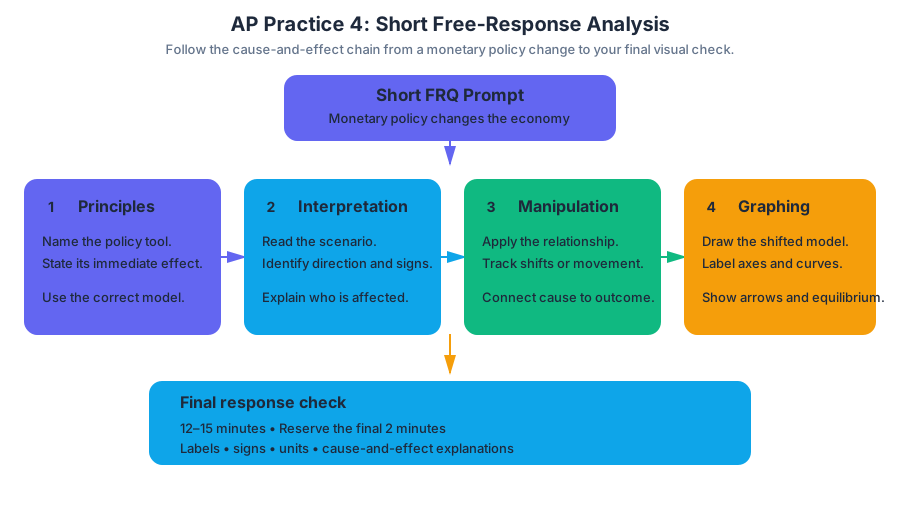
This original, unofficial practice set models a short free-response task built around a change in monetary policy. It combines the four course skill categories: 1. Principles and Models, 2. Interpretation, 3. Manipulation, and 4. Graphing and Visuals.
Timing target: Spend approximately $12$–$15$ minutes. Reserve the final $2$ minutes to check graph labels, signs, units, and whether every “explain” prompt includes a cause-and-effect chain.
Practice prompt
Assume the economy is initially operating at full employment. The central bank decides to conduct an expansionary monetary policy.
(a) Draw a correctly labeled money market graph showing the effect of the policy on the equilibrium nominal interest rate. Identify the policy action that shifts the relevant curve.
(b) Explain how the change in the nominal interest rate affects investment spending, assuming other factors remain constant.
(c) Suppose the marginal propensity to consume is $0.75$. The central bank’s action increases planned investment by $$40$ billion. Calculate the maximum possible change in real gross domestic product generated by the investment increase.
(d) Using an aggregate demand–aggregate supply graph, show the short-run effect of the policy on real output and the price level. Assume the economy begins at full employment.
Worked reasoning
(a) Money market
Expansionary monetary policy increases the money supply. In the money market, the nominal interest rate is the price of borrowing money, so the vertical axis shows the nominal interest rate, $i$, and the horizontal axis shows the quantity of money, $M$.
The money-supply curve shifts right from $MS_1$ to $MS_2$. With money demand unchanged, the new equilibrium occurs at a lower nominal interest rate, moving from $i_1$ to $i_2$.
Credit-worthy graph response: The graph must label the vertical axis as the nominal interest rate, the horizontal axis as the quantity of money, show a downward-sloping money-demand curve, show the money-supply shift to the right, and indicate that the equilibrium interest rate decreases.
(b) Investment spending
A lower nominal interest rate reduces the cost of borrowing. Firms therefore face a lower financing cost for factories, equipment, inventories, or other capital projects, so planned investment spending increases.
The complete causal chain is:
$$ \text{Expansionary monetary policy} \rightarrow \text{money supply increases} \rightarrow i \text{ decreases} \rightarrow \text{borrowing becomes cheaper} \rightarrow I \text{ increases} $$
A response that merely says “investment increases because interest rates fall” identifies the correct relationship but may be incomplete if the prompt requires an explanation. Adding why lower interest rates encourage investment supplies the missing economic reasoning.
(c) Investment multiplier
The expenditure multiplier is calculated as:
$$\text{Multiplier}=\frac{1}{1-\text{MPC}}$$
Substitute the given marginal propensity to consume:
$$\text{Multiplier}=\frac{1}{1-0.75}=\frac{1}{0.25}=4$$
The maximum possible change in real GDP is:
$$\Delta Y=\text{Multiplier}\times\Delta I$$
$$\Delta Y=4\times $40\text{ billion}=$160\text{ billion}$$
Answer: Real GDP can increase by a maximum of $$160$ billion. The word maximum matters: this calculation assumes no crowding out, no taxes, no imports, and sufficient unused productive capacity.
(d) AD–AS effect
Higher investment spending is a component of aggregate demand:
$$AD=C+I+G+NX$$
Because investment, $I$, increases, aggregate demand shifts right from $AD_1$ to $AD_2$. In the short run, the economy moves upward along the unchanged short-run aggregate supply curve. Real output rises above its initial level, and the price level also rises.
The correct graph labels the vertical axis as the price level and the horizontal axis as real output, includes downward-sloping $AD$ and upward-sloping $SRAS$ curves, and shows $AD$ shifting right. The new equilibrium must have both a higher price level and greater real output.
Common misconceptions
Misconception 1: “Expansionary policy shifts money demand right.” The policy directly changes the money supply. Money demand may change later because income or the price level changes, but that is not the initial policy shift.
Misconception 2: “A lower interest rate reduces investment.” In the standard macroeconomic model, lower borrowing costs increase the quantity of investment demanded, holding expected profitability and other determinants constant.
Misconception 3: “The multiplier is $1-\text{MPC}$.” The multiplier is the reciprocal, $\frac{1}{1-\text{MPC}}$. With an MPC of $0.75$, each initial dollar ultimately creates up to $$4$ of total output.
Misconception 4: “Full employment means output cannot rise.” In the short run, expansionary policy can push real output above full-employment output, creating an inflationary gap. The economy may later self-adjust toward its long-run level.
What an examiner rewards
A rubric-aligned answer earns credit by showing the correct model, shifting the correct curve, calculating with the correct formula, and explaining the economic mechanism rather than stating disconnected conclusions. Numerical answers should include the calculation, not only the final number.
For error review, classify each missed point as model selection, curve shift, direction of change, calculation, graph labeling, or explanation. Then rewrite only the failed step, including the missing causal link or label; this is more useful than copying the entire answer.

Source Materials
- AP Macroeconomics Course and Exam Description
- AP Macroeconomics Course and Exam Description Clarifications and Corrections
- AP Macroeconomics Course Overview
- AP Macroeconomics Course at a Glance
- AP Macroeconomics Course at a Glance Poster
- AP Macroeconomics
- AP Macroeconomics
- AP Macroeconomics Sample Syllabus 1
- AP Macroeconomics-AP Students-College Board
- AP Macroeconomics FRQ Practice
- AP/College Macroeconomics-Khan Academy
- AP Macroeconomics Units/Save my Exams