From the free course AP Macroeconomics on Lykke
1.6 Market Equilibrium, Disequilibrium, and Changes in Equilibrium
Key concepts: Market equilibrium · Disequilibrium · Surpluses and shortages · Changes in equilibrium · Shifts in supply and demand · Equilibrium price and quantity · Money market equilibrium · Demand for money · Nominal interest rate · Loanable funds market
A market is in equilibrium when the price makes the quantity buyers want equal to the quantity sellers offer. At that point, neither side has a reason created by the market itself to change its behavior: the market “clears.”
1.6 Market Equilibrium, Disequilibrium, and Changes in Equilibrium
A market is in equilibrium when the price makes the quantity buyers want equal to the quantity sellers offer. At that point, neither side has a reason created by the market itself to change its behavior: the market “clears.”
Equilibrium: $Q_d = Q_s$ at the equilibrium price and equilibrium quantity.
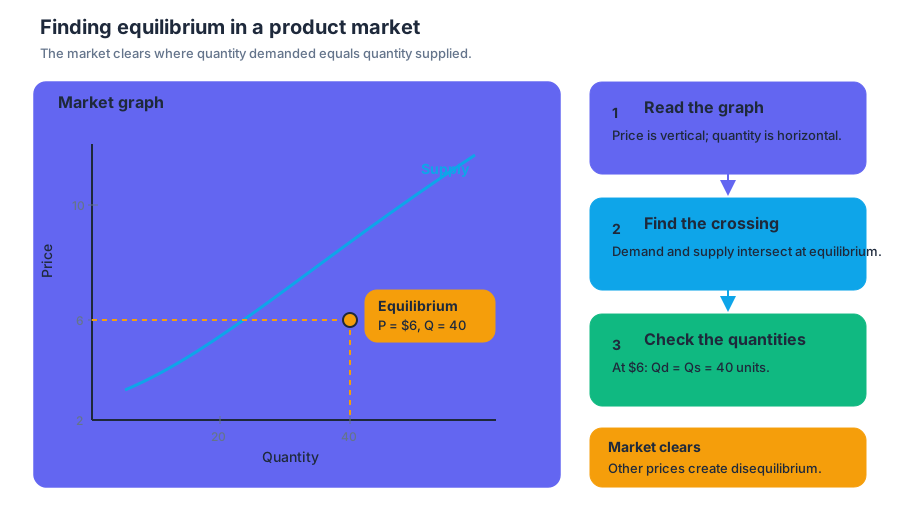
Finding equilibrium in a product market
On a standard graph, price is on the vertical axis and quantity is on the horizontal axis. The intersection of demand and supply identifies equilibrium, as required by MKT-2.E: Define market equilibrium, using graphs and MKT-2.E.1: Equilibrium is reached when the price makes quantities demanded and supplied equal.
Suppose a neighborhood market has the following quantities:
| Price | Quantity demanded | Quantity supplied |
|---|---|---|
| $10$ | $20$ | $60$ |
| $6$ | $40$ | $40$ |
| $2$ | $70$ | $20$ |
At a price of $6$, $Q_d = Q_s = 40$, so the equilibrium price is $6$ and the equilibrium quantity is $40$ units. The prices of $10$ and $2$ do not clear the market.
Disequilibrium: surpluses and shortages
Disequilibrium occurs whenever $Q_d \neq Q_s$. A surplus occurs when quantity supplied exceeds quantity demanded:
$$ \text{Surplus} = Q_s - Q_d \quad \text{when } Q_s > Q_d. $$
A shortage occurs when quantity demanded exceeds quantity supplied:
$$ \text{Shortage} = Q_d - Q_s \quad \text{when } Q_d > Q_s. $$
In the example, a price of $10$ creates a surplus of $60 - 20 = 40$ units. Sellers cannot sell everything they planned to sell, so they have an incentive to lower the price. At a price of $2$, the shortage is $70 - 20 = 50$ units; frustrated buyers compete for too few units, giving sellers an incentive to raise the price.
MKT-2.F.1: Whenever markets experience imbalances—creating disequilibrium prices, surpluses, and shortages—market forces drive prices toward equilibrium.
Misconception check — “A surplus means consumers want more.” No. A surplus means sellers offer more than buyers want at the current price. A shortage means buyers want more than sellers offer at the current price. The comparison is always $Q_d$ versus $Q_s$, not total demand versus total supply.
Changes in equilibrium: shift first, intersection second
A change in a determinant of demand or supply shifts an entire curve. The market then moves to a new intersection, producing a new equilibrium price and quantity. This is MKT-2.G: Explain (using graphs as appropriate) how changes in demand and supply affect equilibrium price and equilibrium quantity, supported by MKT-2.G.1: Changes in the determinants of supply and/or demand result in a new equilibrium price and quantity.
Use the graph in two stages:
- Identify which curve shifts and in which direction.
- Read the new price and quantity from the new intersection.
For example, an increase in demand shifts demand right. Equilibrium price rises and equilibrium quantity rises. A decrease in supply shifts supply left. Equilibrium price rises, but equilibrium quantity falls.
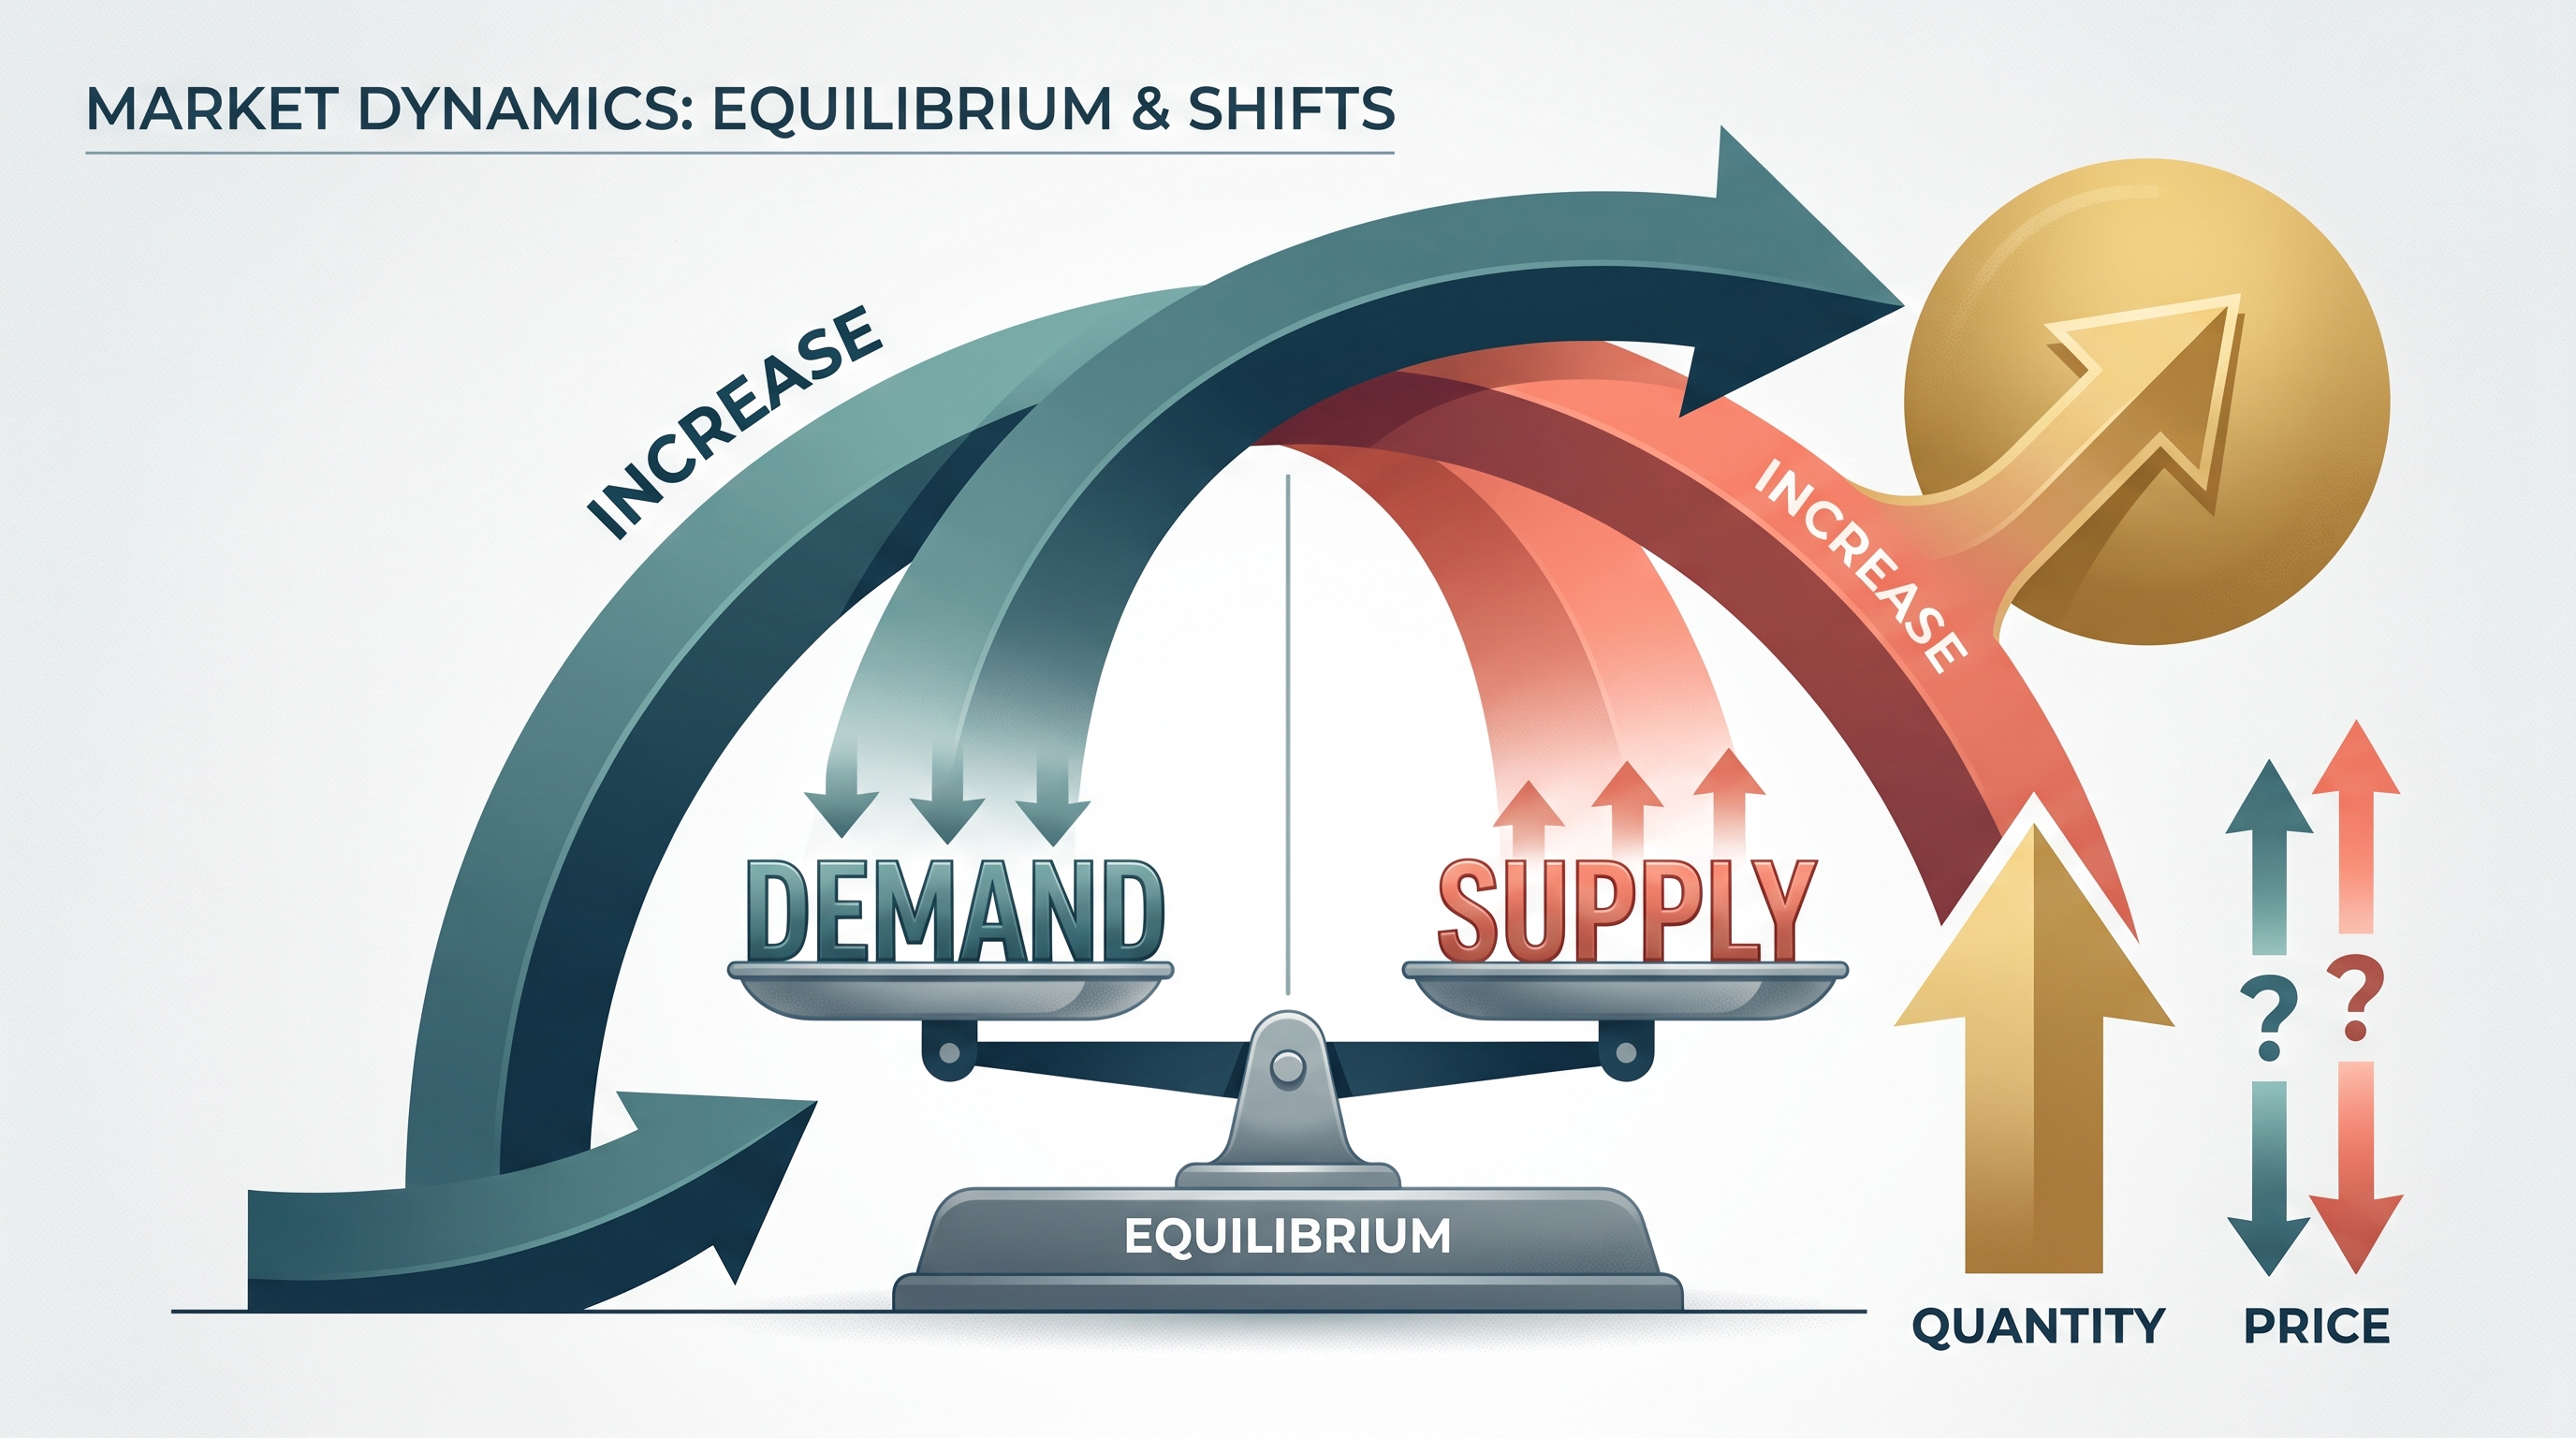
When both curves shift, one result may be determinate while the other is not. An increase in demand and a decrease in supply both raise equilibrium price, but their effects on equilibrium quantity conflict: increased demand pushes quantity up, while decreased supply pushes it down. Therefore, the change in equilibrium quantity is indeterminate without additional information.
An increase in demand and an increase in supply create the opposite problem for price: demand pushes price up, while supply pushes price down. Thus, the change in equilibrium price is indeterminate, although equilibrium quantity increases.
Exam trap: Do not choose an answer that claims both equilibrium variables always move in the same direction. When shifts exert opposing effects, label the result indeterminate.
The same logic in the money market
The money market determines the equilibrium nominal interest rate, the interest rate measured before adjusting for inflation. Its vertical axis measures the nominal interest rate, while its horizontal axis measures the quantity of money.
The demand for money slopes downward because the nominal interest rate is the opportunity cost of holding money rather than an interest-earning financial asset. When the nominal interest rate rises, people want to hold less money; when it falls, they want to hold more. This inverse relationship is MKT-3.A.1: The demand for money shows the inverse relationship between the nominal interest rate and the quantity of money people want to hold.
Factors affecting the value or attractiveness of other financial assets can shift money demand. For instance, if bonds become more attractive, people may reduce the money balances they want to hold, shifting money demand left. The money supply is shown as independent of the nominal interest rate in the basic model, so it is vertical.
Loanable funds: real interest-rate adjustment
The loanable funds market applies the same equilibrium principle to saving and borrowing. MKT-4.D.1 states that disequilibrium real interest rates create surpluses and shortages in this market, while market forces drive the real interest rate toward equilibrium. A real interest rate is approximately:
$$ r \approx i - \pi^e $$
where $i$ is the nominal interest rate and $\pi^e$ is expected inflation.
If the real interest rate is above equilibrium, the quantity of funds supplied exceeds the quantity demanded—a surplus of loanable funds. Lenders compete for borrowers, pushing the real interest rate downward. If it is below equilibrium, a shortage occurs, and competition among borrowers pushes the rate upward.
Skill focus: This topic develops Skill 1.A: Define economic principles and models, Skill 1.B: Explain economic principles and models, Skill 2.B: Interpret economic models, Skill 3.A: Determine outcomes of economic situations, Skill 3.B: Calculate values using economic relationships, and Skill 4.A: Draw graphs and visual representations of economic models. On an exam, earn graphing credit by labeling axes, curves, equilibrium points, and directional shifts; earn explanation credit by completing the causal chain from shift, to disequilibrium, to price or interest-rate adjustment, to the new equilibrium.
Retrieval check
A market begins at equilibrium. Demand increases while supply increases. What happens to equilibrium quantity, and what happens to equilibrium price?
Answer: Equilibrium quantity increases because both shifts raise quantity. Equilibrium price is indeterminate because the demand shift raises price while the supply shift lowers it.
Source Materials
- AP Macroeconomics Course and Exam Description
- AP Macroeconomics Course and Exam Description Clarifications and Corrections
- AP Macroeconomics Course Overview
- AP Macroeconomics Course at a Glance
- AP Macroeconomics Course at a Glance Poster
- AP Macroeconomics
- AP Macroeconomics
- AP Macroeconomics Sample Syllabus 1