From the free course AP Macroeconomics on Lykke
5.2 The Phillips Curve
Key concepts: Short-run Phillips curve (SRPC) · Long-run Phillips curve (LRPC) · Natural rate of unemployment · Actual unemployment rate · Cyclical unemployment · Structural unemployment · Natural unemployment · Graphing Phillips curve relationships · Distinguishing short-run and long-run outcomes · Common errors in calculating unemployment rates
The Phillips curve models the relationship between inflation and unemployment: in the short run, higher inflation is associated with lower unemployment, but in the long run unemployment returns to a rate determined by the economy’s labor-market structure.
5.2 The Phillips Curve
The Phillips curve models the relationship between inflation and unemployment: in the short run, higher inflation is associated with lower unemployment, but in the long run unemployment returns to a rate determined by the economy’s labor-market structure.
The two curves
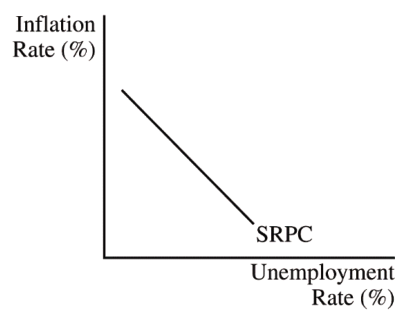
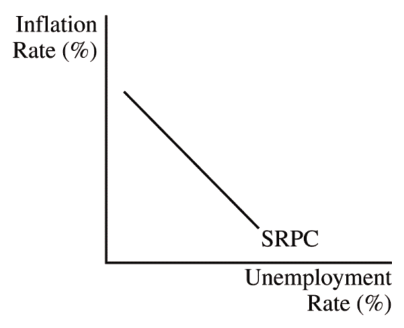
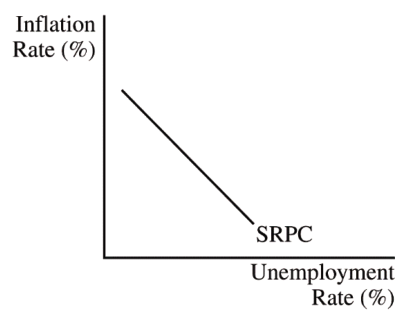
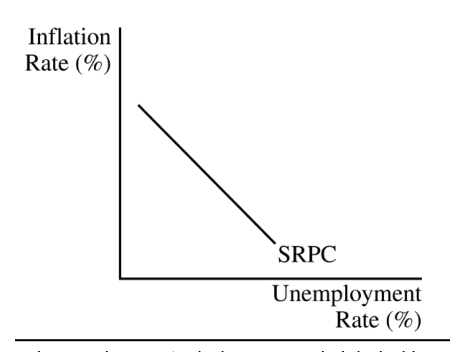
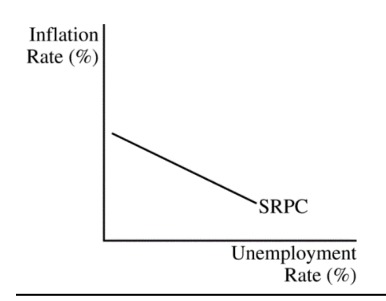
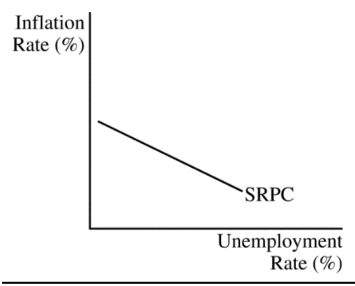
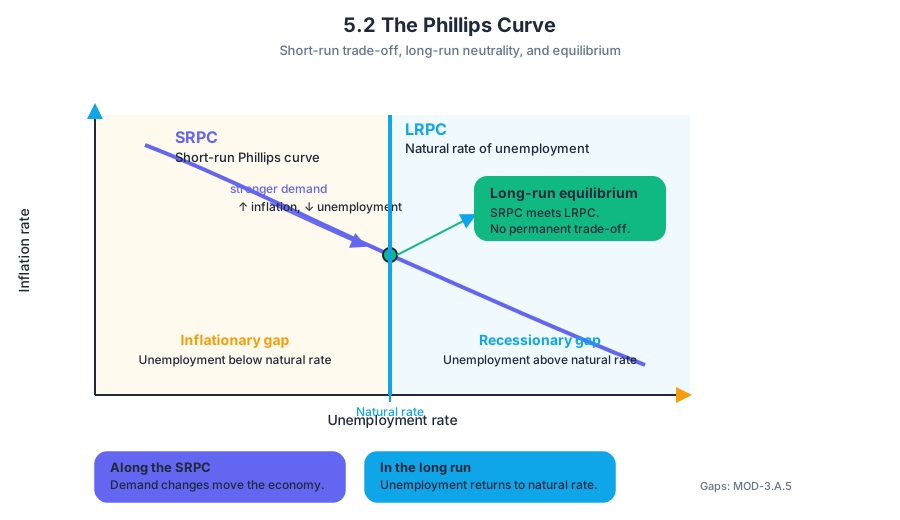
The short-run Phillips curve (SRPC) is downward sloping. Its horizontal axis measures the unemployment rate, and its vertical axis measures the inflation rate. Moving along the SRPC represents a short-run trade-off: stronger demand can raise production and employment while also increasing the price level and inflation.
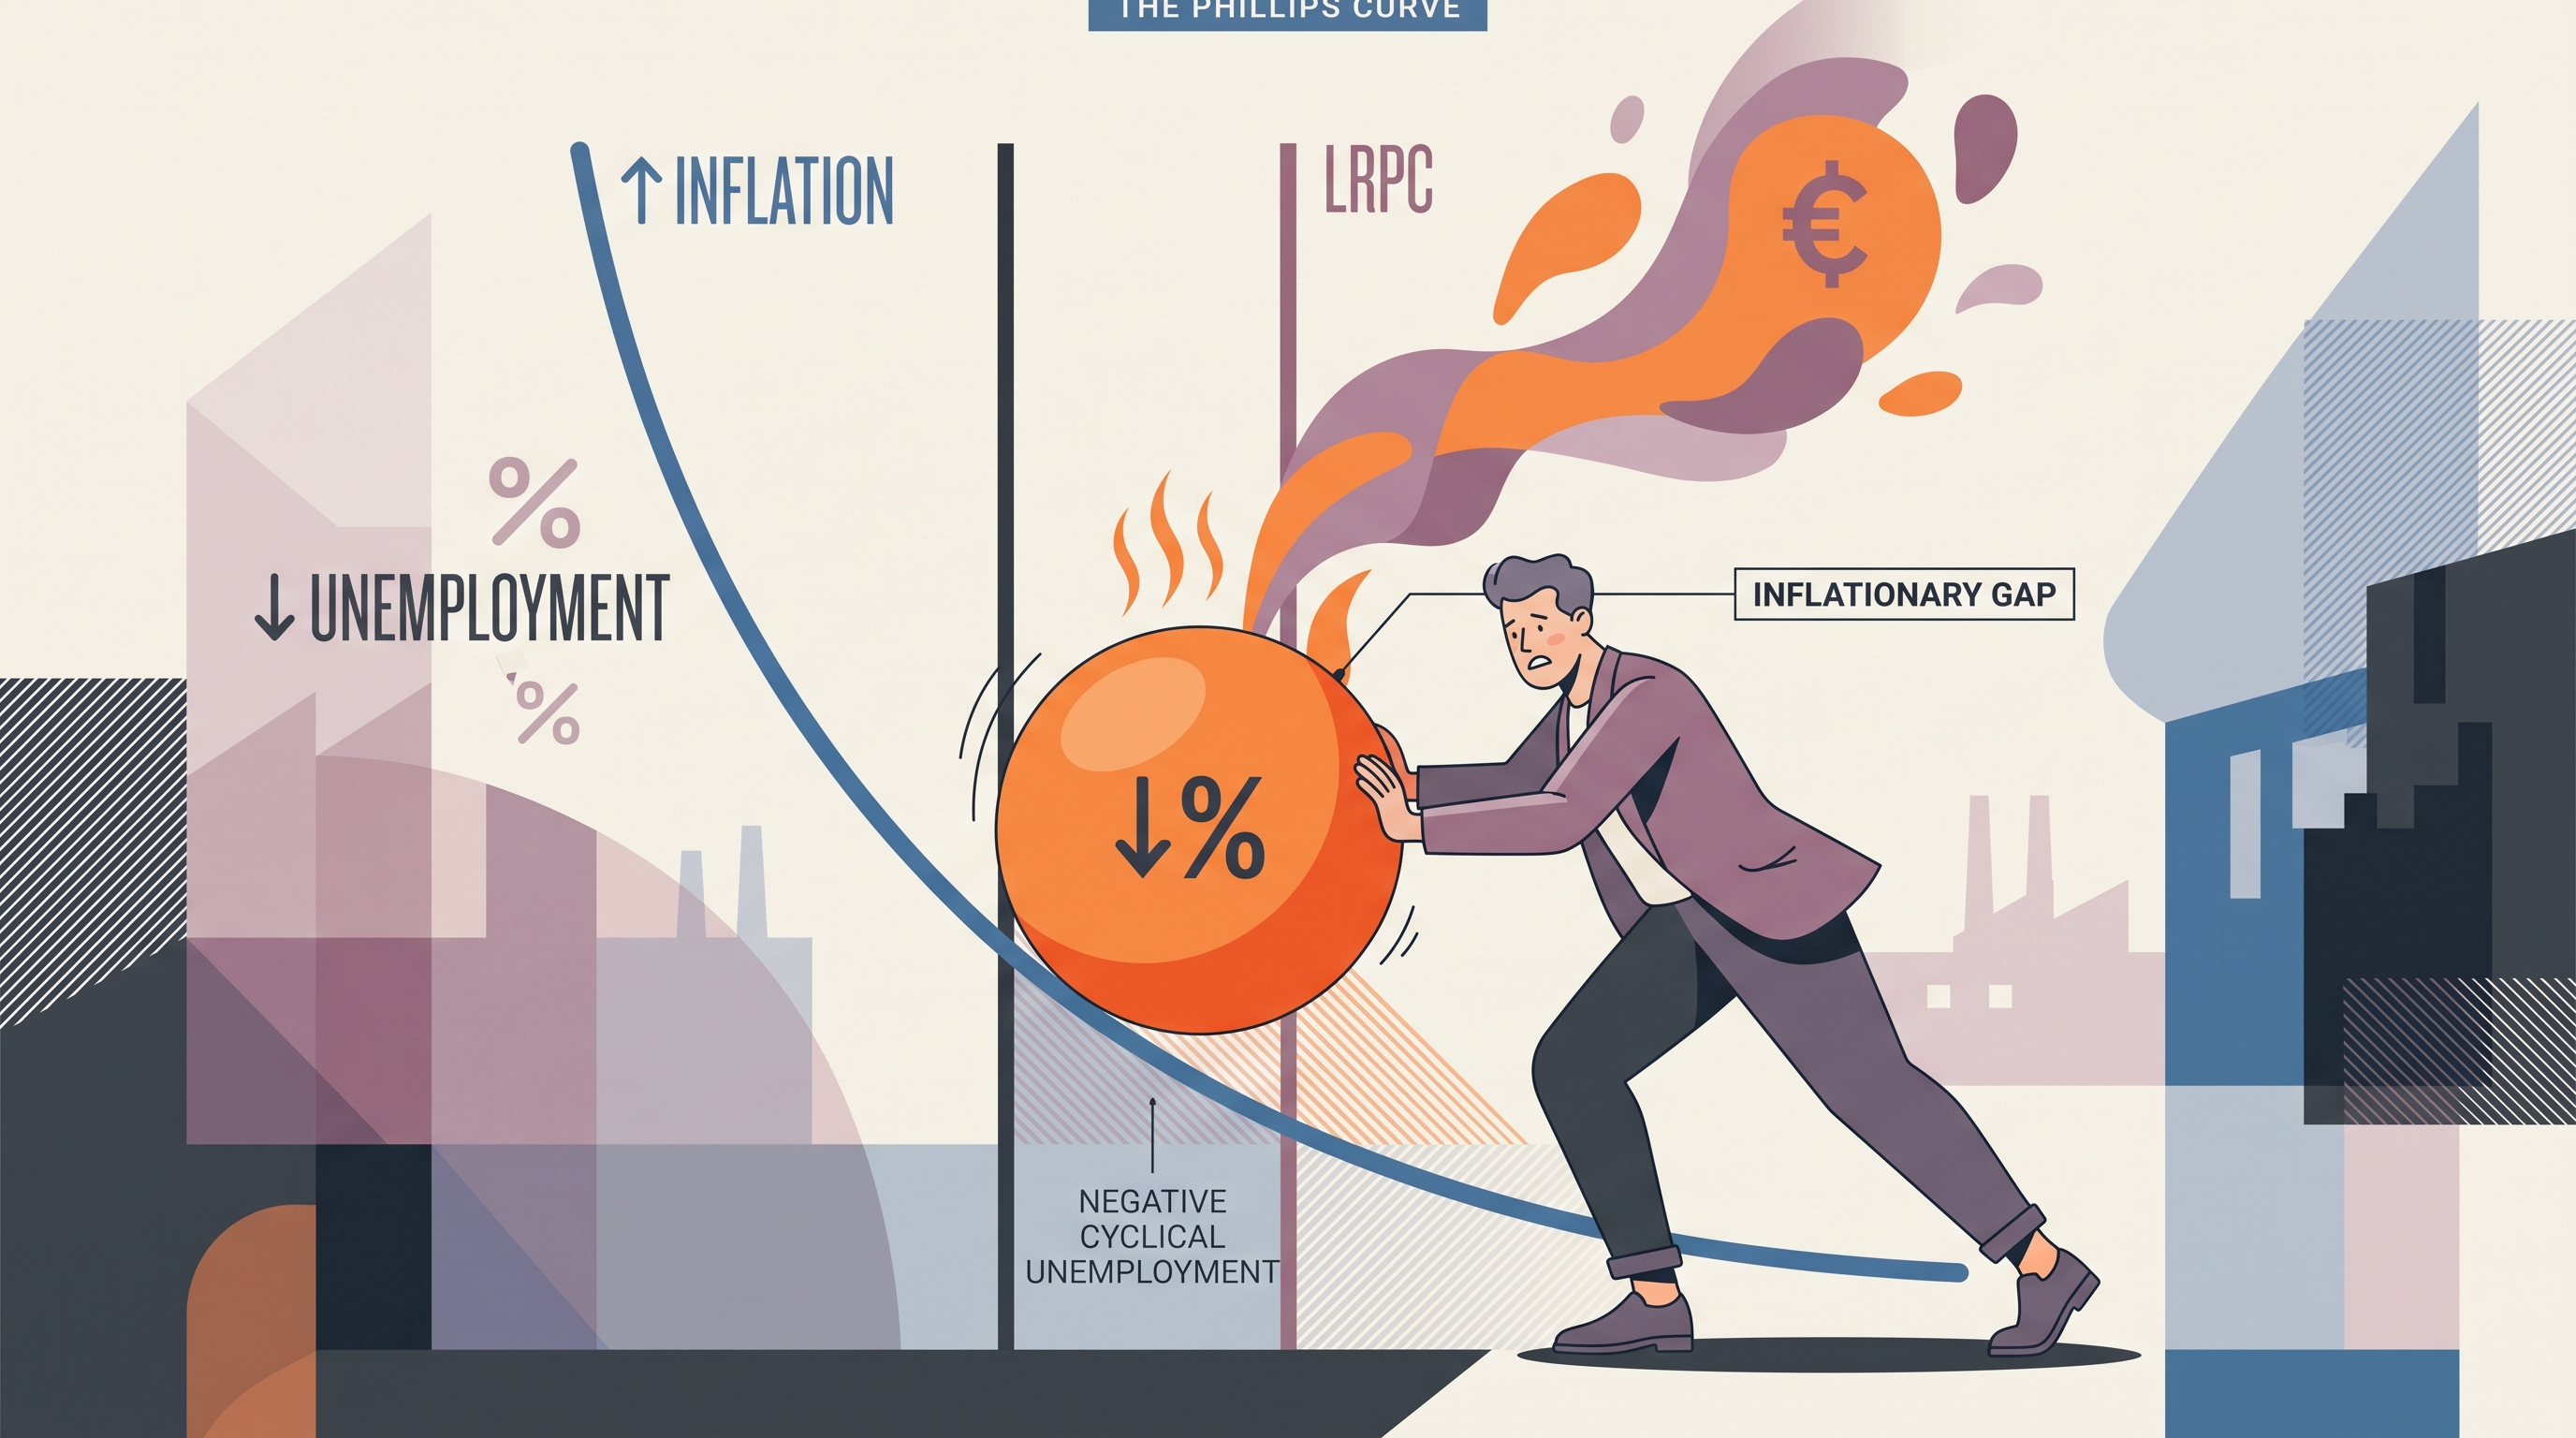
The long-run Phillips curve (LRPC) is vertical at the natural rate of unemployment. In the long run, there is no permanent trade-off between inflation and unemployment. Changes in aggregate demand may move the economy to a different point on a short-run curve, but unemployment ultimately returns to the natural rate.
The intersection of the SRPC and LRPC represents long-run equilibrium. Points to the left of the LRPC have unemployment below the natural rate and represent an inflationary gap. Points to the right have unemployment above the natural rate and represent a recessionary gap; this distinction is formalized in MOD-3.A.5.
Natural versus actual unemployment
Natural unemployment is the unemployment that remains even when the economy is producing at full employment. It consists of frictional unemployment, caused by normal job search and transitions, plus structural unemployment, caused by a mismatch between workers’ skills or locations and available jobs:
$$ \text{Natural unemployment}=\text{frictional unemployment}+\text{structural unemployment} $$
The natural rate of unemployment is the natural amount expressed as a percentage of the labor force. The actual unemployment rate is the unemployment rate currently observed in the economy. Their difference is cyclical unemployment, which rises during recessions and falls during expansions:
$$ \text{Cyclical unemployment}=\text{Actual unemployment rate}-\text{Natural rate of unemployment} $$
Therefore, the correct relationship is:
$$ \text{Actual unemployment rate}=\text{Natural rate of unemployment}+\text{Cyclical unemployment} $$
Structural unemployment is already included in the natural rate. It must not be added again.
Misconception check: The actual unemployment rate is not calculated by adding cyclical, natural, and structural unemployment. It is also not calculated by adding only cyclical and structural unemployment. Adding structural unemployment separately double-counts it because structural unemployment is already part of the natural rate.
Reading points on the graph
Suppose an economy’s natural rate of unemployment is $6%$. A temporary boom reduces the actual unemployment rate to $4%$, while inflation rises to $7%$. On the Phillips curve graph, locate the point at $4%$ unemployment and $7%$ inflation. Because $4%$ is below the natural rate, the point lies to the left of the vertical LRPC and represents an inflationary gap.
The cyclical unemployment rate is:
$$ 4%-6%=-2% $$
A negative cyclical unemployment rate does not mean that total unemployment is negative. It means actual unemployment is $2$ percentage points below the natural rate.
Now consider a supply shock, such as a sudden increase in energy costs. A supply shock raises firms’ production costs and can create higher inflation and higher unemployment simultaneously. In the Phillips curve model, this is represented by a shift of the SRPC, not movement along the existing SRPC. By contrast, a demand shock corresponds to movement along the SRPC (MOD-3.B.1 and MOD-3.B.2).
Why the LRPC can move
The LRPC shifts when the natural rate of unemployment changes. For example, widespread improvements in job-matching technology could reduce frictional unemployment, shifting the LRPC leftward. A lasting increase in skill mismatch could raise structural unemployment, shifting the LRPC rightward (MOD-3.B.3).
This is why the natural rate is not a fixed unemployment number. It depends on labor-market institutions, worker skills, geographic mobility, information about jobs, and the time required to match workers with employers.
Graphing protocol
For an AP graph, label the vertical axis Inflation rate (%) and the horizontal axis Unemployment rate (%). Draw a downward-sloping SRPC, a vertical LRPC at the natural rate, and label the relevant point on the SRPC. Then state whether the point lies left or right of the LRPC and connect that position to an inflationary or recessionary gap.
A complete explanation might read: “The point lies to the right of the LRPC, so the actual unemployment rate exceeds the natural rate. Cyclical unemployment is positive, indicating a recessionary gap.” This graph-and-causal-chain work is connected to the topic’s official learning objectives OD-3, MKT-4, POL-3, GMEA-2, AMOD-3, and BPOL-3.
Retrieval check
An economy has a natural rate of unemployment of $5%$ and an actual unemployment rate of $3%$. Is cyclical unemployment positive or negative? Where is the point located relative to the LRPC, and what type of gap does it represent?
Answer: Cyclical unemployment is $3%-5%=-2%$. The point lies to the left of the LRPC and represents an inflationary gap.
Source Materials
- AP Macroeconomics Course and Exam Description
- AP Macroeconomics Course and Exam Description Clarifications and Corrections
- AP Macroeconomics Course Overview
- AP Macroeconomics Course at a Glance
- AP Macroeconomics Course at a Glance Poster
- AP Macroeconomics
- AP Macroeconomics
- AP Macroeconomics Sample Syllabus 1
- For the second point, the graph must include a vertical long-run Phillips curve (LRPC) at the natural rate of unemployment (5%) and must include point X on the SRPC to the right of the LRPC at the act
- For the second point, the graph must include a correctly labeled long-run Phillips curve (LRPC) and show point X on the SRPC to the left of the LRPC.
- For the second point, the graph must include a vertical long-run Phillips curve (LRPC) at the natural rate of unemployment (5%) and must include point X on the SRPC to the right of the LRPC at the act
- Point 2 The graph must include a correctly labeled long-run Phillips curve (LRPC) and show a point labeled P at the intersection of the short-run and long-run Phillips curves.