From the free course AP Macroeconomics on Lykke
1.5 Supply
A bakery supplies more loaves when the selling price rises because each additional loaf becomes more rewarding to produce. Supply is the relationship between the price of a good or service and the quantity producers are willing and able to sell during a specific period, holding other relevant factors constant.
Law of supply: As price rises, quantity supplied generally rises; as price falls, quantity supplied generally falls, ceteris paribus—with all other conditions unchanged.
The key phrase is quantity supplied: it means the amount producers offer at one particular price. A change in the product’s own price causes a movement along the existing supply curve, not a shift of the curve.
Reading an individual supply curve
Suppose one bakery’s daily supply schedule is:
| Price per loaf | Quantity supplied |
|---|---|
| $2 | 80 loaves |
| $3 | 120 loaves |
| $4 | 160 loaves |
On a graph, price is placed on the vertical axis and quantity on the horizontal axis. The upward-sloping supply curve shows that higher prices create an incentive to produce more: the bakery may schedule extra workers, run ovens longer, or use less convenient production methods.
Price
  ^
$4|                         ●
  |                    /
$3|              ●    /
  |            /
$2|      ●    /
  |       /
  +--------------------------------> Quantity
        80       120       160
              loaves per day
If the price rises from $2 to $4, quantity supplied increases from 80 to 160 loaves per day. This is an increase in quantity supplied, represented by movement upward and to the right along the same supply curve. It is not an “increase in supply.”
Market supply: adding producers
Market supply is the total quantity supplied by all producers at each possible price. To construct it, add producers’ quantities horizontally—that is, add the quantities supplied at the same price.
At a price of $3, imagine three bakeries supply 120, 50, and 30 loaves per day. The market quantity supplied is therefore
$$ 120+50+30=200\text{ loaves per day}. $$
The unit matters: $3 is the price, while 200 loaves per day is the quantity. A quantity cannot be reported in dollars unless the question specifically asks for the value of output.
Shifts in supply
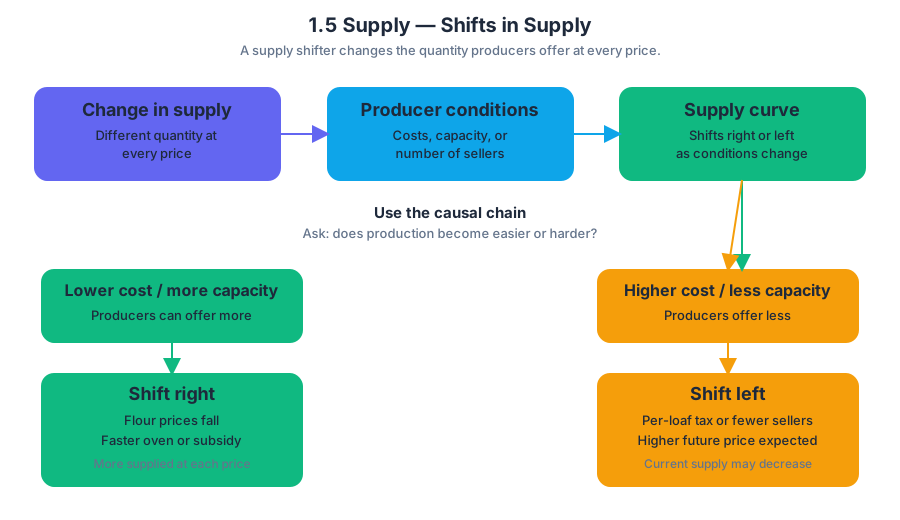
A change in supply shifts the entire supply curve because producers now offer a different quantity at every price. Factors that can shift supply include input prices, technology, taxes or subsidies, expectations, the number of sellers, and conditions affecting production.
Use the following causal chain to predict the direction of a shift:
| Change | Producer cost or capacity | Supply curve |
|---|---|---|
| Flour prices fall | Production becomes less costly | Shifts right |
| A faster oven is invented | More can be produced with the same resources | Shifts right |
| A per-loaf tax is imposed | Cost per loaf rises | Shifts left |
| A production subsidy is introduced | Effective cost falls | Shifts right |
| Several bakeries exit the market | Fewer sellers remain | Shifts left |
| Producers expect a higher future price | They may hold inventory now | Current supply may shift left |
Worked example. A bakery’s oven becomes 25% more energy-efficient. At a price of $3, it can now profitably produce 150 loaves instead of 120; at every other price, its feasible or profitable quantity is also greater. Because the change affects the quantities offered across the entire schedule, supply shifts right. The price of bread itself did not cause this shift—the technology did.
Misconception check: supply is not inventory
Named misconception — “Supply means the stock sitting on shelves.” Inventory is a quantity of goods already produced. Supply is a planned relationship between possible prices and quantities producers are willing and able to sell. A warehouse full of bread does not automatically mean the supply curve has shifted right; the reason for the inventory change matters.
Another common error is reversing the roles of price and quantity. A higher market price causes an increase in quantity supplied, while lower input costs, improved technology, or more sellers cause an increase in supply. Keep the diagnostic question precise: Did the product’s own price change, or did a nonprice determinant change?
AP skills and reasoning processes
Supply questions commonly assess Skill Category 1: Principles and Models, especially 1.A Define economic concepts, principles, or models and 1.B Explain economic concepts, principles, or models. You must distinguish supply from quantity supplied and connect a determinant—such as an input price or tax—to the correct curve movement.
They also use Skill Category 2: Interpretation, including 2.A Identify economic concepts, principles, or models and 2.B Describe economic concepts, principles, or models, when you read a schedule or graph. Skill Category 3: Manipulation, particularly 3.A Determine the effect of an economic change using quantitative analysis, applies when you add firms’ quantities or interpret numerical schedules. Skill Category 4: Graphing and Visuals, especially 4.A Draw a correctly labeled graph or visual, applies when you label price, quantity, the supply curve, and a directional shift accurately.
Retrieval check
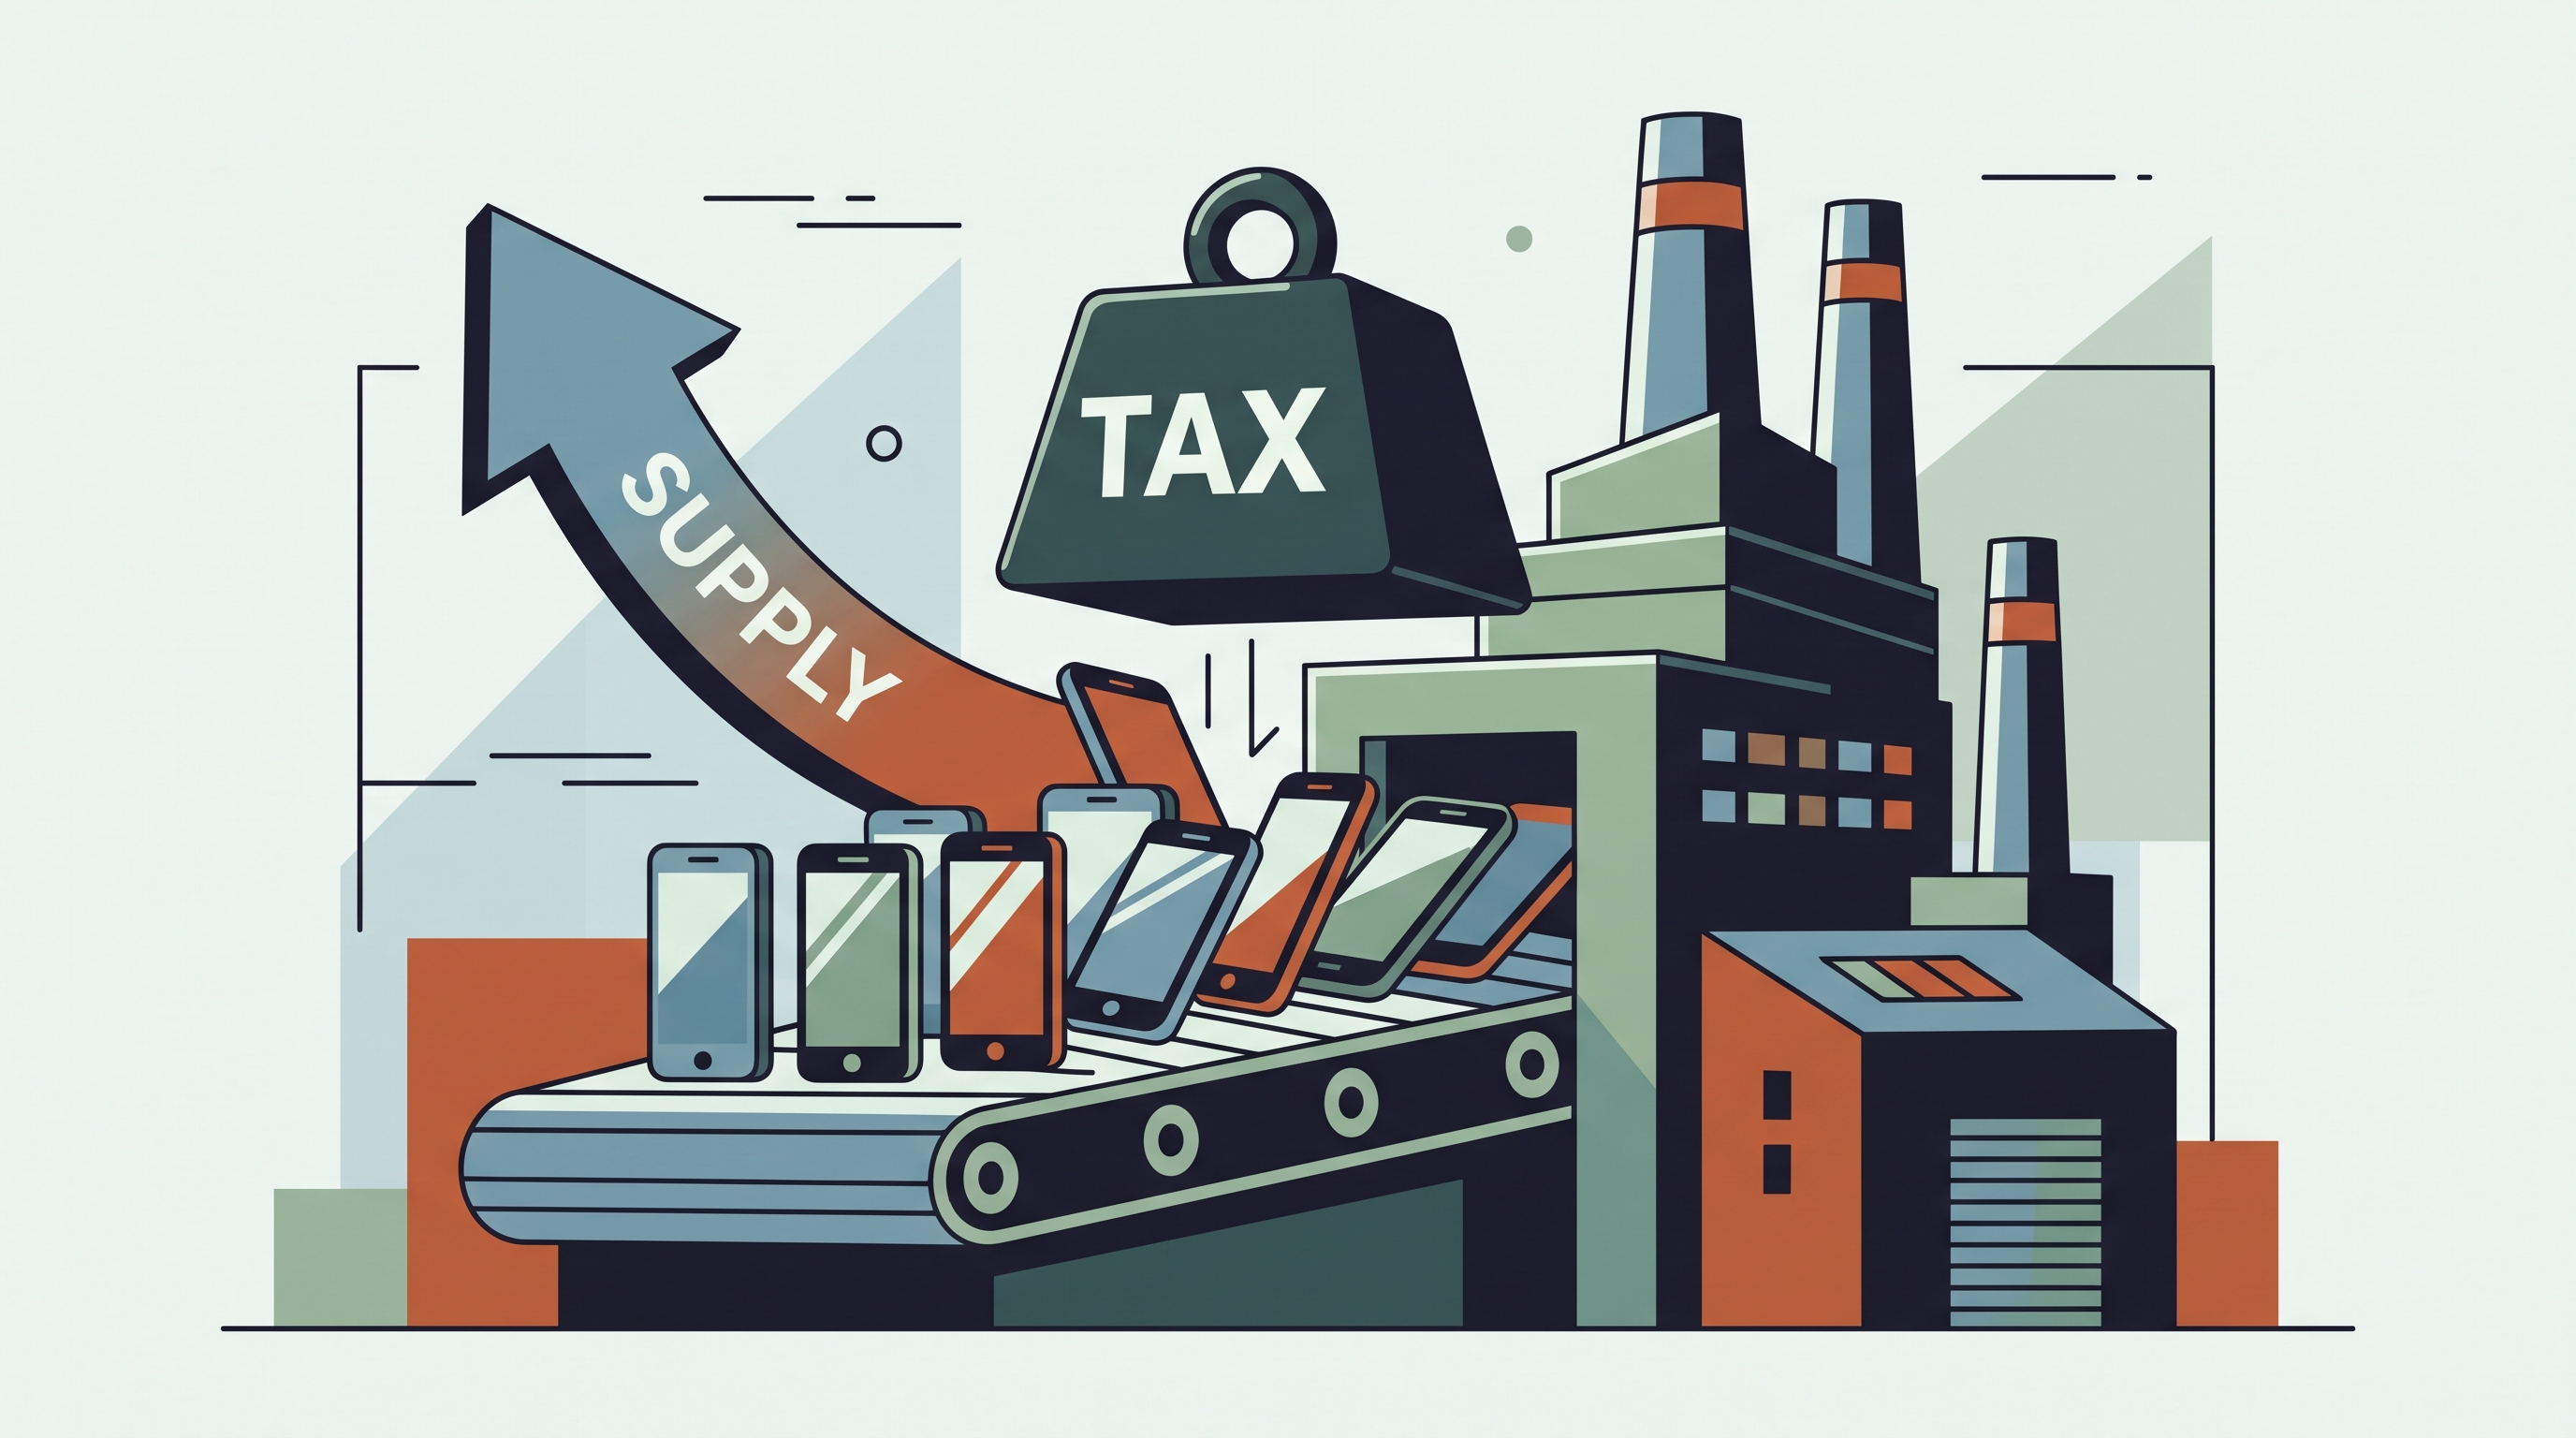
A new tax raises the cost of producing each smartphone. Does the supply curve shift, or does the economy move along the existing curve? Answer: The supply curve shifts left because a nonprice determinant—production cost—changed. A movement along the curve would require a change in the smartphone’s own price.
Source Materials
- AP Macroeconomics Course and Exam Description
- AP Macroeconomics Course and Exam Description Clarifications and Corrections
- AP Macroeconomics Course Overview
- AP Macroeconomics Course at a Glance
- AP Macroeconomics Course at a Glance Poster
- AP Macroeconomics
- AP Macroeconomics
- AP Macroeconomics Sample Syllabus 1