From the free course AP Macroeconomics on Lykke
4.5 The Money Market
Key concepts: The money market · Money creation process · Money market versus reserve market · Interest rates and investment spending · Surpluses and shortages in a market · Transmission mechanisms linking policy actions to macroeconomic outcomes · Graphical analysis of markets · Fixed-interest-rate borrowers and inflation
The money market determines the economy’s nominal interest rate—the stated price paid to borrow money—through the interaction of the quantity of money people want to hold and the quantity available.
4.5 The Money Market
The money market determines the economy’s nominal interest rate—the stated price paid to borrow money—through the interaction of the quantity of money people want to hold and the quantity available. Its central question is simple: At what interest rate will money supplied equal money demanded?
CED traceability: Topic 4.5 The Money Market; Enduring Understanding MEA-3; Learning Objective MEA-3.D; Essential Knowledge MEA-3.D.1, MEA-3.D.2, and MEA-3.D.3. The topic emphasizes AP Skills 1.D: Describe the similarities, differences, and limitations of economic concepts, principles, or models, 3.A: Explain economic concepts, principles, or models, 3.B: Explain how a change in an economic situation affects a specific economic outcome, and 3.C: Calculate economic outcomes.
The money market model
Imagine households and businesses carrying a certain amount of cash or checking-account money because money is useful for purchases. Holding money, however, has an opportunity cost: funds kept as money do not earn the interest that could be earned in a bond or interest-bearing account. As the nominal interest rate rises, people generally hold less money and shift more wealth into interest-bearing assets.
Money demand is the quantity of money people choose to hold at each nominal interest rate. Money supply is the quantity of money available in the economy at each nominal interest rate.
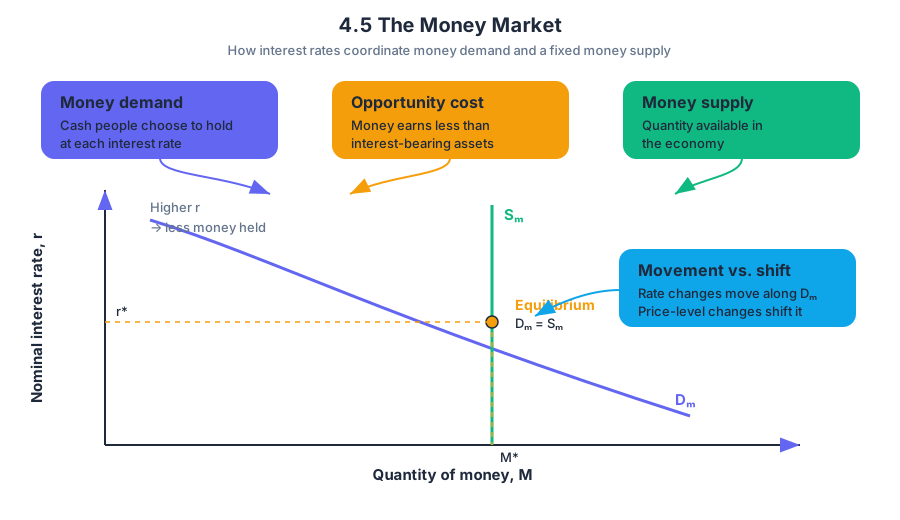
In the standard money-market graph, the vertical axis is the nominal interest rate, $r$, and the horizontal axis is the quantity of money, $M$. The money-demand curve, $D_M$, slopes downward because a higher interest rate raises the opportunity cost of holding money. The money-supply curve, $S_M$, is vertical when the central bank fixes the quantity of money.
The intersection of $D_M$ and $S_M$ gives equilibrium: the equilibrium quantity of money and the equilibrium nominal interest rate. A change in the interest rate caused by movement along $D_M$ is not a shift in money demand. A shift occurs only when a determinant such as the price level changes.
Surpluses and shortages
A surplus of money occurs when the quantity of money supplied exceeds the quantity demanded at a particular interest rate. On the graph, this appears when the vertical distance from $S_M$ to $D_M$ indicates $M_S>M_D$. People attempt to reduce excess money holdings by purchasing bonds and other financial assets; bond prices rise, and the nominal interest rate falls toward equilibrium.
A shortage of money occurs when the quantity of money demanded exceeds the quantity supplied, or $M_D>M_S$. People try to obtain money by selling bonds or other assets. Bond prices fall, pushing the nominal interest rate upward until the quantity demanded equals the quantity supplied.
Worked example. Suppose the money supply is fixed at $500$ units. At a nominal interest rate of $8%$, households want to hold $650$ units. The market has a money shortage of
$$M_D-M_S=650-500=150\text{ units}.$$
People sell assets to acquire the missing $150$ units. The resulting decline in bond prices raises interest rates, reducing the quantity of money demanded. This is the complete adjustment mechanism—not merely “the interest rate increases.”
Money market versus reserve market
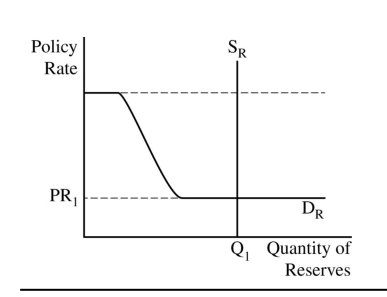
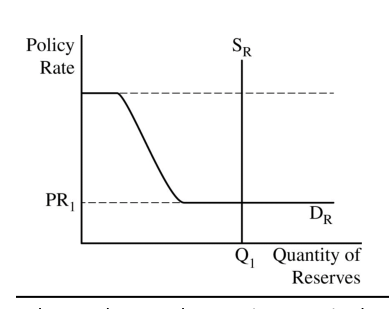
The money market analyzes the public’s demand for money and the economy’s total money supply. The reserve market analyzes commercial banks’ reserves—funds held at the central bank—and the interest rate used to influence banks’ lending behavior. These are related markets, but they are not interchangeable.
| Feature | Money market | Reserve market |
|---|---|---|
| Traded or analyzed quantity | Money held by the public | Bank reserves |
| Main demanders | Households and firms | Commercial banks |
| Vertical axis commonly used | Nominal interest rate | Policy or reserve-market interest rate |
| Typical policy connection | Money supply changes affect interest rates | Administered rates or reserve operations affect banks |
| Common graph error | Labeling reserves as money | Drawing the money-demand curve instead of reserve demand |
Misconception check — “The money market is the reserve market.” It is not. A question asking how households’ money holdings respond to interest rates requires a money-market graph. A question asking how a central bank changes the rate paid on reserves, or how banks respond to reserves, requires a reserve-market graph.
From money creation to macroeconomic outcomes
The “Case of the Gigantic $100,000 Bill” activity illustrates why one deposit can support a larger total money supply. When a bank receives a deposit, it keeps required reserves and lends the remainder. The borrower spends the loan, another person deposits those funds, and a second bank keeps part as reserves and lends the rest. Repeated redepositing and relending expands deposits through the banking system.
If the required reserve ratio is $rr$, the simple maximum-deposit multiplier is
$$\text{Money multiplier}=\frac{1}{rr}.$$
For example, with $rr=0.20$, an initial new reserve deposit of $$100{,}000$ could support a maximum change in deposits of
$$\Delta M=\frac{1}{0.20}\times $100{,}000=$500{,}000.$$
This is a theoretical maximum: the process is smaller if banks hold excess reserves or if households keep some loan proceeds as currency. The important chain is deposit $\rightarrow$ bank lending $\rightarrow$ spending and redepositing $\rightarrow$ additional deposits.
Interest rates, investment, and aggregate demand
A money-market change matters because interest rates influence interest-sensitive spending. Suppose the central bank reduces the money supply. With money demand initially unchanged, the fixed $S_M$ curve shifts left. At the original interest rate, a shortage of money appears, causing the nominal interest rate to rise.
The transmission mechanism must be stated in sequence:
$$ S_M\text{ shifts left} \rightarrow r\text{ rises} \rightarrow \text{borrowing becomes more expensive} \rightarrow I\text{ falls} \rightarrow AD\text{ shifts left} \rightarrow \text{price level and real output fall in the short run}. $$
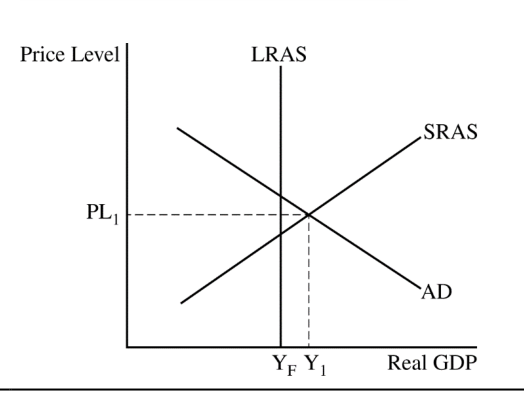
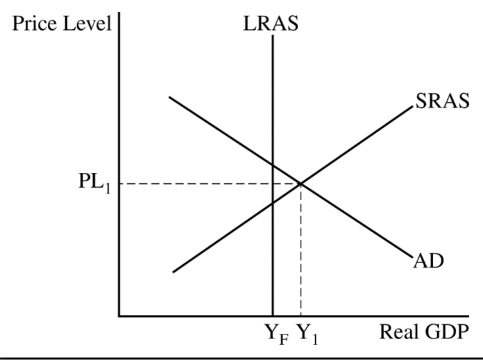
Businesses cancel or postpone projects such as factory expansion, equipment purchases, and building construction when financing costs rise. Because investment spending is a component of aggregate demand, lower investment shifts $AD$ left; saying only “the price level falls” omits the mechanism required for a complete explanation.
Inflation and fixed-rate borrowers
Unexpected inflation changes the real burden of a fixed-interest-rate loan. If a borrower receives money when its purchasing power is relatively high and repays the same nominal amount after prices rise, the repayment money buys fewer goods and services.
Borrowers with fixed-interest-rate loans benefit from unexpected inflation because the money repaid is worth less than the money borrowed.
The lender receives the promised nominal payment, but its real value is lower than anticipated. This is distinct from a variable-rate loan, whose interest rate can adjust as inflation expectations or market conditions change.
Retrieval check
At an interest rate of $6%$, suppose $M_D=900$ and $M_S=700$. Is the money market experiencing a surplus or shortage, and what happens to the interest rate? Answer: There is a shortage of $200$ units because $M_D-M_S=200$. People sell assets to obtain money, bond prices fall, and the nominal interest rate rises. If the original disturbance was a fall in the money supply, identify it as a shift of $S_M$, not a movement along the curve.

Source Materials
- AP Macroeconomics Course and Exam Description
- AP Macroeconomics Course and Exam Description Clarifications and Corrections
- AP Macroeconomics Course Overview
- AP Macroeconomics Course at a Glance
- AP Macroeconomics Course at a Glance Poster
- AP Macroeconomics
- AP Macroeconomics
- AP Macroeconomics Sample Syllabus 1
- Point 4 The graph must show a decrease in the administered interest rates, resulting in a decrease in the policy rate.
- Point 3 The graph must show an increase in the administered interest rates, resulting in an increase in the policy rate.
- Calculate the minimum change in government spending as a decrease of $8 and show your work.
- Calculate the minimum change in government spending as a decrease of $8 and show your work.