From the free course AP Macroeconomics on Lykke
4.7 The Loanable Funds Market
Key concepts: Loanable funds market · Demand for loanable funds · Supply of loanable funds · Quantity of loanable funds demanded and supplied · National savings · Real interest rate · Market equilibrium · Surpluses and shortages in the loanable funds market · Government borrowing · Crowding out of private investment
The loanable funds market determines the equilibrium real interest rate—the interest rate adjusted for inflation—through the interaction of borrowers and savers. Borrowers demand funds to finance investment and government borrowing; savers supply funds by postponing current consumption.
4.7 The Loanable Funds Market
The loanable funds market determines the equilibrium real interest rate—the interest rate adjusted for inflation—through the interaction of borrowers and savers. Borrowers demand funds to finance investment and government borrowing; savers supply funds by postponing current consumption.
Enduring Understanding MKT-4: The interaction of borrowers, who demand loanable funds, and savers, who supply loanable funds, determines the equilibrium real interest rate.
The market’s two sides
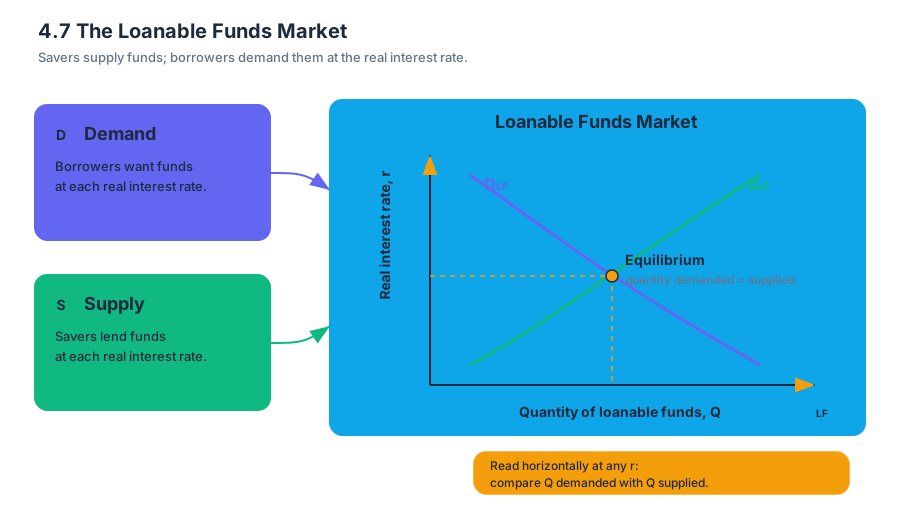
The demand for loanable funds is the relationship between the real interest rate and the quantity of funds borrowers want at that rate. Because borrowing becomes more expensive when the real interest rate rises, the quantity of loanable funds demanded falls. This is an inverse relationship, so the demand curve slopes downward.
The supply of loanable funds is the relationship between the real interest rate and the quantity of funds savers are willing to lend at that rate. A higher real interest rate rewards saving more generously, so the quantity of loanable funds supplied rises. This positive relationship produces an upward-sloping supply curve.
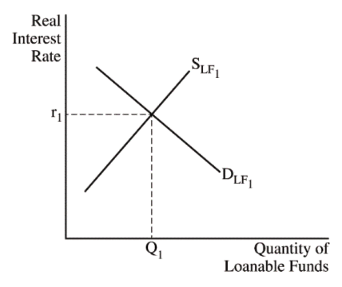
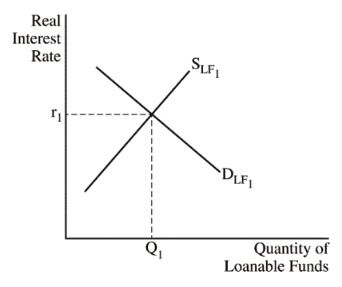
In the standard graph, the vertical axis measures the real interest rate, $r$, and the horizontal axis measures the quantity of loanable funds, $Q_{LF}$. The downward-sloping demand curve is labeled $D_{LF}$, and the upward-sloping supply curve is labeled $S_{LF}$. At any particular real interest rate, read horizontally to determine the quantity demanded and the quantity supplied.
MKT-4.A.1: The loanable funds market describes the behavior of savers and borrowers.
MKT-4.A.2: The demand curve shows the inverse relationship between the real interest rate and the quantity demanded of loanable funds.
MKT-4.A.3: The supply curve shows the positive relationship between the real interest rate and the quantity supplied of loanable funds.
National savings supplies funds
National savings is a major source of loanable funds. In a closed economy, where there is no international trade or capital movement, national savings equals public savings plus private savings:
$$ S_{\text{national}} = S_{\text{private}} + S_{\text{public}} $$
Private saving is income not spent on consumption or taxes. Public saving is the government’s budget surplus, calculated as tax revenue minus government purchases and transfer payments. A budget deficit creates negative public saving, reducing national saving when private saving does not change.
In an open economy, domestic investment can be financed by national saving and funds entering from abroad. The required relationship is:
$$ I = S_{\text{national}} + \text{net capital inflow} $$
MKT-4.B.1: In a closed economy, national savings is the sum of public and private savings.
MKT-4.B.2: In an open economy, investment equals national savings plus net capital inflow.
Equilibrium, surplus, and shortage
Equilibrium occurs where the quantity of loanable funds demanded equals the quantity supplied. The intersection of $D_{LF}$ and $S_{LF}$ determines both the equilibrium real interest rate, $r_1$, and the equilibrium quantity of loanable funds, $Q_1$.
If the real interest rate is above $r_1$, lenders want to supply more funds than borrowers want to use. The market has a surplus of loanable funds, placing downward pressure on the real interest rate. If the real interest rate is below $r_1$, borrowers demand more funds than savers supply. The resulting shortage places upward pressure on the real interest rate.
MKT-4.C.1: Equilibrium occurs where the quantity of loanable funds demanded equals the quantity supplied.
MKT-4.D.1: Disequilibrium produces surpluses or shortages, and market forces move the real interest rate toward equilibrium.
Shifts: saving behavior and government borrowing
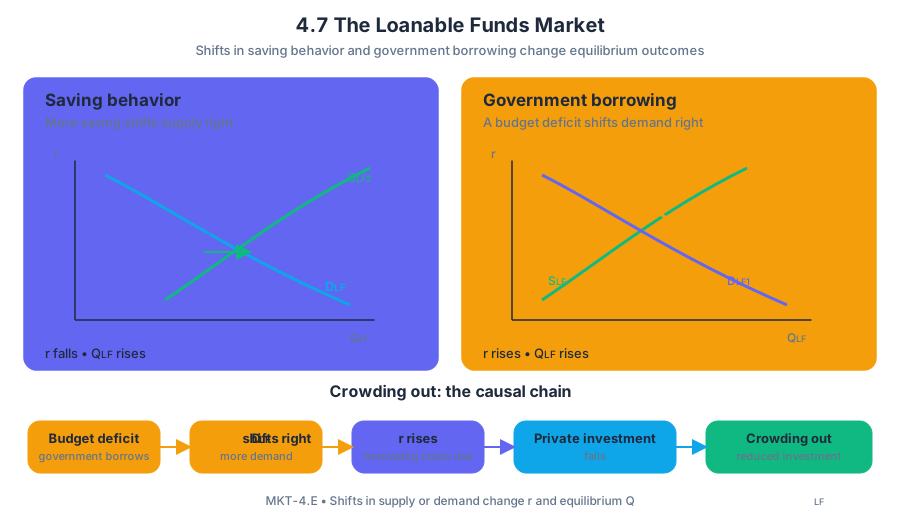
A change in the real interest rate causes a movement along an existing curve. A change in saving behavior changes the supply of loanable funds and shifts $S_{LF}$. For example, if households decide to save more at every real interest rate, $S_{LF}$ shifts right. The equilibrium real interest rate falls, while the equilibrium quantity of loanable funds rises.
The reverse also follows: a decrease in national saving shifts $S_{LF}$ left, raising the equilibrium real interest rate and lowering the equilibrium quantity of loans. This is why a fall in saving can make borrowing more expensive even when borrowers’ desire for funds has not changed.
Government borrowing increases the demand for loanable funds. Suppose the government finances a budget deficit by borrowing. The demand curve shifts from $D_{LF1}$ to $D_{LF2}$:
- The equilibrium real interest rate rises from $r_1$ to $r_2$.
- The equilibrium quantity of loanable funds rises from $Q_1$ to $Q_2$.
- Higher borrowing costs reduce some private investment spending.
The reduction in private investment caused by government borrowing is crowding out. The complete causal chain is:
$$ \text{budget deficit} \rightarrow \text{increased government borrowing} \rightarrow D_{LF}\text{ shifts right} \rightarrow r\text{ rises} \rightarrow \text{private investment falls} $$
MKT-4.E: Changes in the demand for or supply of loanable funds change the equilibrium real interest rate and equilibrium quantity of loanable funds.
Misconception check
Misconception: “A deficit shifts the supply of loanable funds left.” A government deficit directly increases borrowing, so it shifts the demand for loanable funds right. It may also reduce national saving, which shifts supply left, but an answer must identify the specific mechanism described by the question.
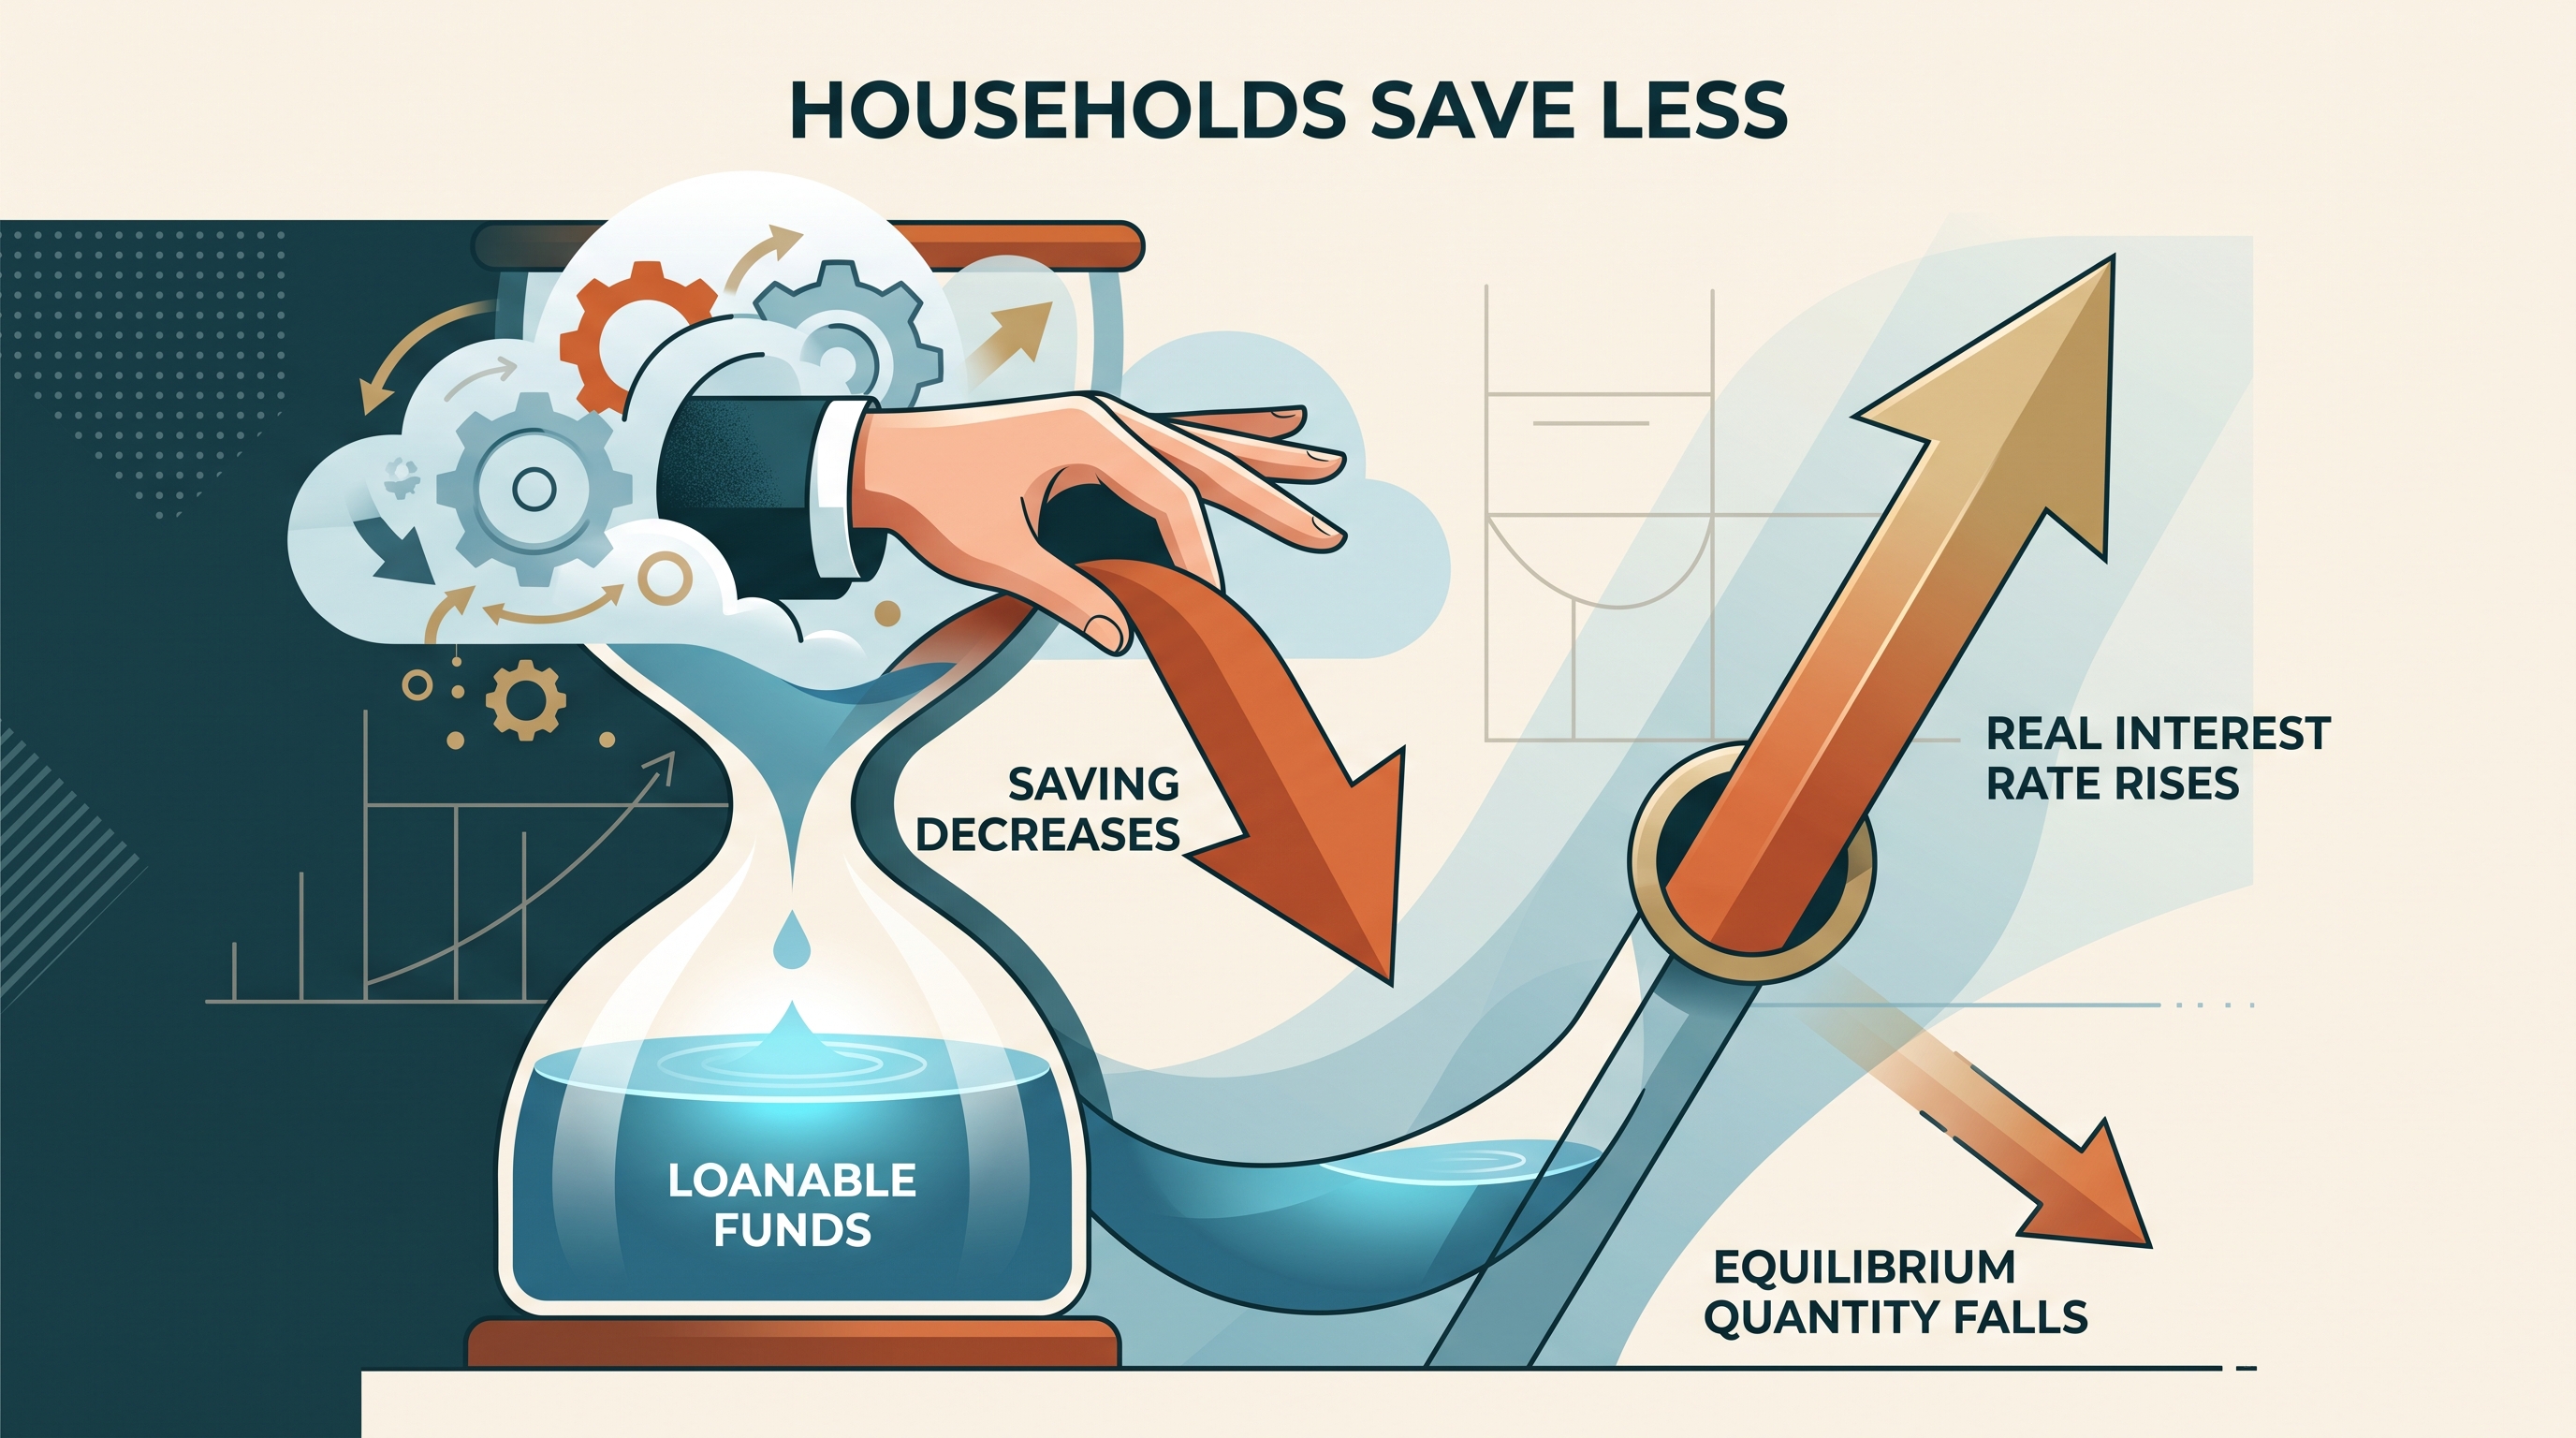
Retrieval check: On a correctly labeled loanable-funds graph, show what happens when households save less. Which curve shifts, and what happens to the equilibrium real interest rate and quantity of loanable funds? The answer is: $S_{LF}$ shifts left, the real interest rate rises, and the equilibrium quantity falls.
Source Materials
- AP Macroeconomics Course and Exam Description
- AP Macroeconomics Course and Exam Description Clarifications and Corrections
- AP Macroeconomics Course Overview
- AP Macroeconomics Course at a Glance
- AP Macroeconomics Course at a Glance Poster
- AP Macroeconomics
- AP Macroeconomics
- AP Macroeconomics Sample Syllabus 1
- For the second point, the graph must show an increase in the demand for loanable funds (or a decrease in the supply of loanable funds), resulting in an increase in the equilibrium real interest rate.
- For the second point, the graph must show an increase in the demand for loanable funds (or a decrease in the supply of loanable funds), resulting in an increase in the equilibrium real interest rate.
- (f) For the first point, state that the quantity of national savings would decrease and the unemployment rate would decrease.
- For the second point, the graph must show an increase in the demand for the ringgit (or a