From the free course AP Comparative Government and Politics on Lykke
5.4 Policies and Economic Liberalization
Key concepts: Economic liberalization · Economic globalization · Free-market mechanisms · Economic and political equality · Social cleavages · Economic development and growth · Human development, wealth, and inequality · Government responses to separatist violence, drug trafficking, and discrimination · Data analysis and limitations · Effects of liberalization on political policies and behaviors
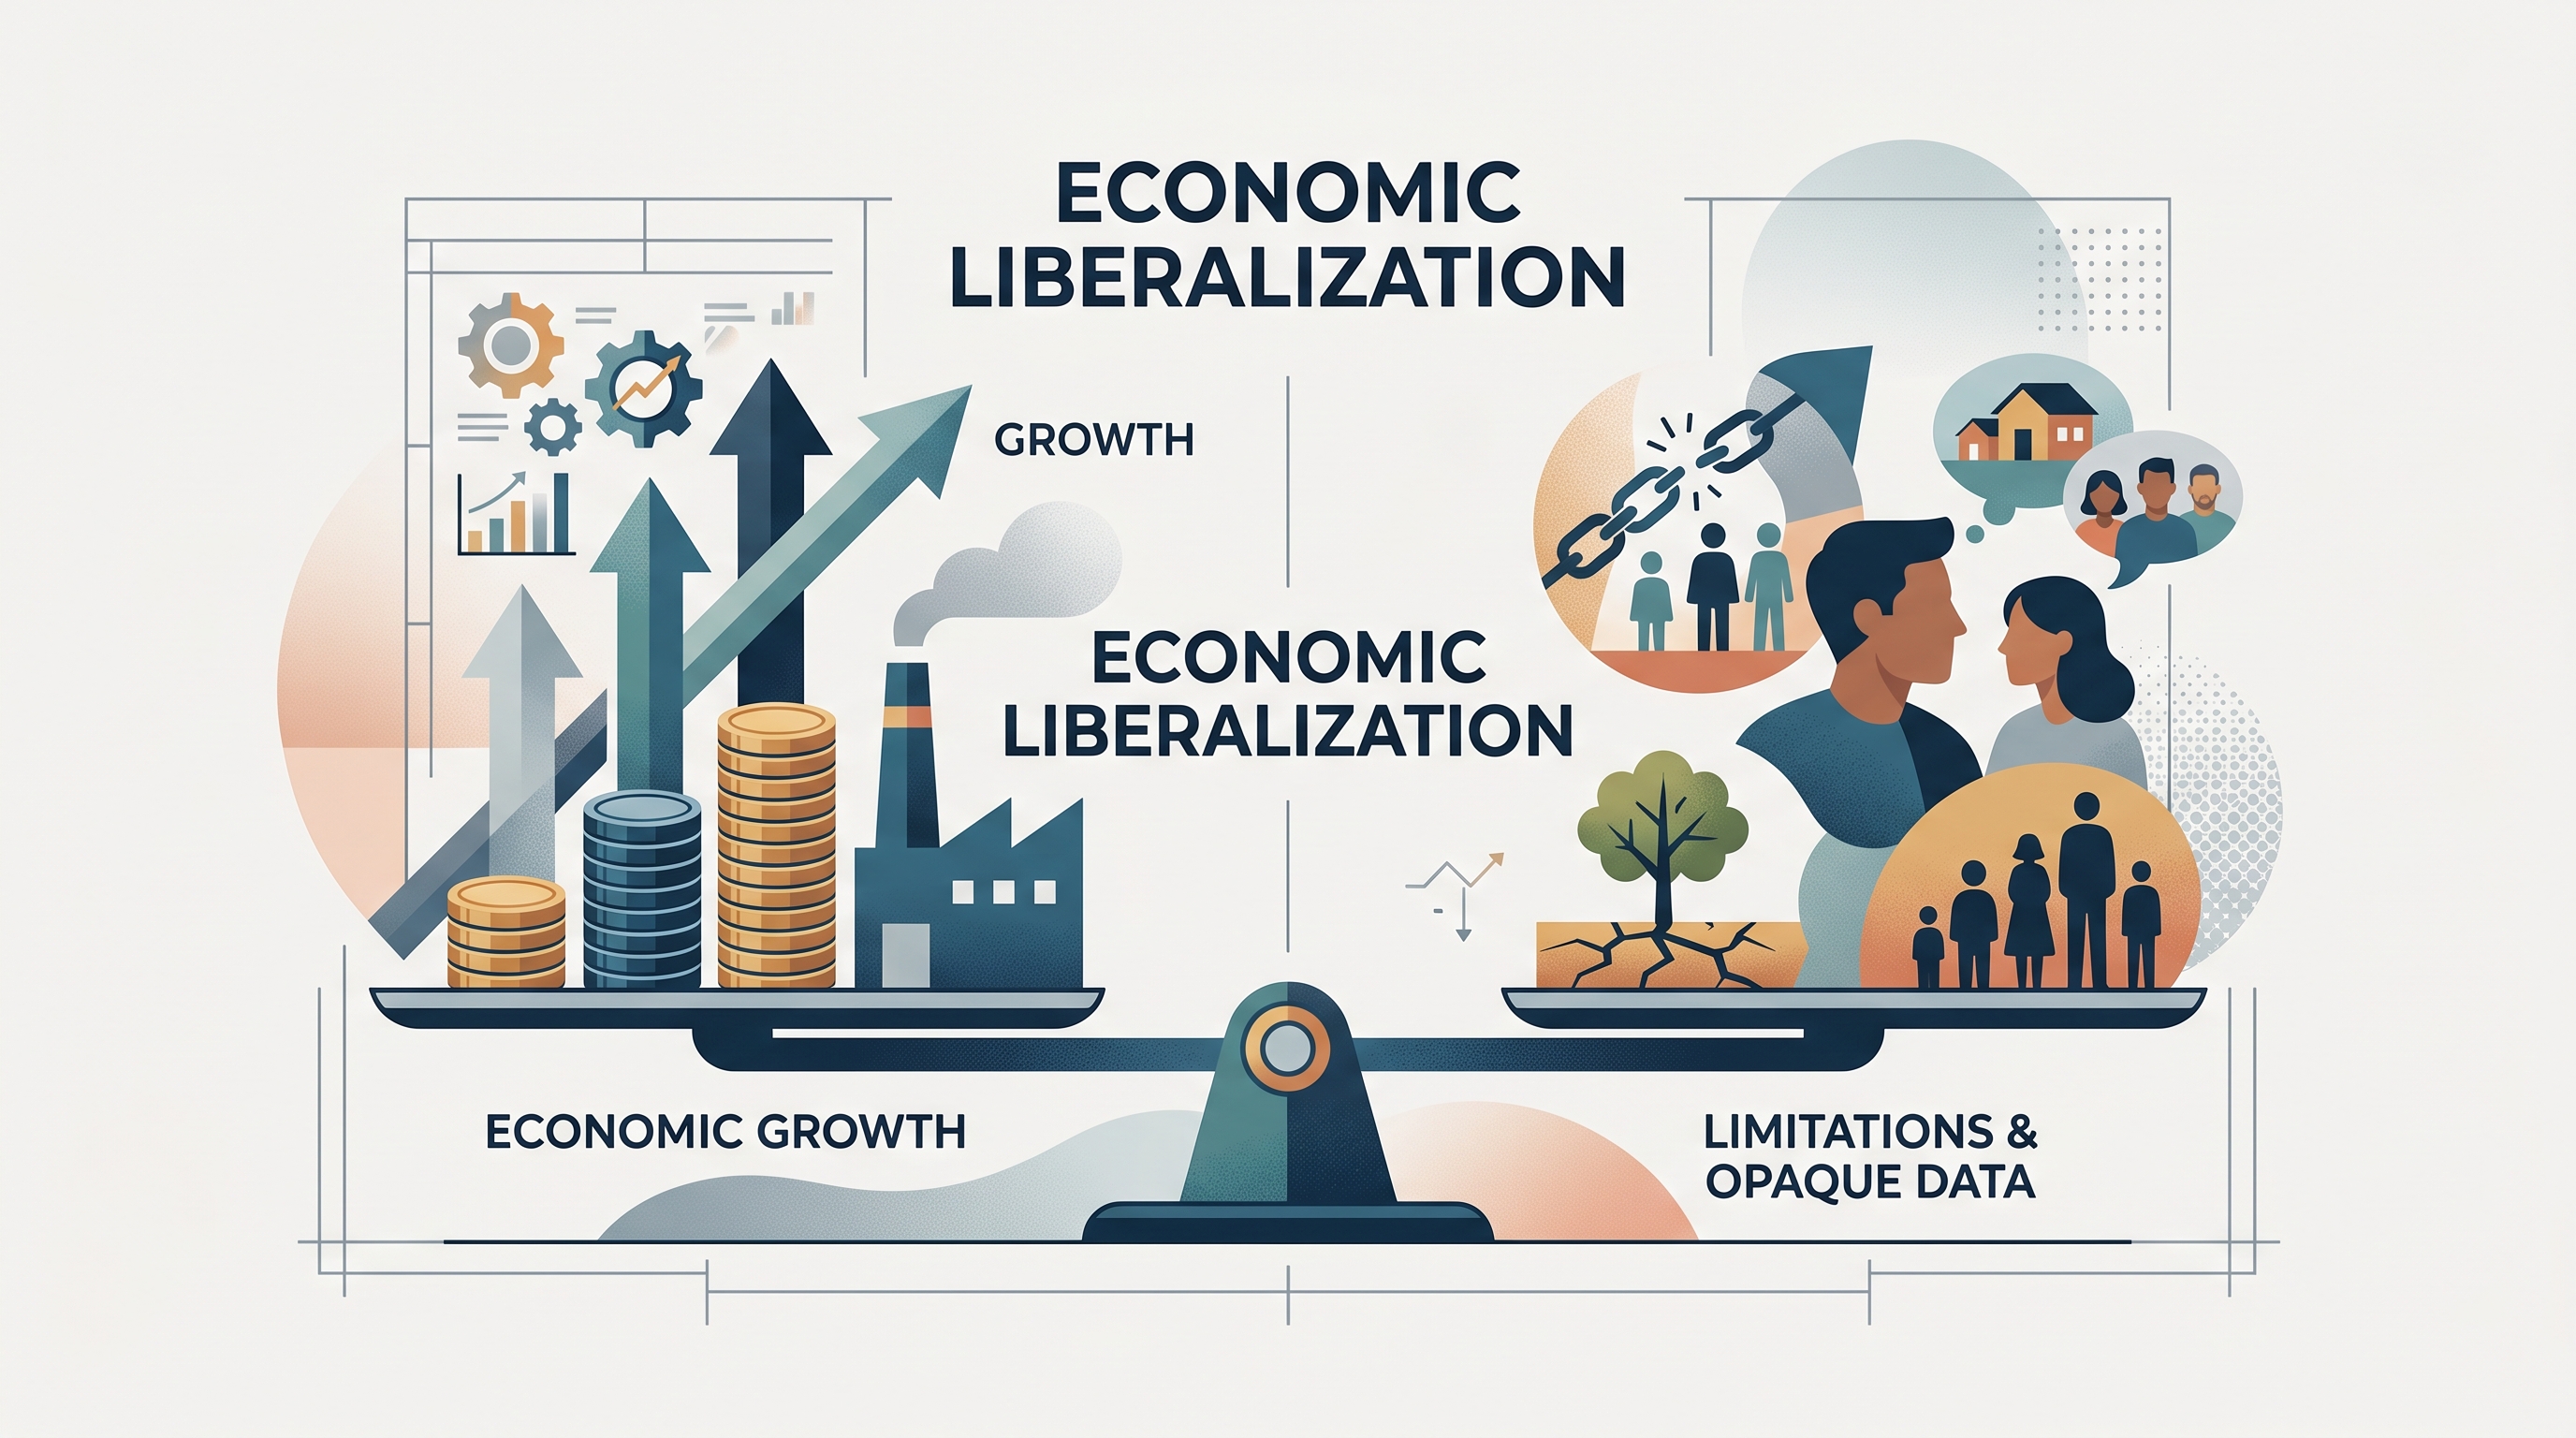
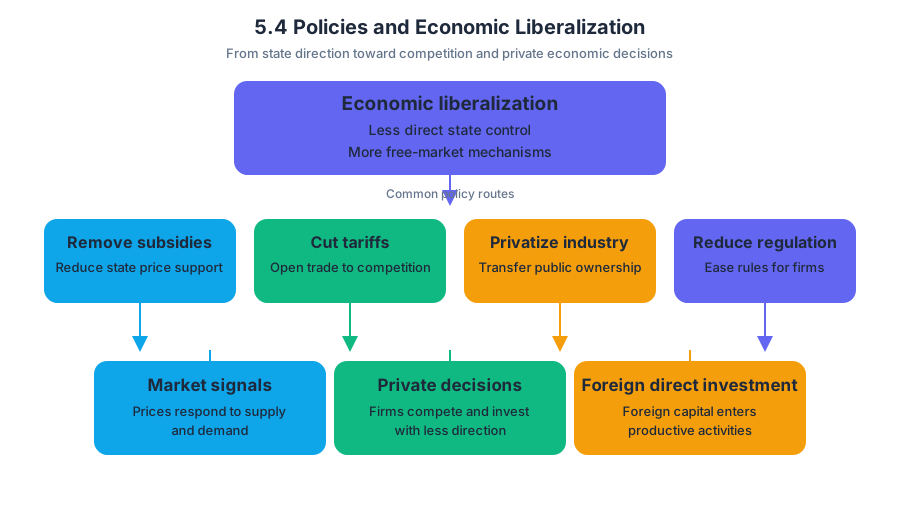
Economic liberalization occurs when a state reduces its direct control over the economy and expands the role of free-market mechanisms—systems in which prices, production, and investment are influenced more by competition and private decisions than by government direction.
5.4 Policies and Economic Liberalization
Economic liberalization occurs when a state reduces its direct control over the economy and expands the role of free-market mechanisms—systems in which prices, production, and investment are influenced more by competition and private decisions than by government direction.
A government may liberalize by eliminating subsidies and tariffs, privatizing government-owned industries, reducing regulations, and opening the economy to foreign direct investment, meaning investment by foreign companies or individuals in productive activities located inside the country.
What liberalization changes
Imagine a government-owned factory that sells fuel below its production cost because the state pays a subsidy. Liberalization might remove that subsidy, sell the factory to private owners, lower tariffs on imported fuel, and invite foreign companies to build competing facilities. The intended result is greater competition and investment; the immediate result may also be higher prices, layoffs, or pressure on domestic firms.
| Policy | What changes | Intended economic effect | Possible political or social cost |
|---|---|---|---|
| Remove subsidies | The state stops lowering prices or supporting producers | Reduce government spending and market distortion | Higher consumer prices or reduced access |
| Reduce tariffs | Imported goods face fewer border taxes | Increase trade and competition | Domestic industries may lose protection |
| Privatize industries | State-owned firms move into private ownership | Improve efficiency and attract investment | Job losses, corruption, or unequal ownership |
| Expand foreign investment | Foreign firms can build, buy, or finance businesses | Increase capital, technology, and employment | Greater dependence or pressure on state policy |
The policy does not belong exclusively to democracies. Democratic or authoritarian governments may adopt economic liberalization to promote prosperity, economic growth, or economic development. They may also use it to address inflation, attract investment, increase national income, or remedy domestic economic problems.
Freedom, equality, and political consequences
The central political dilemma is that economic freedom does not automatically produce economic or political equality. Neoliberal policies—policies that remove barriers and restrictions on what domestic and foreign economic actors may do—can reduce inflation and increase national income while also widening wealth inequality, preserving corruption, or intensifying existing social tensions.
The benefits and costs may be distributed unevenly across social cleavages, or politically important divisions among groups. A coastal region may gain factories and foreign investment while an inland region loses protected industries. Urban workers may find new employment while rural workers face lower agricultural subsidies. Ethnic, religious, gender, or regional groups may therefore experience the same national policy in sharply different ways.
Economic prosperity can also affect the power of ruling political parties. If liberalization produces visible growth, new jobs, or lower inflation, the governing party may gain support and legitimacy. If it produces unemployment, higher prices, corruption, or environmental damage, opposition movements may portray the same policy as evidence that the government serves investors rather than citizens.
Liberalization may stimulate growth while contributing to environmental pollution, urban sprawl, and uneven development. Economic globalization—cross-border networks involving trade, investment, workers, goods, and capital—can therefore influence political policies and political behavior in both positive and negative ways.
Worked contextual example: reading a liberalization claim
Suppose a report states that Mexico reduced tariffs, privatized several state-owned enterprises, and experienced rising national income after attracting foreign investment.
- Identify the policy: reduced tariffs, privatization, and foreign investment are mechanisms of economic liberalization.
- State the intended outcome: the government may be seeking growth, investment, efficiency, or development.
- Trace a political consequence: if growth creates jobs, the ruling party may gain support; if privatization causes layoffs or corruption, social opposition may increase.
- Check distribution: national income does not reveal whether benefits reached rural, urban, ethnic, gender, or regional groups equally.
- Qualify the conclusion: the report shows an association between liberalization and rising national income, but it does not prove liberalization alone caused the increase.
The same analytical caution applies when examining state responses to separatist group violence, drug trafficking, or discrimination based on gender or religious differences in Iran, Mexico, and Nigeria. Economic policy may alter opportunities and grievances, but a single economic indicator cannot establish the complete political cause of conflict or government behavior.
Data analysis: what the numbers show—and hide
Under Disciplinary Practice 3: Data Analysis, 3.D: Explain what the data implies or illustrates requires a claim tied directly to the evidence. If a graph shows that national income rises after liberalization, an accurate statement is: “The data illustrate an increase in national income during or after the policy change.” A stronger explanation connects that pattern to possible investment, trade, or productivity effects without claiming certainty.
3.E: Explain possible limitations of the data provided requires identifying what the evidence does not show. A national-income measure may omit wealth distribution, inequality, human development, environmental damage, informal employment, regional differences, and the experiences of marginalized groups. The identity and methods of the organization collecting the data may also influence the conclusion.
Misconception check — “Growth proves liberalization succeeded.” Growth measures expansion in economic activity; it does not by itself establish equality, human development, political stability, or improved living conditions. Liberalization can produce higher national income and still deepen inequality or intensify social cleavages.
Retrieval check: A country removes fuel subsidies, lowers tariffs, and permits foreign companies to purchase state-owned factories. Name the economic process, one intended benefit, and one limitation a national-income statistic might conceal. A complete response identifies economic liberalization, explains a possible gain such as investment or growth, and notes that the statistic may hide unequal distribution, unemployment, regional disparities, or environmental costs.

Source Materials
- AP Comparative Government and Politics Course and Exam Description
- AP Comparative Government and Politics Course and Exam Description Clarifications and Corrections
- AP Comparative Government and Politics Course Overview
- AP Comparative Government and Politics Course at a Glance
- AP Comparative Government and Politics Course at a Glance Poster
- AP Comparative Government and Politics
- AP Comparative Government and Politics
- AP Comparative Government and Politics Sample Syllabus 1
- © 2024 College Board
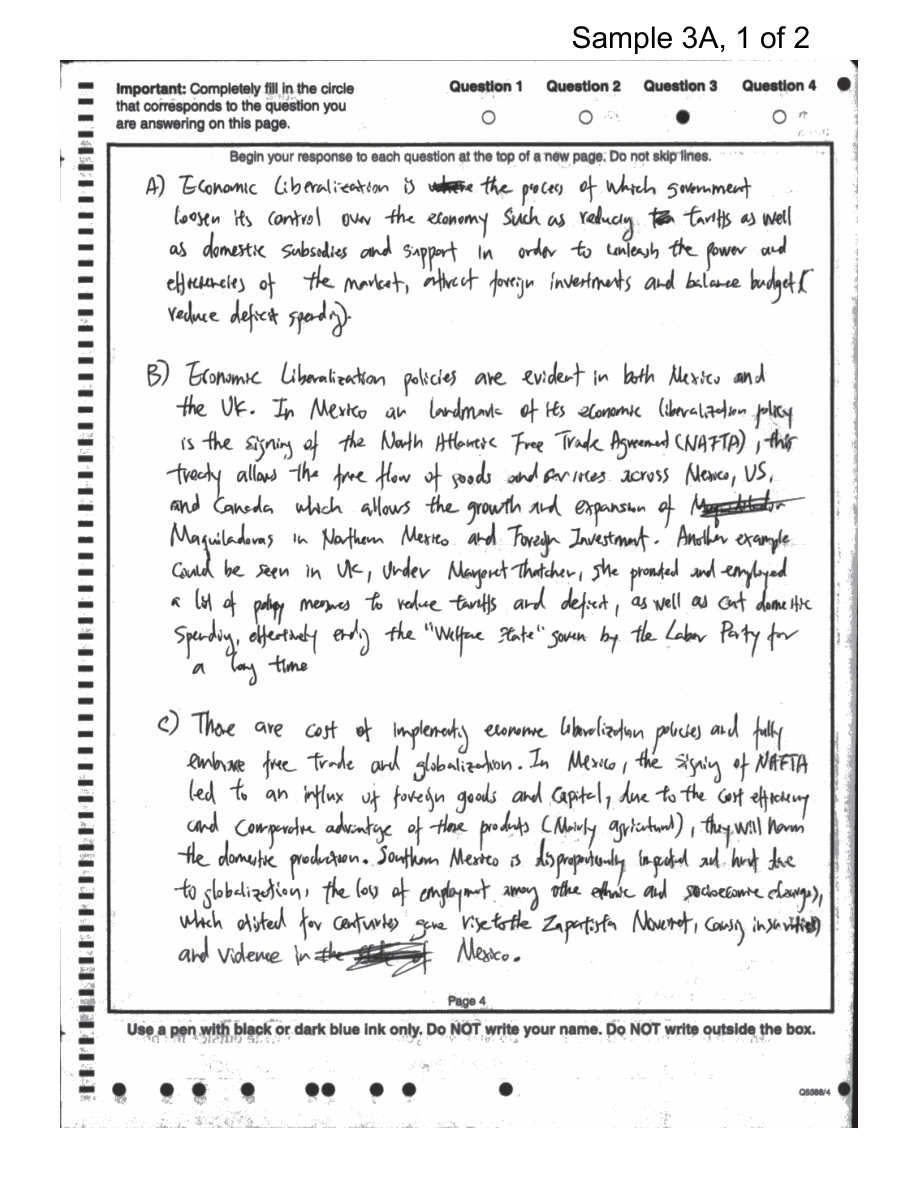
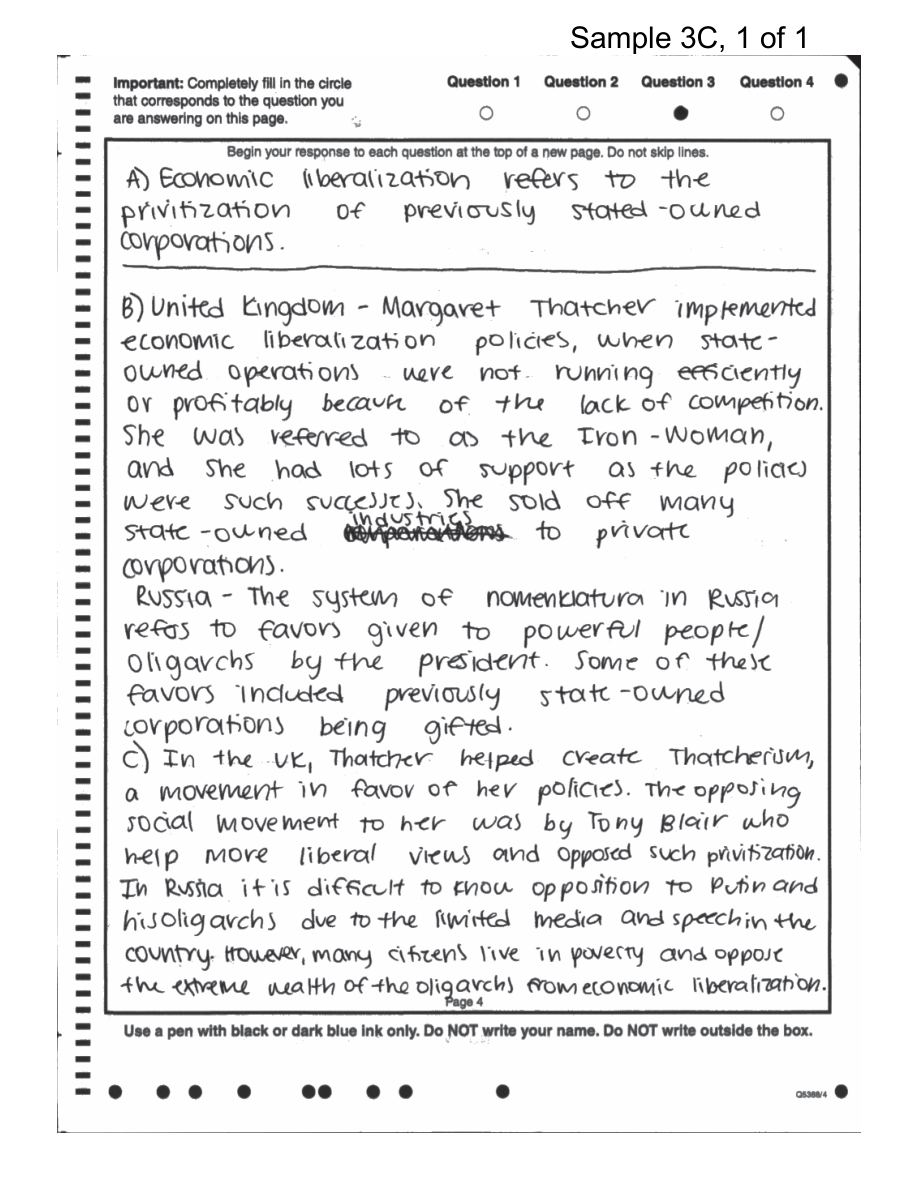
- Figure — Sample Responses Q3 - Set 1 (p. 4)
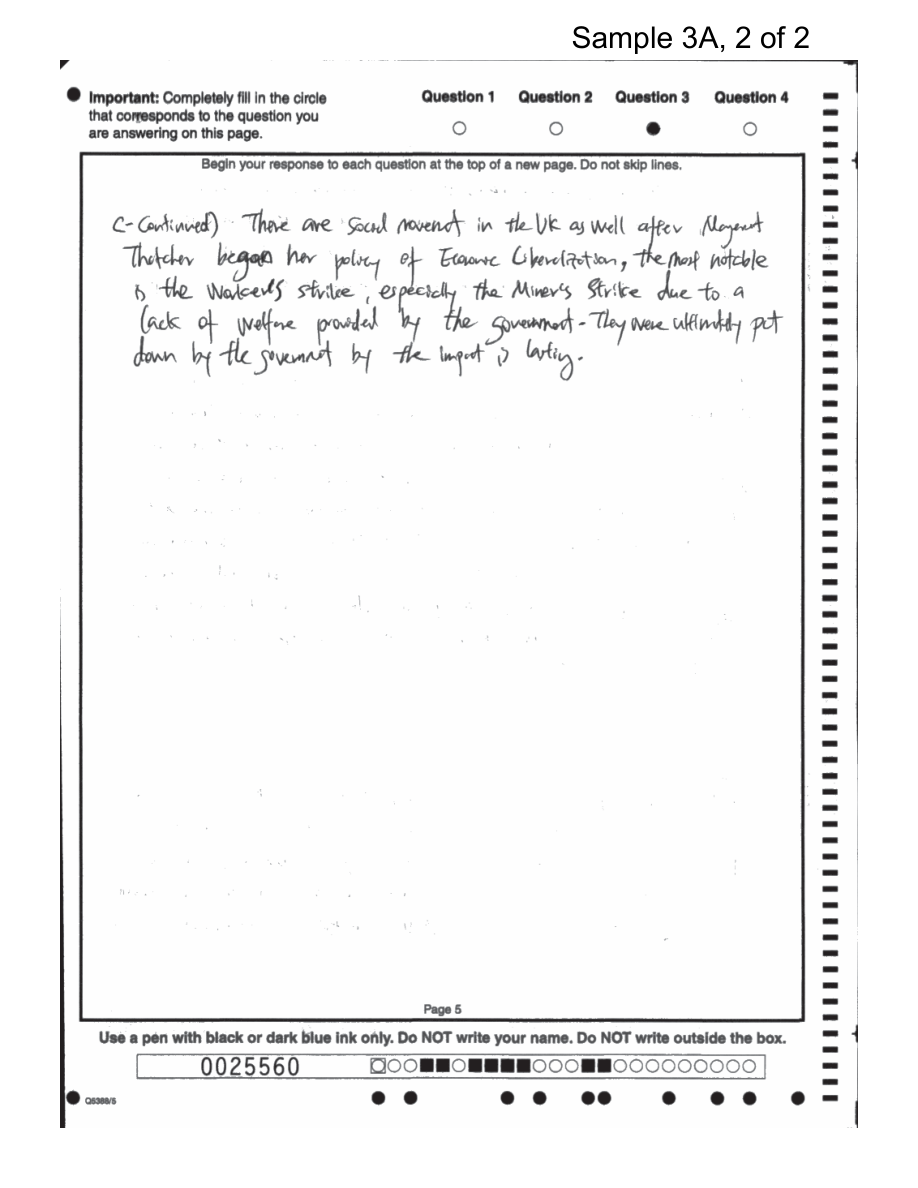
- Figure — Sample Responses Q3 - Set 1 (p. 5)
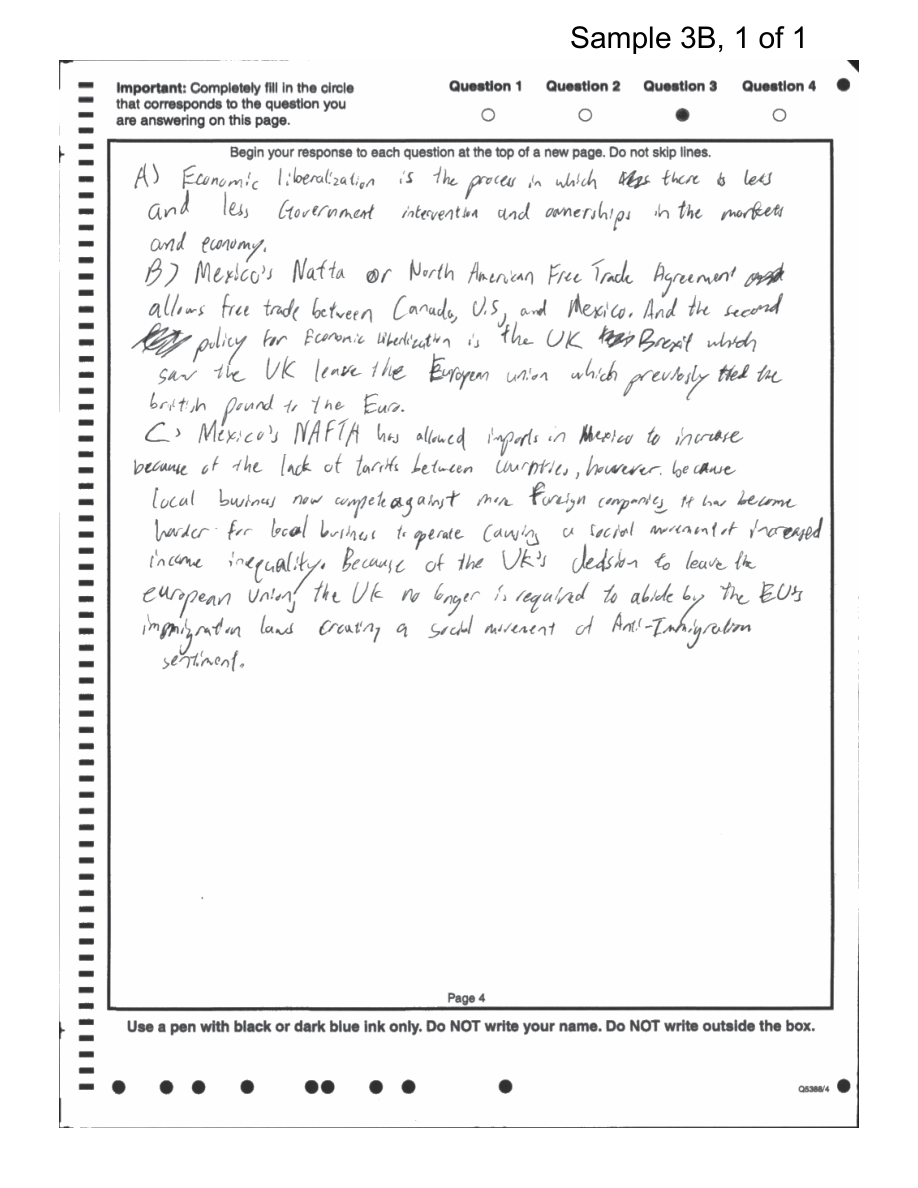
- Figure — Sample Responses Q3 - Set 1 (p. 6)